Embed Size (px)
Citation preview
1
MACROECONOMICSUNDERSTANDING THE GLOBAL ECONOMY
Total Factor Productivity, Human Capital, and Technology
Copyright © 2012 John Wiley & Sons, Inc. All rights reserved.
5-2
Key Concepts
Total Factor Productivity Human Capital Technological Progress Foreign Direct Investment
5-3
Capital
Rea
l GD
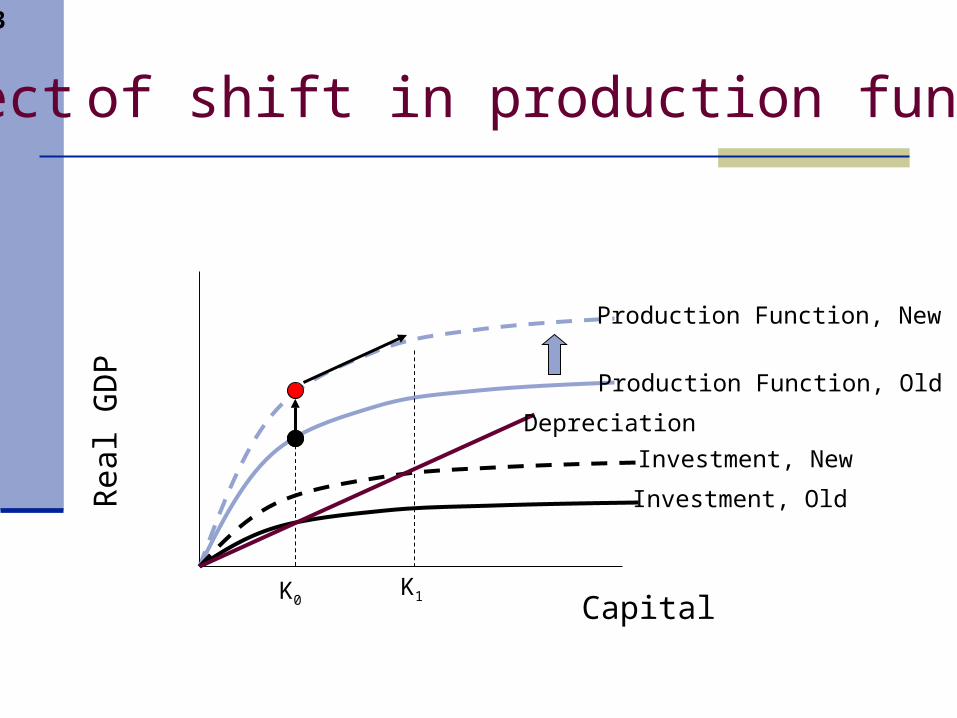
P Effect of shift in production function
K0K1
Production Function, Old
Production Function, New
Investment, Old
Investment, New
Depreciation
5-4
Production Function Shift
Increase in Output due to function shift Increase in Labor Increase in TFP
Increase in Output due to increase in capital Economy moves to new steady state As capital increases, output increases
Why does production function shift?
5-5
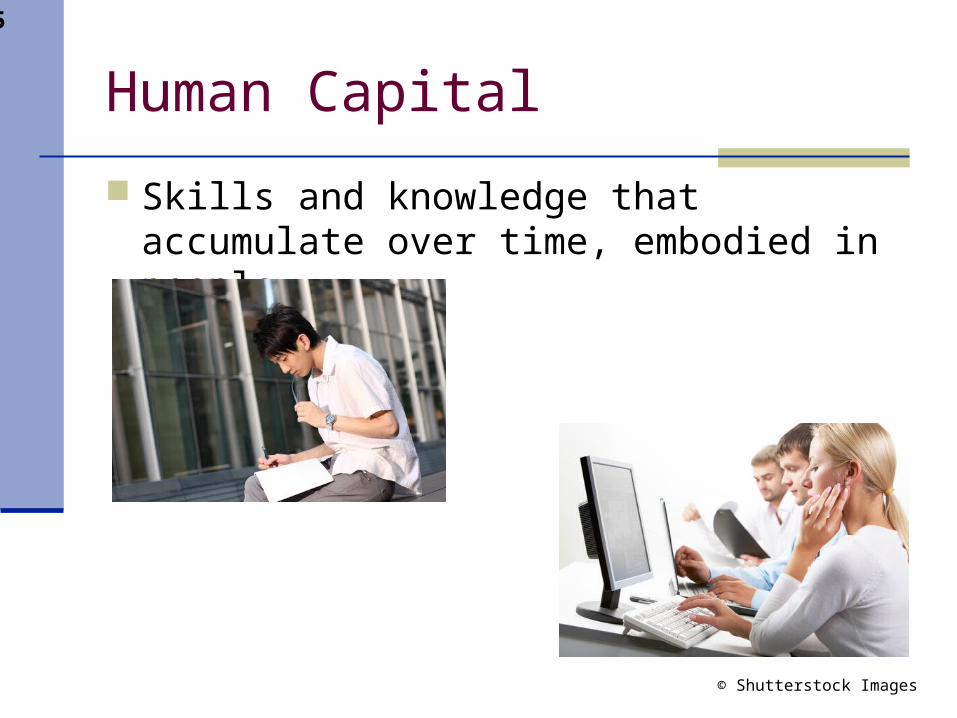
Human Capital
Skills and knowledge that accumulate over time, embodied in people
© Shutterstock Images
5-6
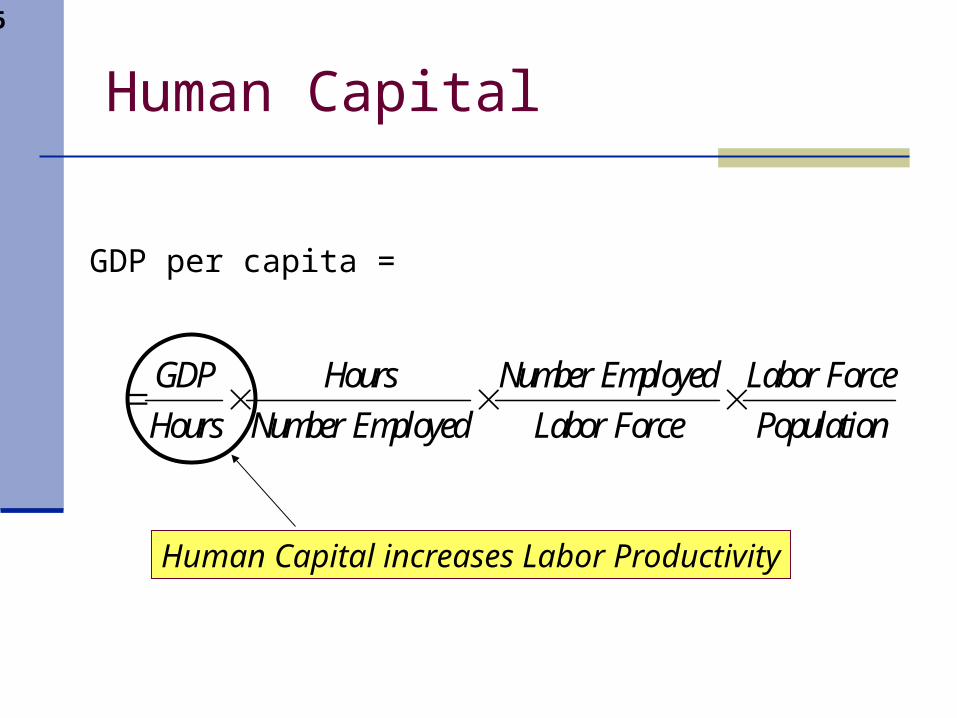
Human Capital
GDP per capita =
GDP Hours Number Employed Labor Force
Hours Number Employed Labor Force Population
Human Capital increases Labor Productivity
5-7
Capital
Rea
l GD
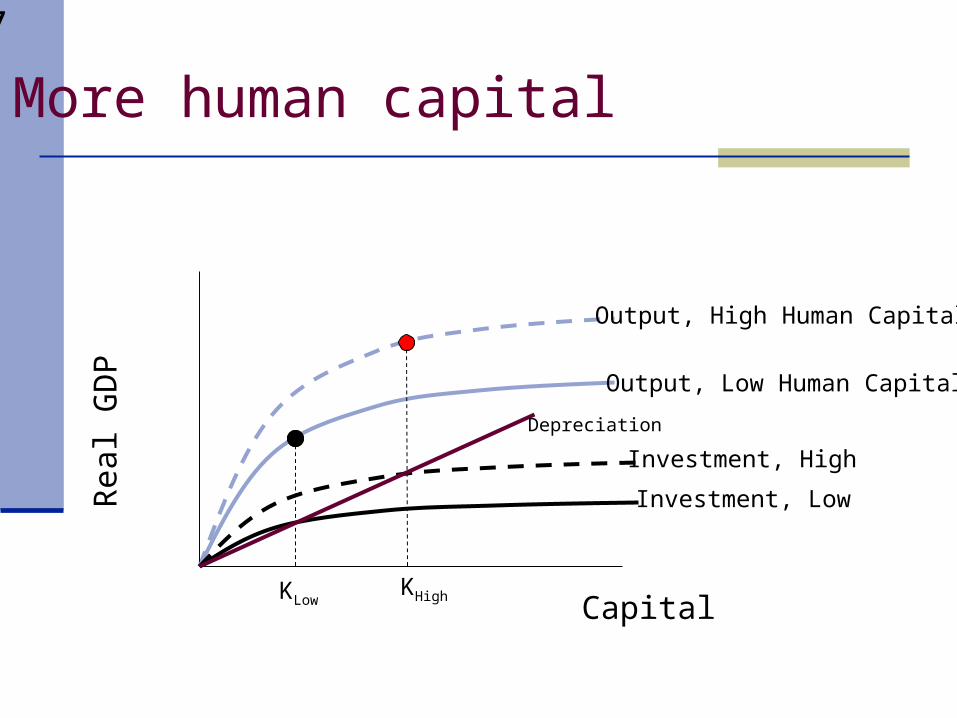
P More human capital
KLowKHigh
Output, Low Human Capital
Output, High Human Capital
Investment, Low
Investment, High
Depreciation
5-8
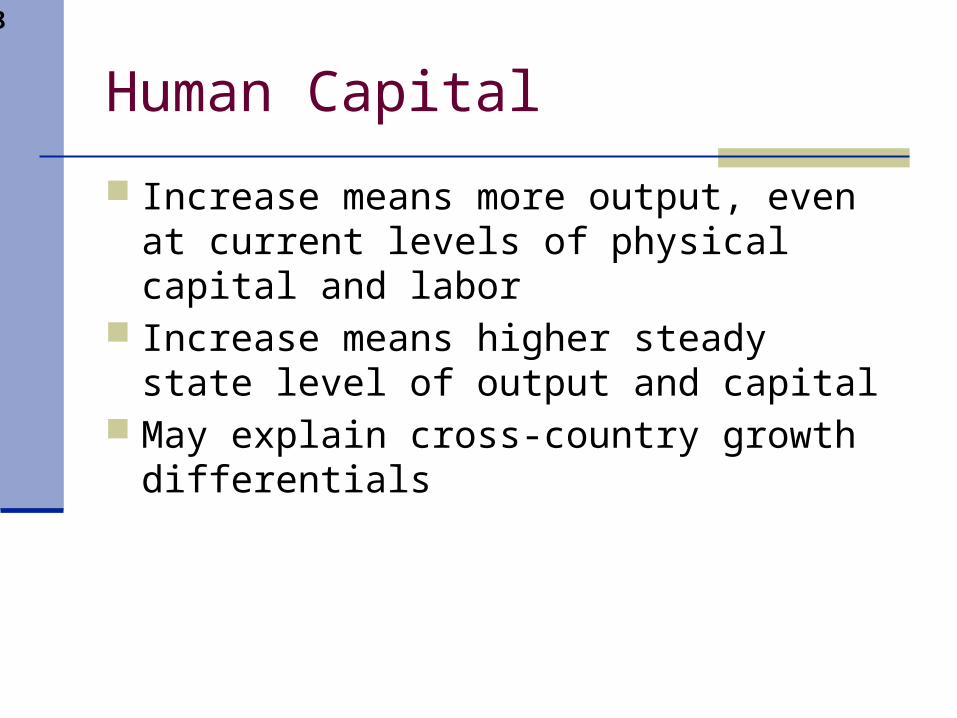
Human Capital
Increase means more output, even at current levels of physical capital and labor
Increase means higher steady state level of output and capital
May explain cross-country growth differentials
5-9
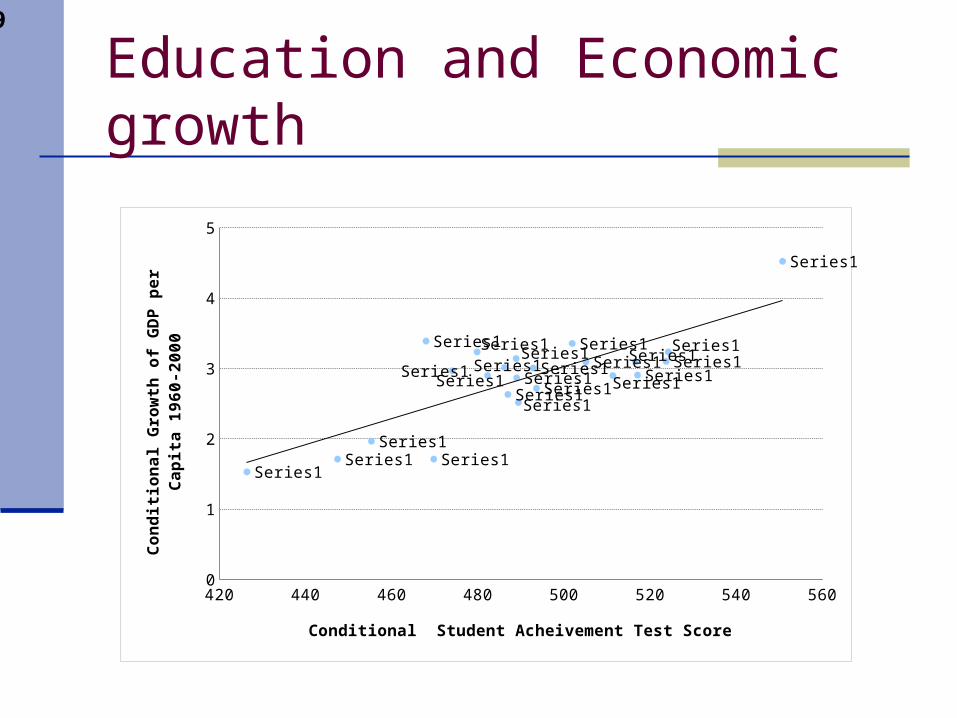
Education and Economic growth
420 440 460 480 500 520 540 5600
1
2
3
4
5
Series1Series1
Series1Series1
Series1
Series1
Series1
Series1Series1
Series1Series1
Series1
Series1Series1
Series1Series1Series1Series1Series1
Series1Series1
Series1
Series1
Conditional Student Acheivement Test Score
Co
nd
itio
na
l Gro
wth
of
GD
P p
er
Ca
pit
a 1
96
0-
20
00
5-10
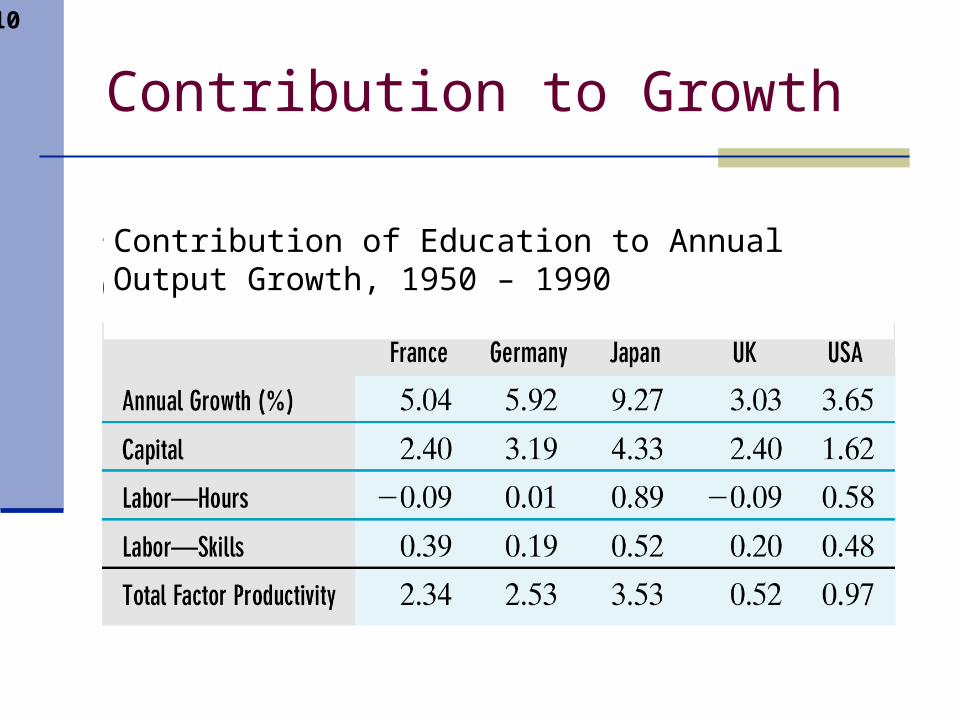
Contribution to Growth
Contribution of Education to Annual Output Growth, 1950 – 1990

5-11
How to increase human capital?
Educational attainment Expenditures on education
Allocation of resources Level of education Cost of education
5-12
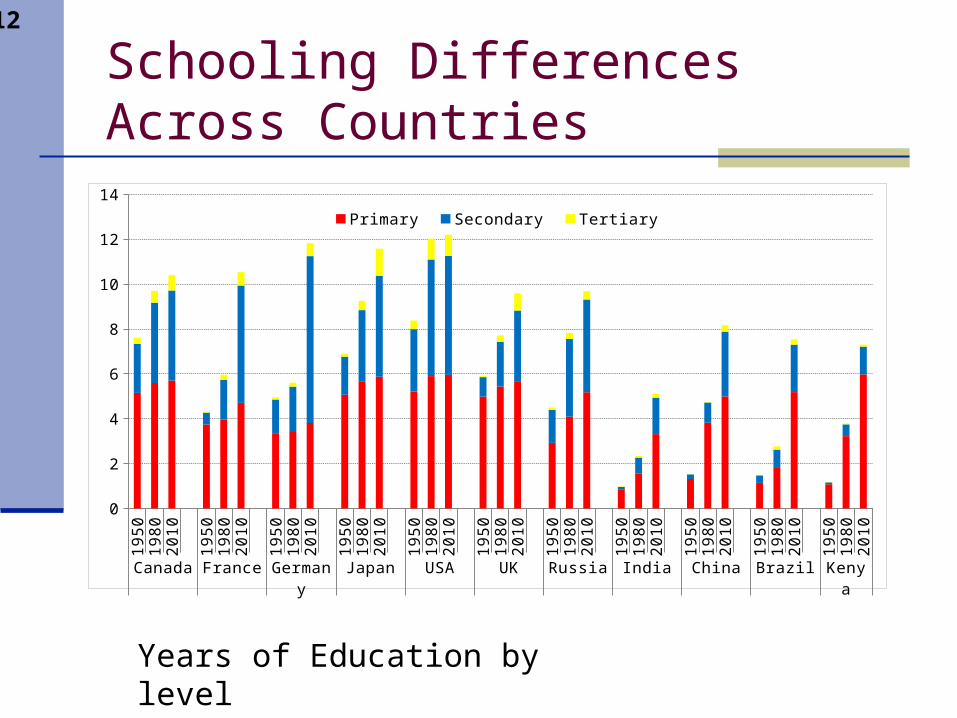
Schooling Differences Across Countries
19
50
19
80
20
10
19
50
19
80
20
10
19
50
19
80
20
10
19
50
19
80
20
10
19
50
19
80
20
10
19
50
19
80
20
10
19
50
19
80
20
10
19
50
19
80
20
10
19
50
19
80
20
10
19
50
19
80
20
10
19
50
19
80
20
10
Canada France Germany Japan USA UK Russia India China Brazil Kenya
0
2
4
6
8
10
12
14
Primary Secondary Tertiary
Years of Education by level
5-13
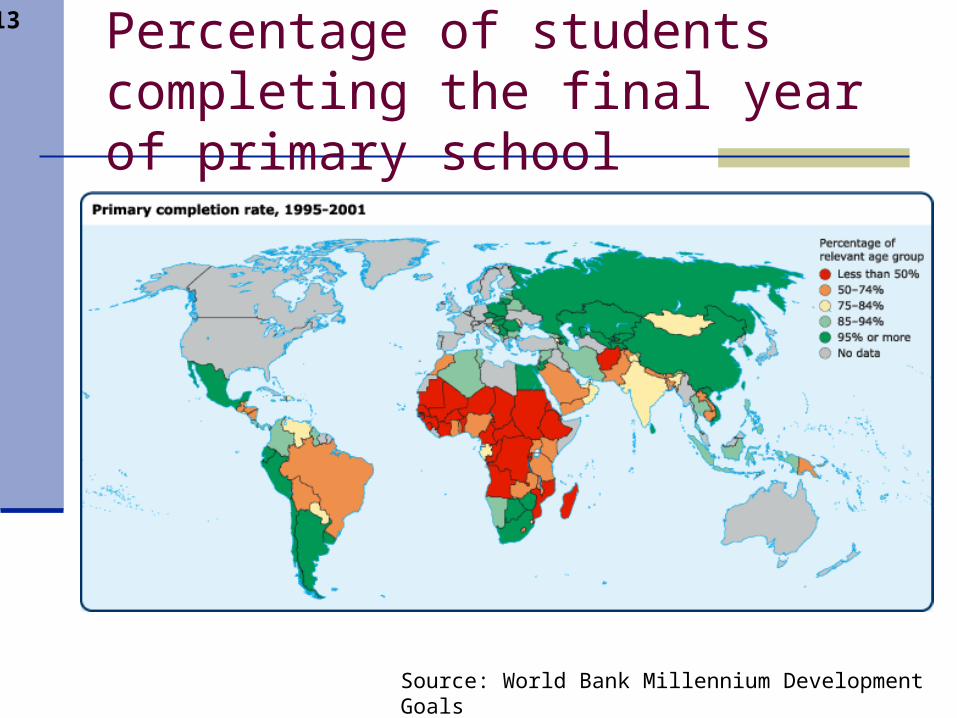
Percentage of students completing the final year of primary school
Source: World Bank Millennium Development Goals
5-14
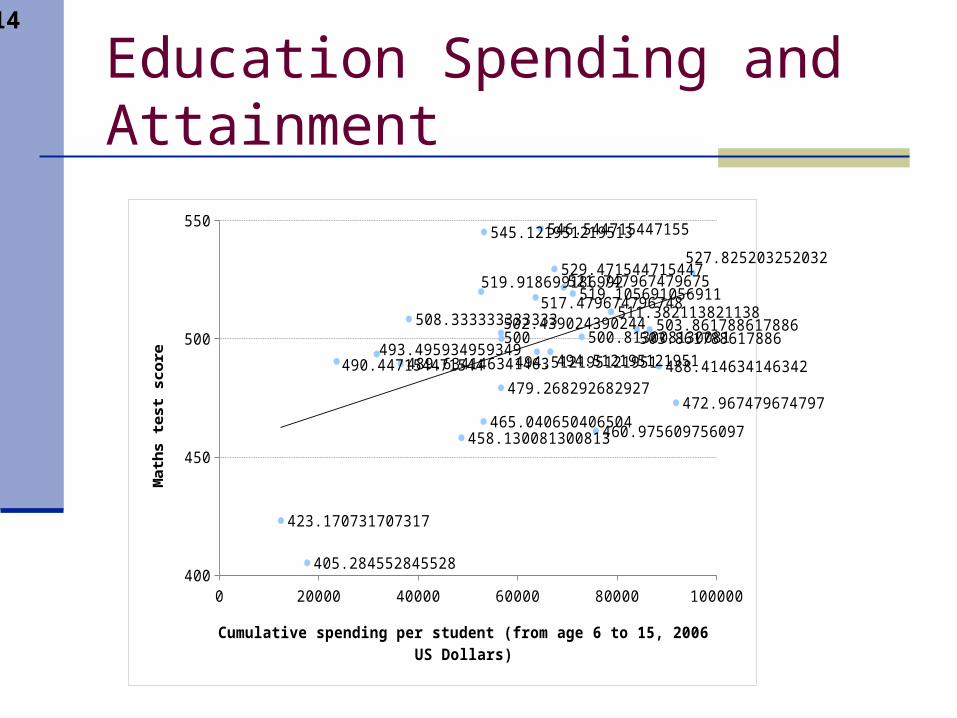
Education Spending and Attainment
0 20000 40000 60000 80000 100000400
450
500
550
423.170731707317
405.284552845528
490.447154471544493.495934959349
489.634146341463
508.333333333333
458.130081300813
519.918699186992
465.040650406504
545.121951219513
502.439024390244500
479.268292682927
494.512195121951494.512195121951
517.479674796748
546.544715447155
529.471544715447521.747967479675
519.105691056911
500.813008130081
460.975609756097
511.382113821138
503.861788617886503.861788617886
488.414634146342
472.967479674797
527.825203252033
Cumulative spending per student (from age 6 to 15, 2006 US Dollars)
Mat
hs
test
sco
re
5-15
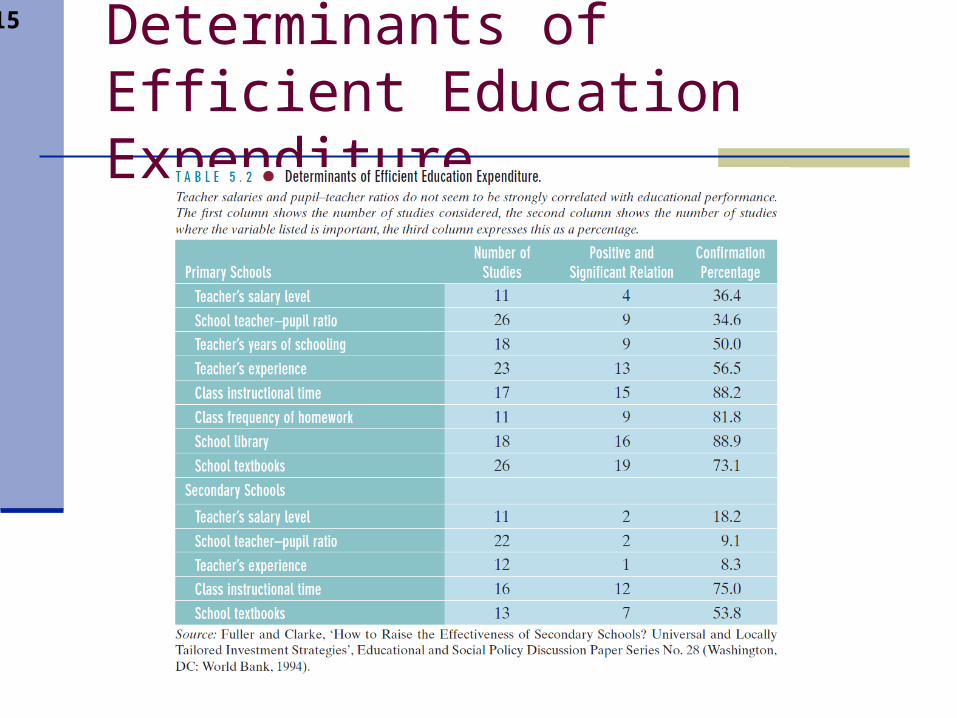
Determinants of Efficient Education Expenditure.
5-16
Review
Cross-country differentials in per capita output are substantial Role of physical capital Role of human capital
Significant fraction of differential is unexplained – we call this “TFP” Other elements of TFP
5-17
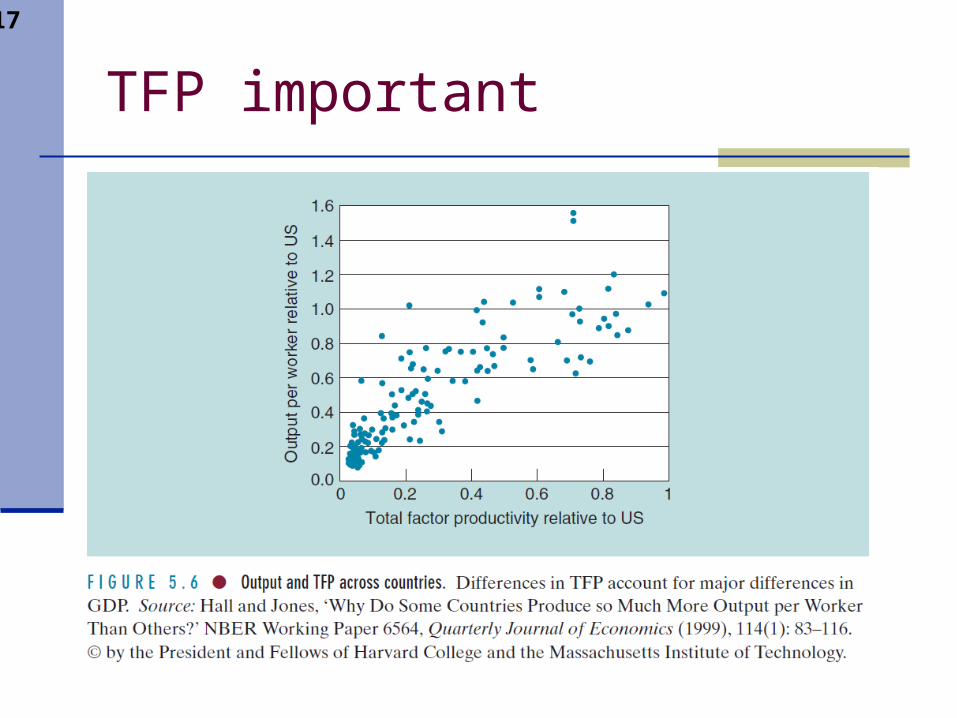
TFP important
5-18
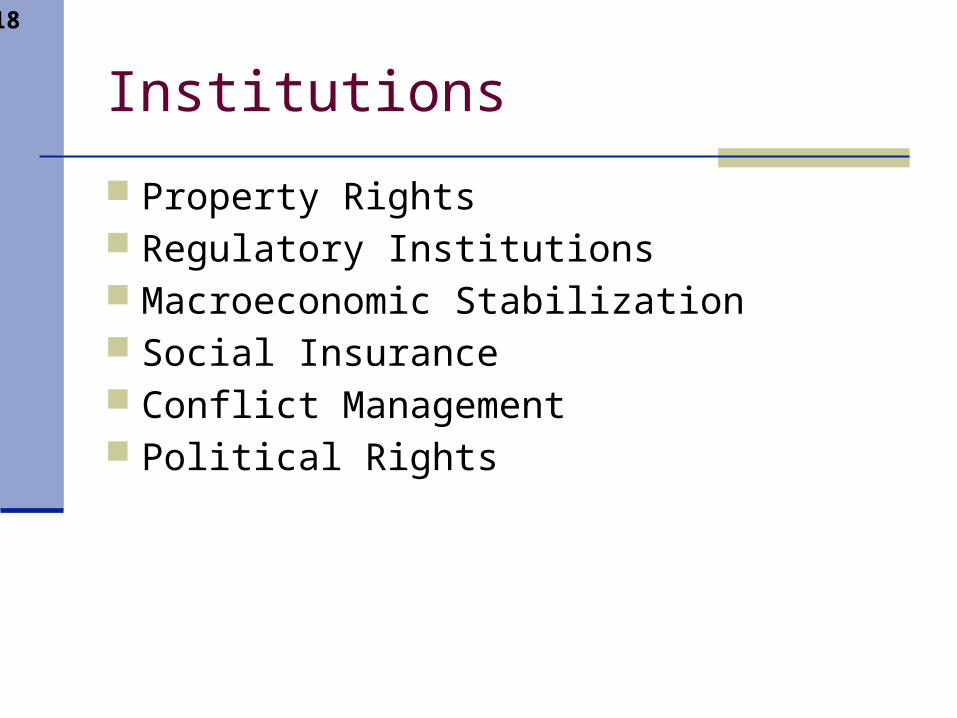
Institutions
Property Rights Regulatory Institutions Macroeconomic Stabilization Social Insurance Conflict Management Political Rights
5-19
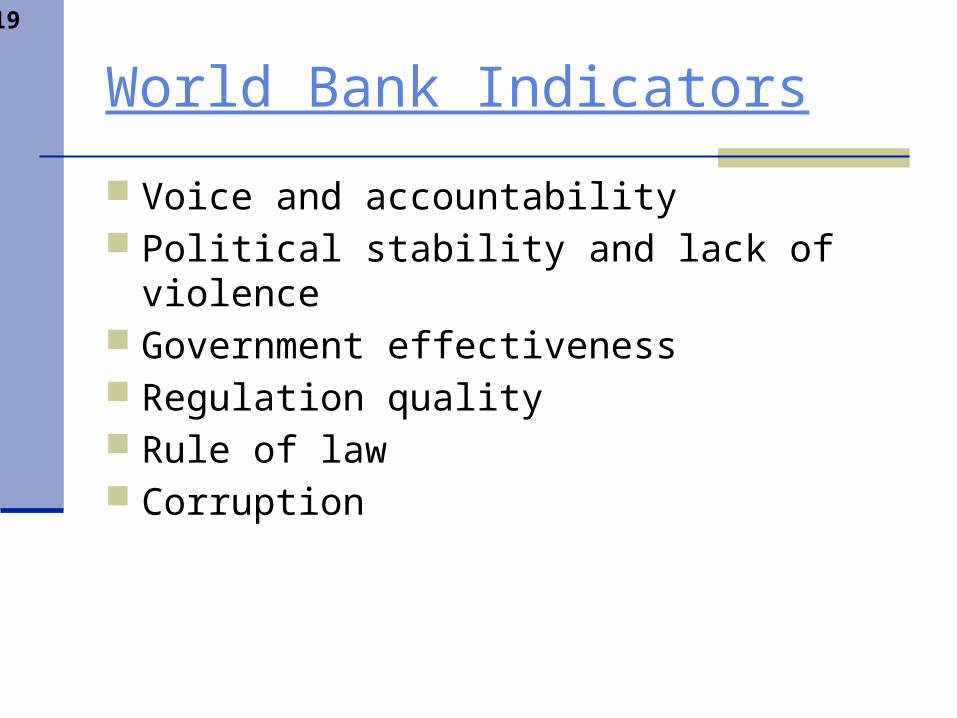
World Bank Indicators
Voice and accountability Political stability and lack of violence Government effectiveness Regulation quality Rule of law Corruption
5-20
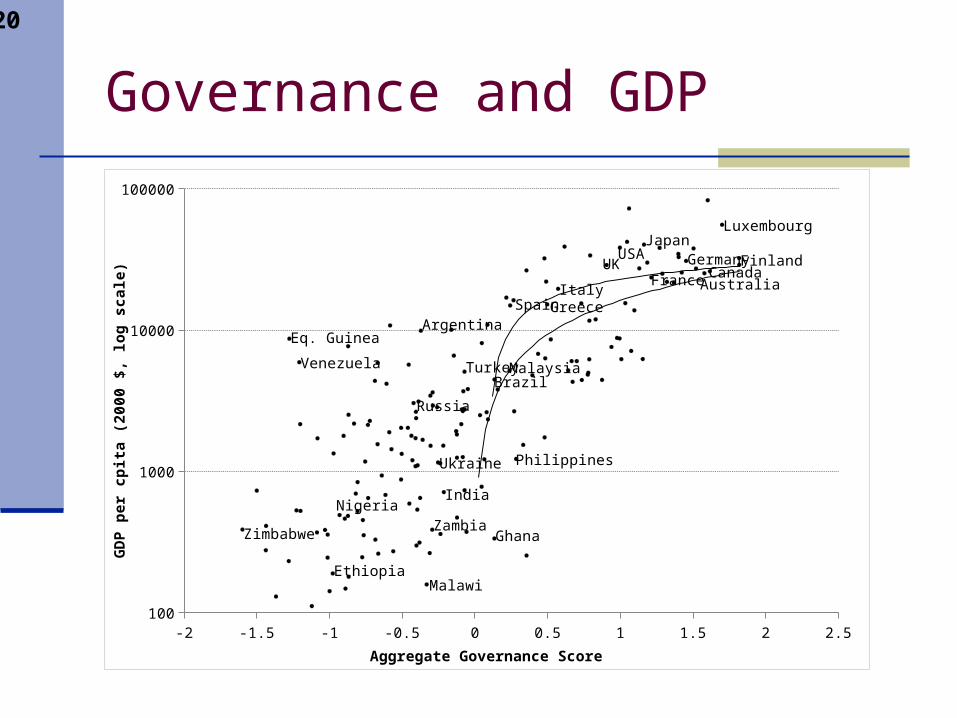
Governance and GDP
-2 -1.5 -1 -0.5 0 0.5 1 1.5 2 2.5100
1000
10000
100000
Argentina
Canada
Brazil
Australia
Russia
Eq. Guinea
Ethiopia
FinlandFrance
Germany
Ghana
Greece
India
Italy
JapanLuxembourg
Malawi
Malaysia
UK
Nigeria
Philippines
Spain
Turkey
Ukraine
USA
Venezuela
ZambiaZimbabwe
Aggregate Governance Score
GD
P p
er c
pit
a (2
000
$, lo
g s
cale
)
5-21
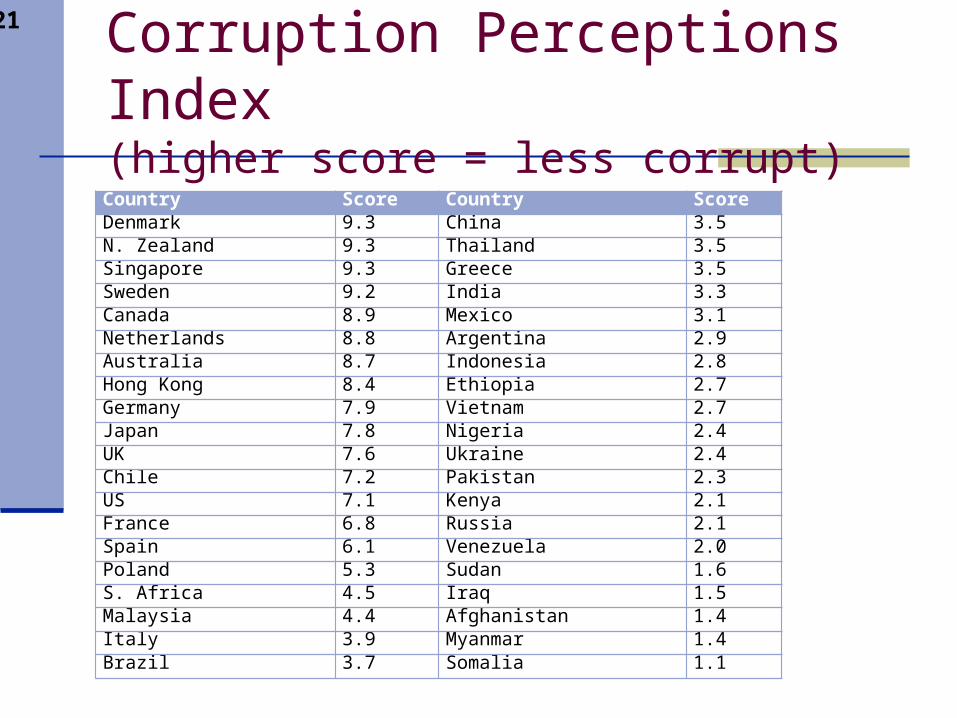
Corruption Perceptions Index (higher score = less corrupt)
Country Score Country ScoreDenmark 9.3 China 3.5N. Zealand 9.3 Thailand 3.5Singapore 9.3 Greece 3.5Sweden 9.2 India 3.3Canada 8.9 Mexico 3.1Netherlands 8.8 Argentina 2.9Australia 8.7 Indonesia 2.8Hong Kong 8.4 Ethiopia 2.7Germany 7.9 Vietnam 2.7Japan 7.8 Nigeria 2.4UK 7.6 Ukraine 2.4Chile 7.2 Pakistan 2.3US 7.1 Kenya 2.1France 6.8 Russia 2.1Spain 6.1 Venezuela 2.0Poland 5.3 Sudan 1.6S. Africa 4.5 Iraq 1.5Malaysia 4.4 Afghanistan 1.4Italy 3.9 Myanmar 1.4Brazil 3.7 Somalia 1.1
5-22
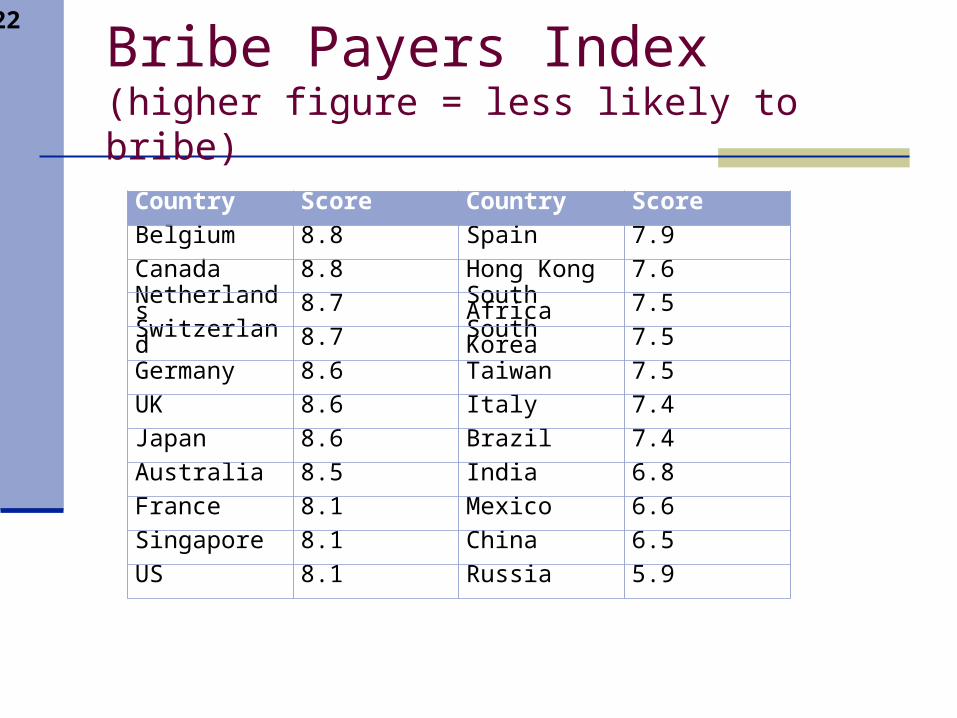
Bribe Payers Index(higher figure = less likely to bribe)
Country Score Country Score
Belgium 8.8 Spain 7.9
Canada 8.8 Hong Kong 7.6
Netherlands 8.7 South Africa 7.5
Switzerland 8.7 South Korea 7.5
Germany 8.6 Taiwan 7.5
UK 8.6 Italy 7.4
Japan 8.6 Brazil 7.4
Australia 8.5 India 6.8
France 8.1 Mexico 6.6
Singapore 8.1 China 6.5
US 8.1 Russia 5.9
5-23
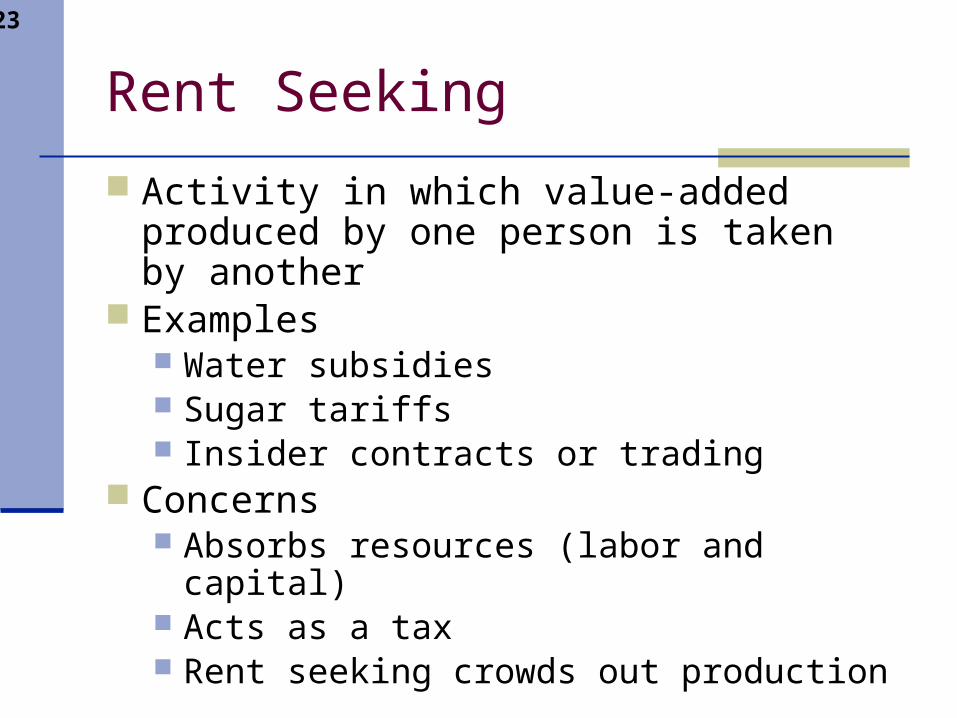
Rent Seeking
Activity in which value-added produced by one person is taken by another
Examples Water subsidies Sugar tariffs Insider contracts or trading
Concerns Absorbs resources (labor and capital) Acts as a tax Rent seeking crowds out production
5-24
R & D
Growth can be sustained through technological progress
Role of Research and Development in promoting technological progress
Example of South Korea
© Shutterstock Images
5-25
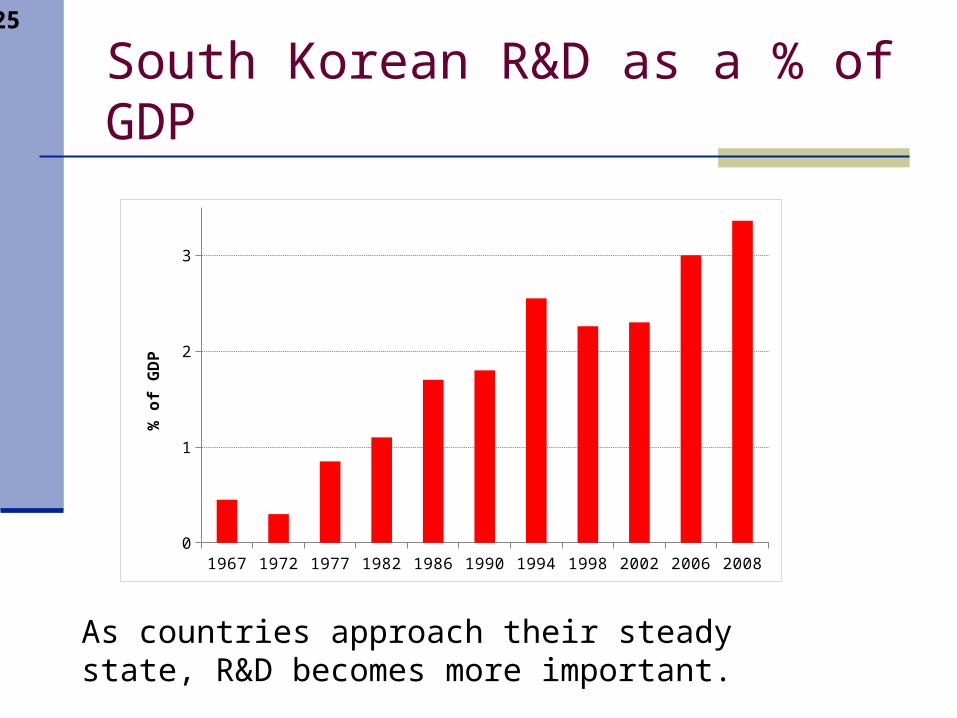
South Korean R&D as a % of GDP
1967 1972 1977 1982 1986 1990 1994 1998 2002 2006 20080
1
2
3
% o
f G
DP
As countries approach their steady state, R&D becomes more important.
5-26
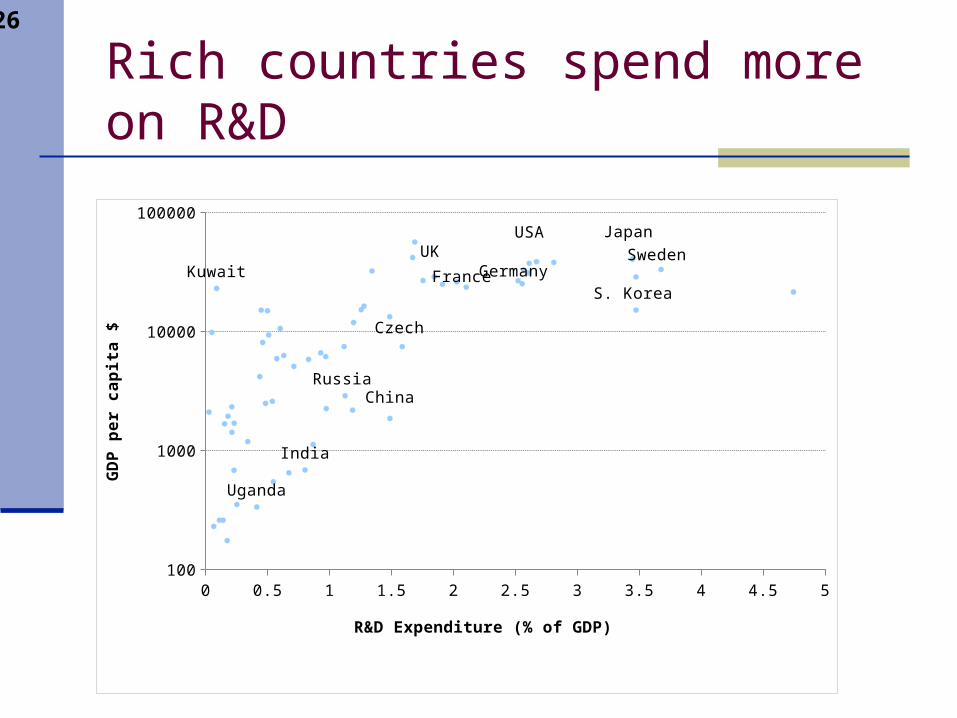
Rich countries spend more on R&D
0 0.5 1 1.5 2 2.5 3 3.5 4 4.5 5100
1000
10000
100000
China
Czech
FranceGermany
India
Japan
S. KoreaKuwait
Russia
Sweden
Uganda
UKUSA
R&D Expenditure (% of GDP)
GD
P p
er
ca
pit
a $
5-27
Foreign Direct Investment
Investment by foreign firms in an economy Encourages capital accumulation and
technology transfer Can facilitate convergence among countries
5-28
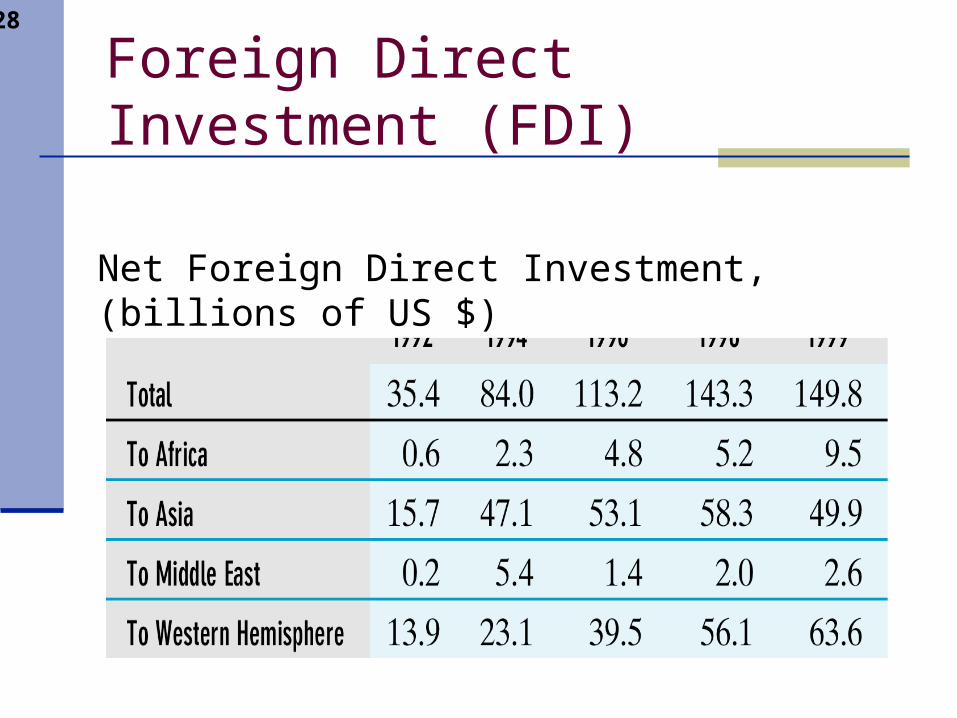
Foreign Direct Investment (FDI)
Net Foreign Direct Investment, (billions of US $)
5-29
Summary
Effect of increases in TFP Effect of human capital accumulation Other influences on growth
Institutions Technological Progress FDI
Copyright © 2012 John Wiley & Sons, Inc. All rights reserved. Reproduction or translation of this work beyond that permitted in Section 117 of the 1976 United States Copyright Act without the express written permission of the copyright owner is unlawful. Request for further information should be addressed to the Permissions Department, John Wiley & Sons, Inc. The purchaser may make back-up copies for his/her own use only and not for distribution or resale. The Publisher assumes no responsibility for errors, omissions, or damages caused by the use of these programs or from the use of the information contained therein.