Embed Size (px)
Citation preview
1
Lecture Outline
Types of stereotypesAssumptions of stereotypes Definition of stereotypesMeasurement of stereotypesStereotypes: inaccurate, exaggerated, and resistant
to change?
Extra Credit next week at start of class

2
Extra CreditNext Wednesday (April 3rd) there will be an
experiment. If you are late, you can’t participate and will miss the extra credit
Participation will earn you extra credit that will be added to final grade in class
Participation is of course voluntary
3
Midterm
Grades have been posted on 1st floor of Lago
To see exam, please make an appt. with me or TA
4
Stereotypes
Working definition:
Generalized beliefs
about a social group
attributes behaviors social roles(nurturing) (homemakers)(take care of children)
5
Types of Stereotypes
Cultural stereotypes
Beliefs about a group that
are endorsed by society at large
Examples……...
6
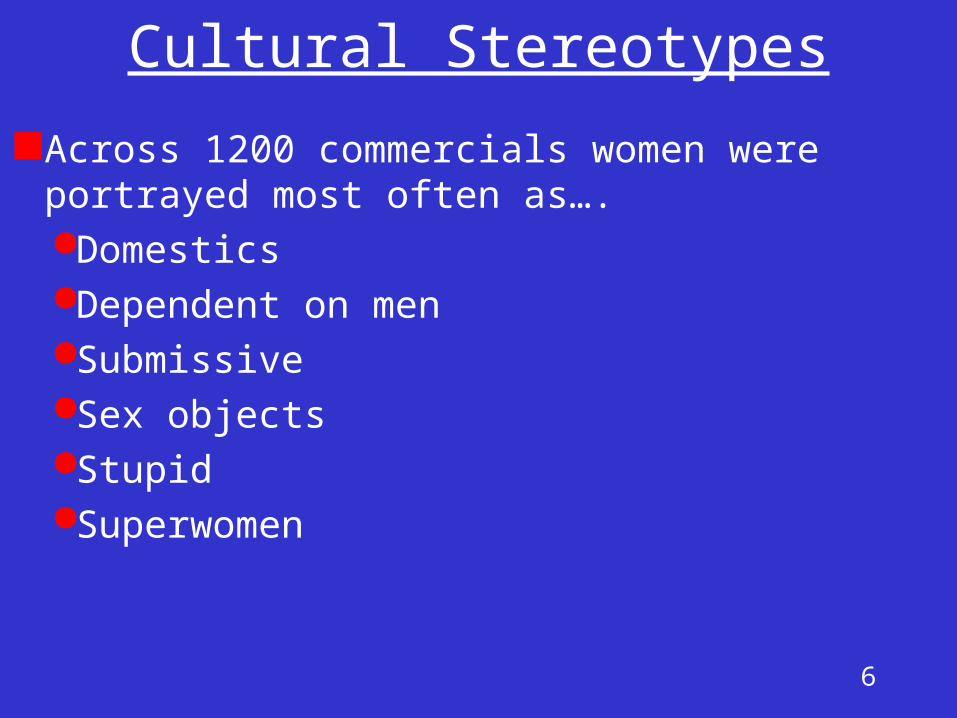
Cultural Stereotypes
Across 1200 commercials women were portrayed most often as….Domestics Dependent on menSubmissiveSex objects StupidSuperwomen
7
Types of Stereotypes
Personal (individual) stereotypes
One person’s beliefs
about a group
8
Cultural and Personal StereotypesSometimes they overlap:
Society portrays New Yorkers as loud, and Mary thinks they are loud too
Sometimes they don’t overlap:
Society portrays Librarians as spinsters, but Mary doesn’t think they are
9
Consensual Stereotypes
Definition:
Extent to which people agree on the content of a stereotype
High consensus = high agreement
10
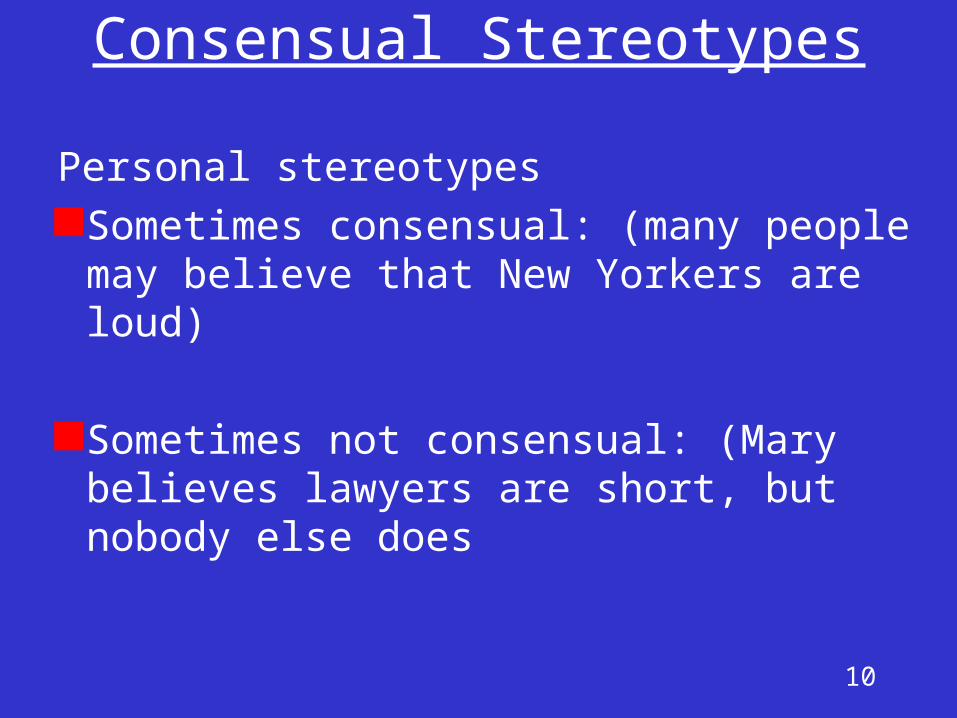
Consensual Stereotypes
Personal stereotypesSometimes consensual: (many people
may believe that New Yorkers are loud)
Sometimes not consensual: (Mary believes lawyers are short, but nobody else does
11
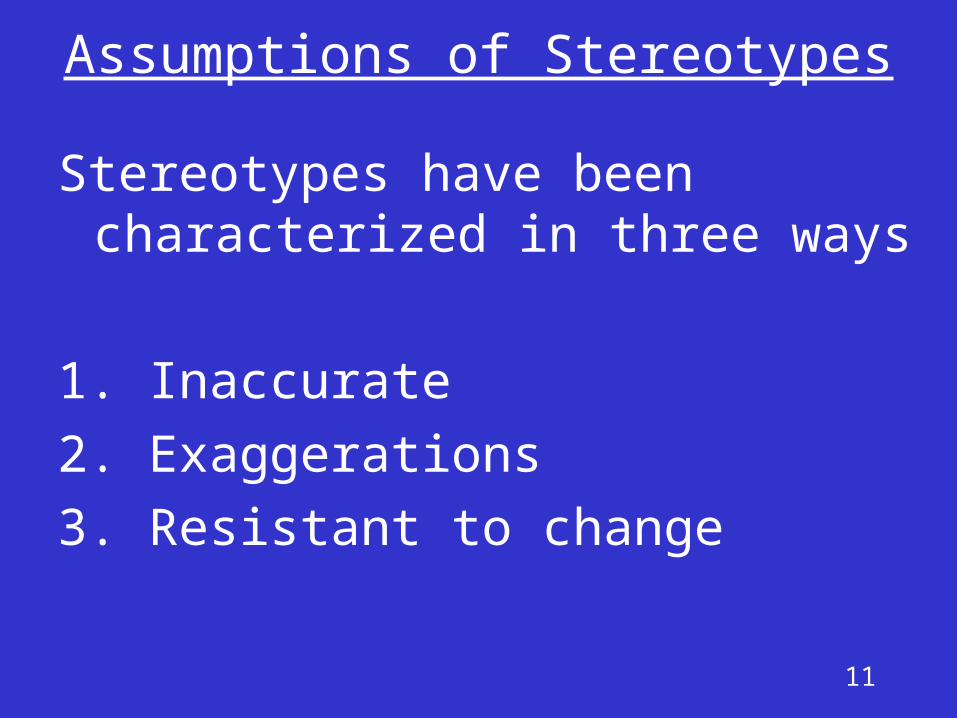
Assumptions of Stereotypes
Stereotypes have been characterized in three ways
1. Inaccurate
2. Exaggerations
3. Resistant to change
12
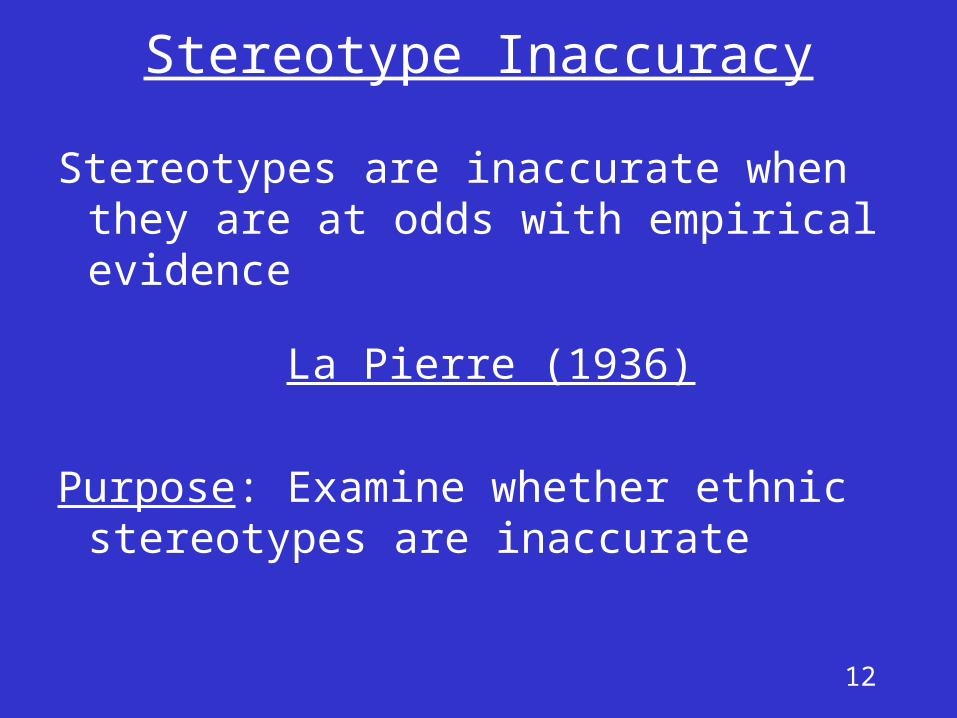
Stereotype Inaccuracy
Stereotypes are inaccurate when they are at odds with empirical evidence
La Pierre (1936)
Purpose: Examine whether ethnic stereotypes are inaccurate
13
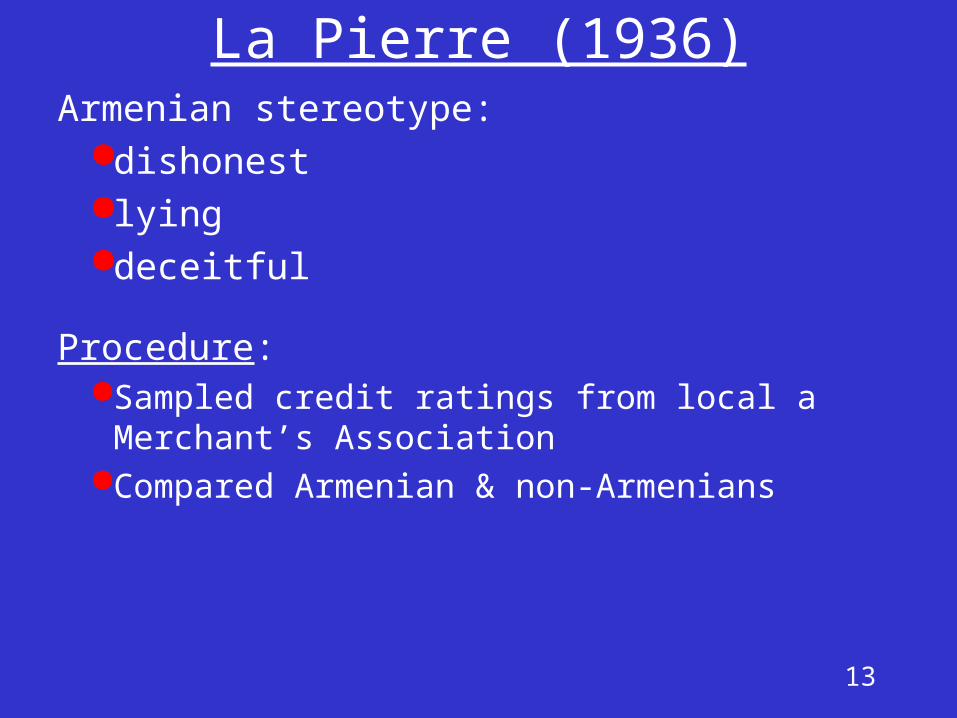
La Pierre (1936)Armenian stereotype:
dishonestlyingdeceitful
Procedure: Sampled credit ratings from local a Merchant’s
AssociationCompared Armenian & non-Armenians
14
La Pierre (1936)
Prediction: If Armenians really are dishonest, lying, and deceitful, then they should have worse credit ratings than non-Armenians
15
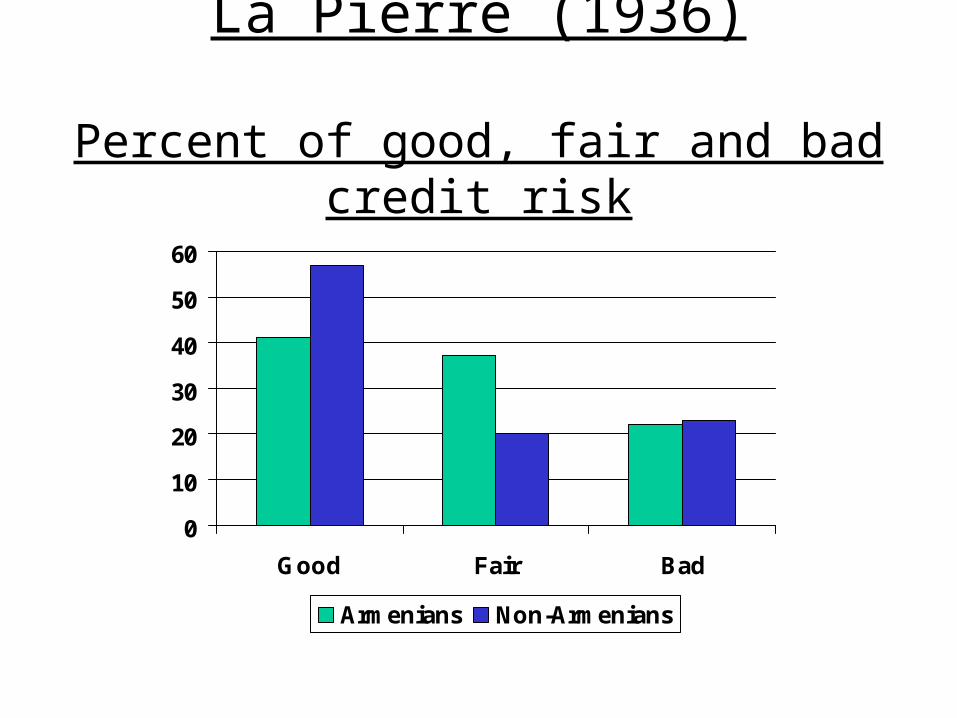
La Pierre (1936)
Percent of good, fair and bad credit risk
0
10
20
30
40
50
60
Good Fair Bad
Armenians Non-Armenians
16
La Pierre (1936)
Armenian stereotype did NOT correspond to empirical evidence
The stereotype was inaccurate
17
Stereotype are Exaggerations
Stereotypes are exaggerations when differences between groups are thought to be larger than they really are
Example…….
18
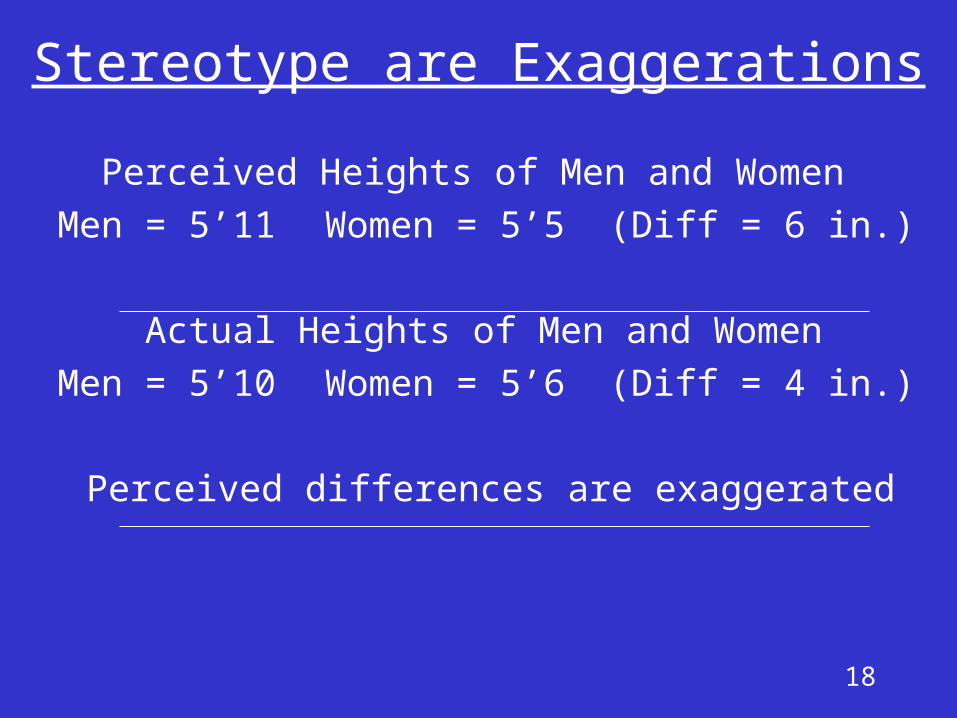
Stereotype are Exaggerations
Perceived Heights of Men and Women
Men = 5’11 Women = 5’5 (Diff = 6 in.)
Actual Heights of Men and Women
Men = 5’10 Women = 5’6 (Diff = 4 in.)
Perceived differences are exaggerated
19
Stereotypes are Resistant to Change
Stereotypes remain stable over time and across generations
20
Are stereotypes inherently inaccurate, always exaggerated, and highly resistant to change?
No.
As you will see soon, stereotypes
have been stereotyped!!
21
Definitions of Stereotypes
For most of the 20th Century researchers did not have a good, clear definition of the term “stereotype”
22
Definitions of Stereotypes
Ashmore & Del Boca (1981)
Sampled the literature to identify how stereotypes were defined.
This is what they found……….
23
Ashmore & Del Boca (1981)
Stereotypes had been
defined in six different ways!!
24
1. Generalized Beliefs
Stereotyping may be defined as the tendency to attribute generalized and simplified characteristics to groups of people in the form of verbal labels, and to act towards the members of those groups in terms of those labels (Vinacke, 1949, p. 265).
25
2. Categories or Concepts
A stereotype is commonly thought of as involving a categorical response--i.e., membership is sufficient to evoke the judgment that the stimulus person possesses all of the attributes belonging to that category (Secord, 1959, p. 309).
26
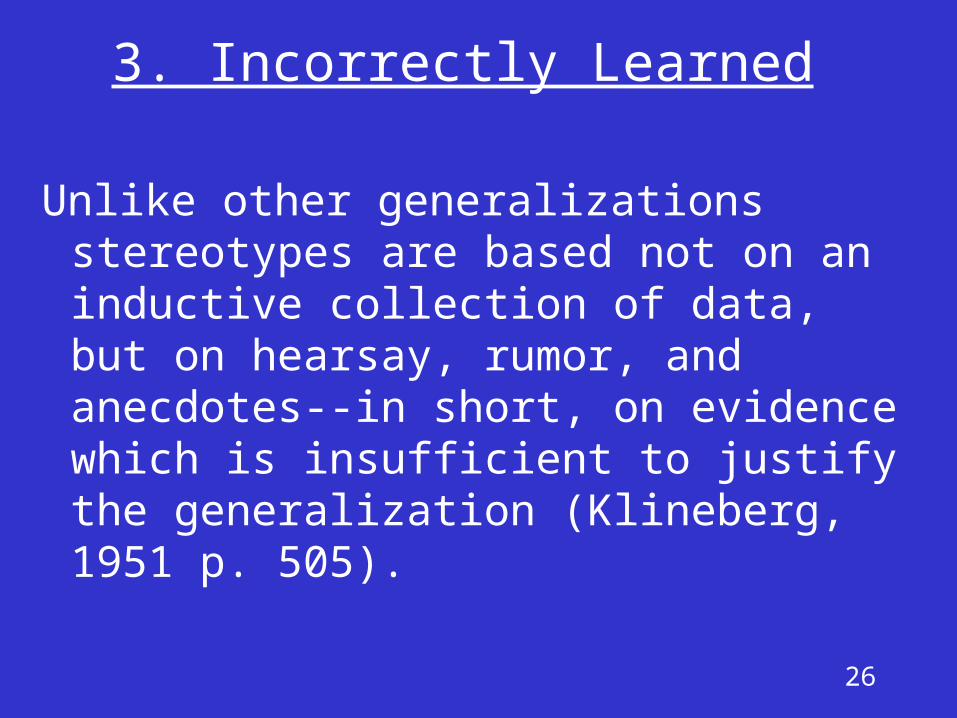
3. Incorrectly Learned
Unlike other generalizations stereotypes are based not on an inductive collection of data, but on hearsay, rumor, and anecdotes--in short, on evidence which is insufficient to justify the generalization (Klineberg, 1951 p. 505).
27
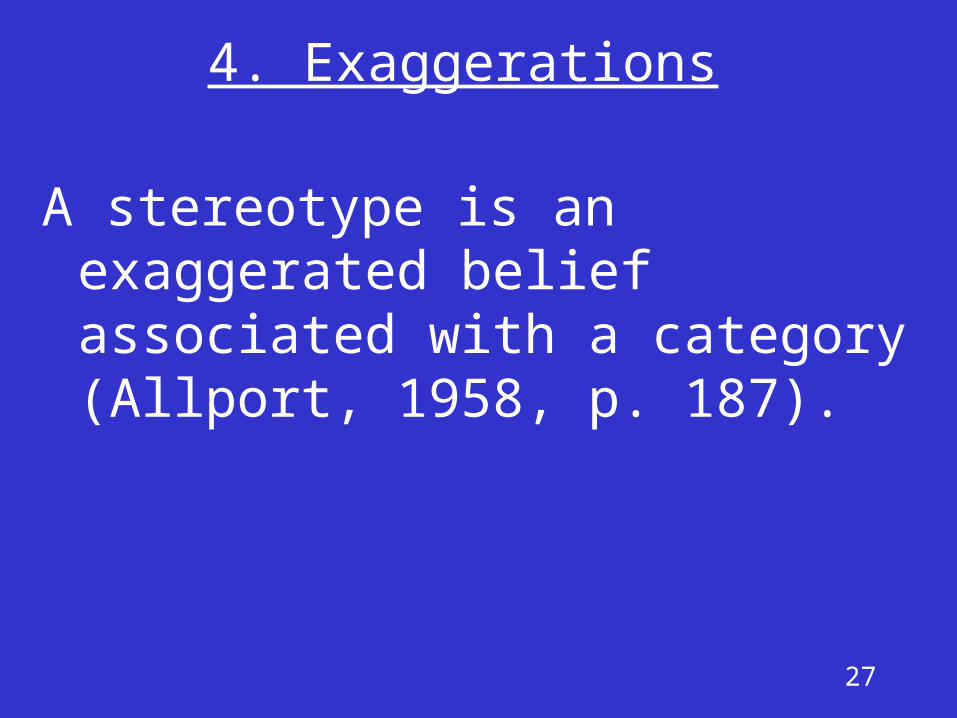
4. Exaggerations
A stereotype is an exaggerated belief associated with a category (Allport, 1958, p. 187).
28
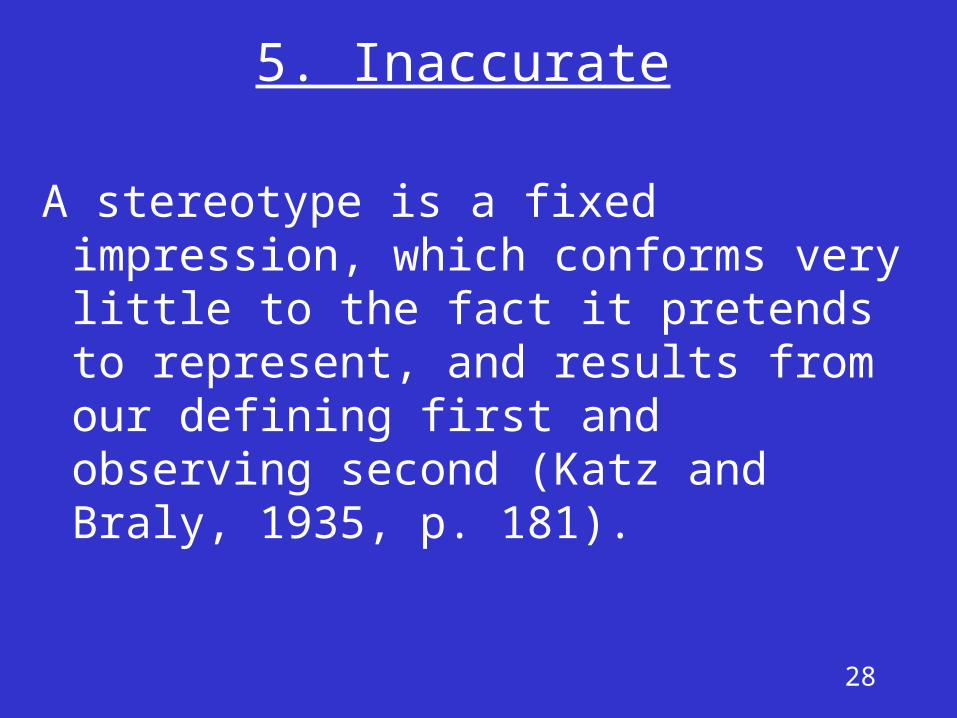
5. Inaccurate
A stereotype is a fixed impression, which conforms very little to the fact it pretends to represent, and results from our defining first and observing second (Katz and Braly, 1935, p. 181).
29
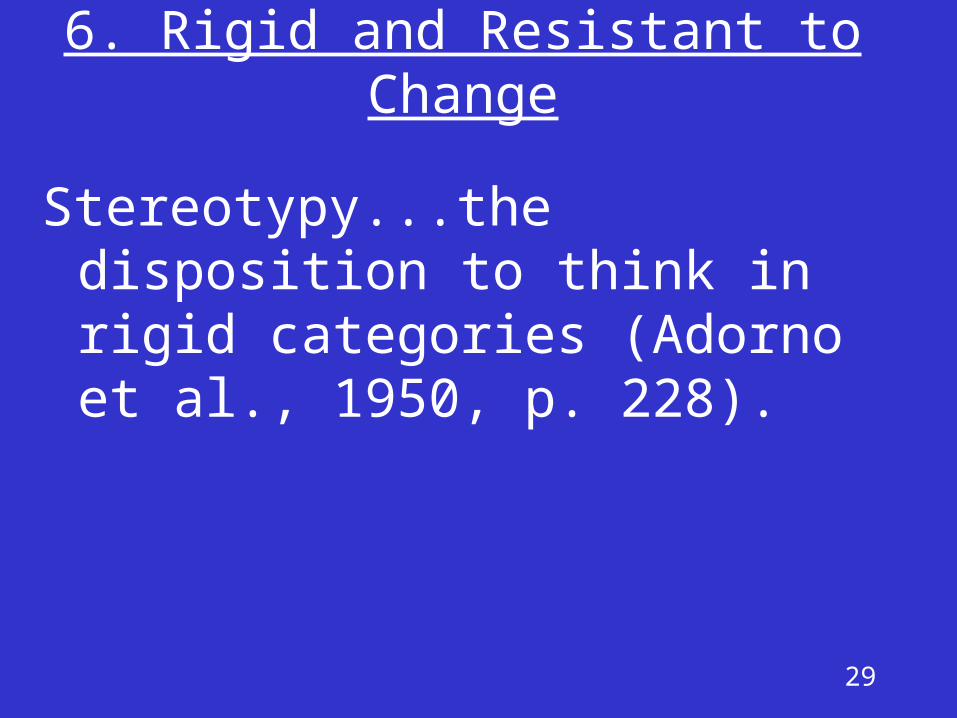
6. Rigid and Resistant to Change
Stereotypy...the disposition to think in rigid categories (Adorno et al., 1950, p. 228).
30
YIKES!
What sense can one
make of all that?
Field lacking formal, consistent and clear definition of the term “stereotype”
31
Ashmore & Del Boca (1981)
Offered A Formal Definition
“A set of beliefs about the personal attributes of a
group of people”
32
Ashmore & Del Boca (1981)
Limitation:
Lots of attributes describe members of social groups, but they are not part of the stereotype
Example……..….
33
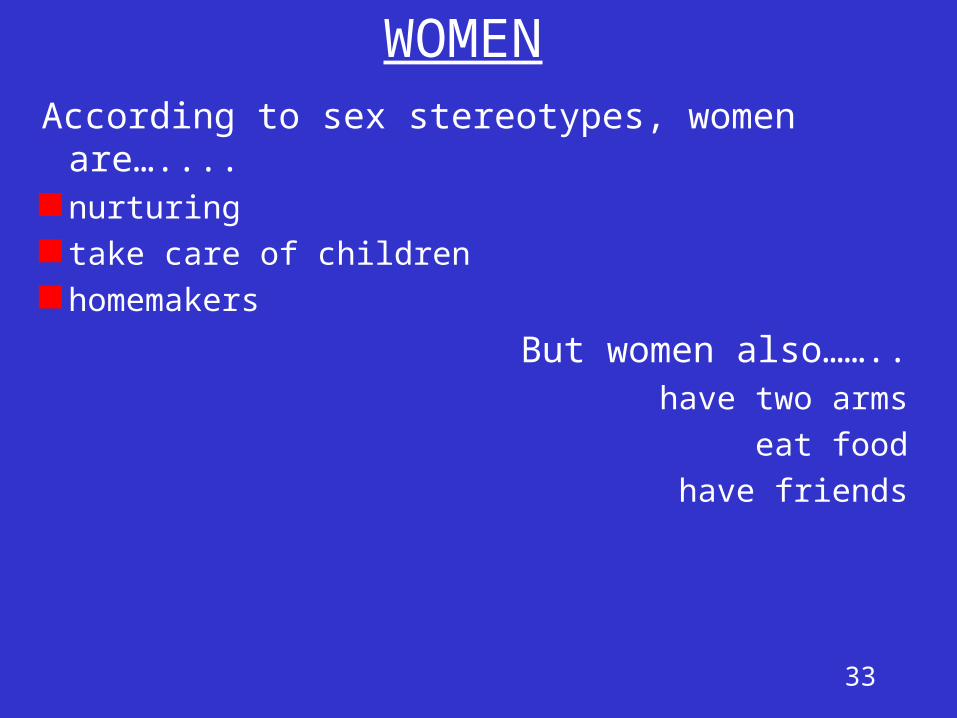
WOMEN
According to sex stereotypes, women are….... nurturing take care of children homemakers
But women also……..have two arms
eat food
have friends
34
Question: Why aren’t those attributes in the stereotype of women?
35
Answer: Because they don’t distinguish women from other groups.
We will return to this point, but most researchers use Ashmore & Del Boca’s definition.
36
Measurement of Stereotypes
Three common procedures:
1. Adjective checklist
2. Rating scale
3. Free responses
37
Adjective Checklists
Participants are given list of predetermined attributes and select those that are most typical of group
38
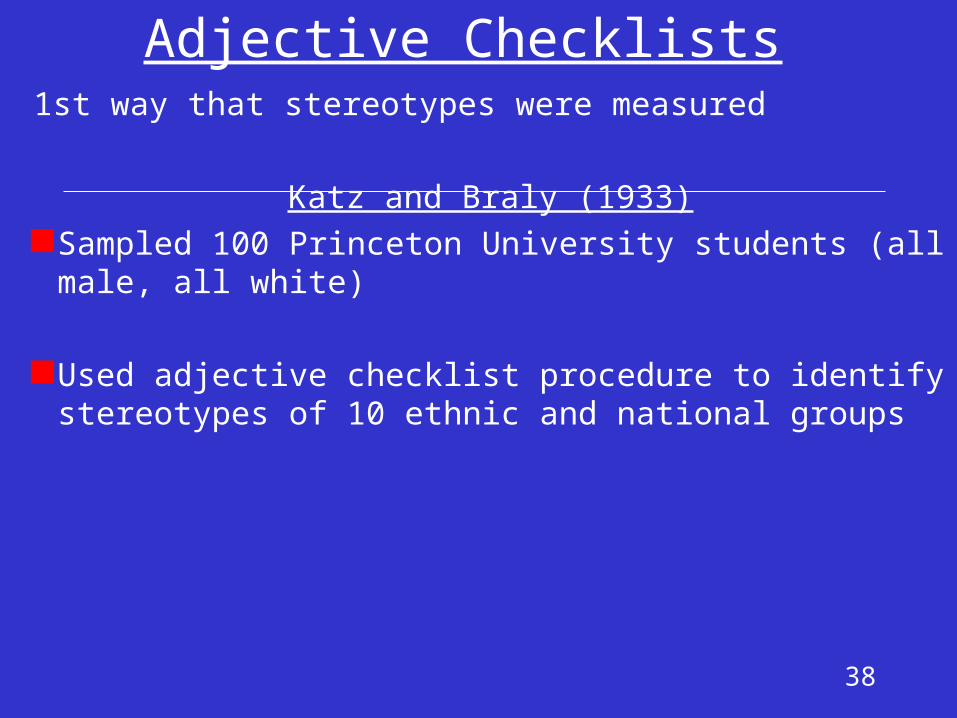
1st way that stereotypes were measured
Katz and Braly (1933)Sampled 100 Princeton University students (all male, all
white)
Used adjective checklist procedure to identify stereotypes of 10 ethnic and national groups
Adjective Checklists
39
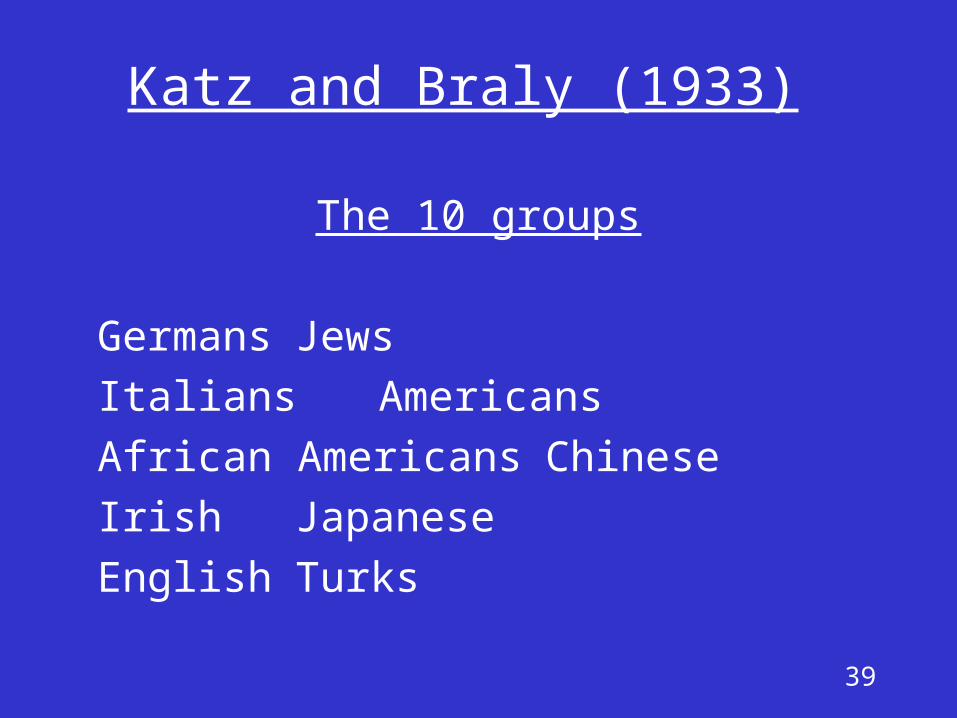
Katz and Braly (1933)
The 10 groups
Germans Jews
Italians Americans
African Americans Chinese
Irish Japanese
English Turks
40
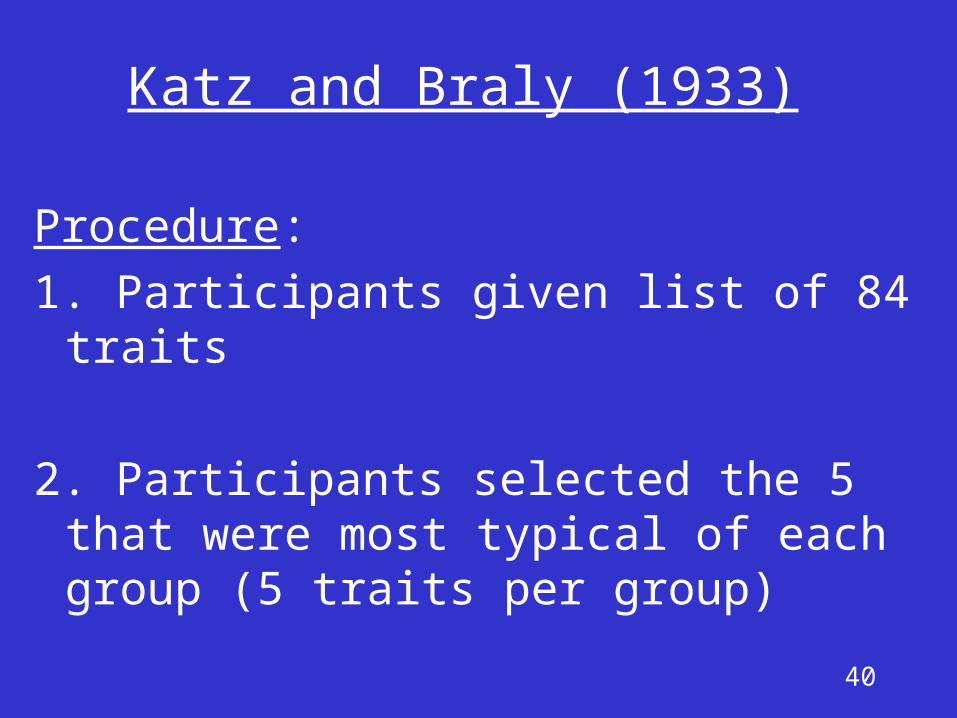
Katz and Braly (1933)
Procedure:
1. Participants given list of 84 traits
2. Participants selected the 5 that were most typical of each group (5 traits per group)
41
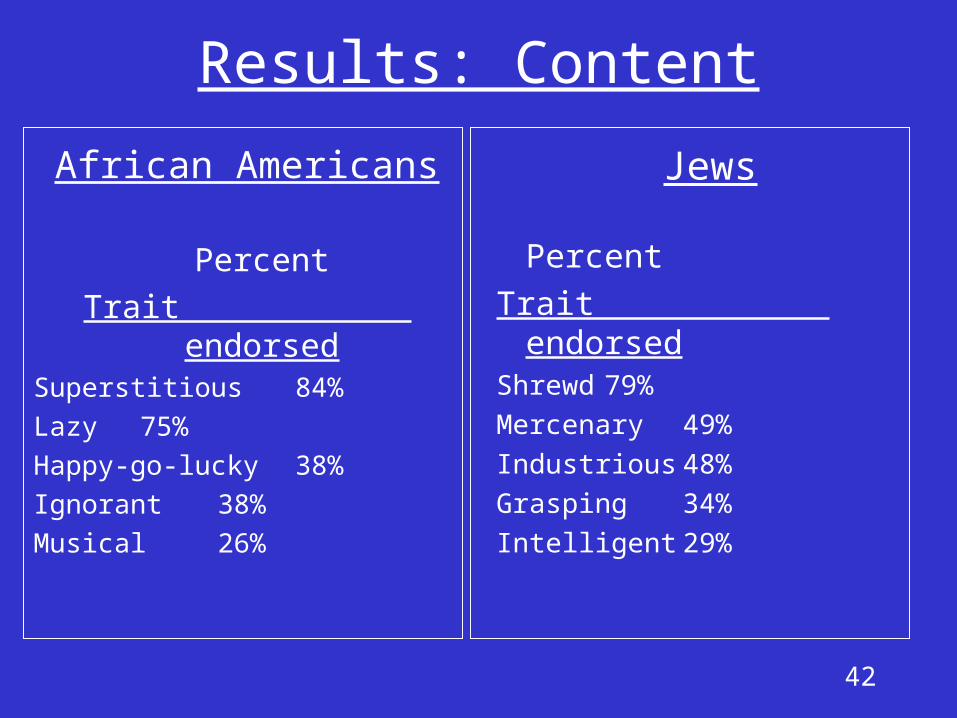
Katz and Braly (1933)
How content was assessed:
The 10 traits that were selected most often
42
Results: Content
African Americans
Percent
Trait endorsedSuperstitious 84%
Lazy 75%
Happy-go-lucky 38%
Ignorant 38%
Musical 26%
Jews Percent
Trait endorsedShrewd 79%
Mercenary 49%
Industrious 48%
Grasping 34%
Intelligent 29%
43
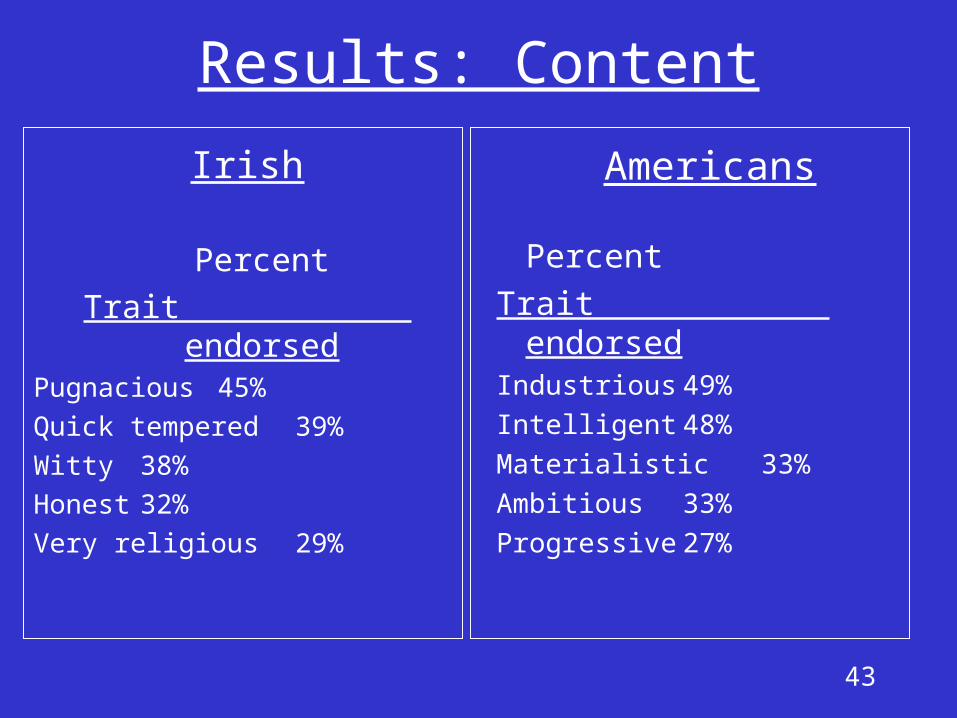
Results: Content
Irish
Percent
Trait endorsedPugnacious 45%
Quick tempered 39%
Witty 38%
Honest 32%
Very religious 29%
Americans Percent
Trait endorsedIndustrious 49%
Intelligent 48%
Materialistic 33%
Ambitious 33%
Progressive 27%
44
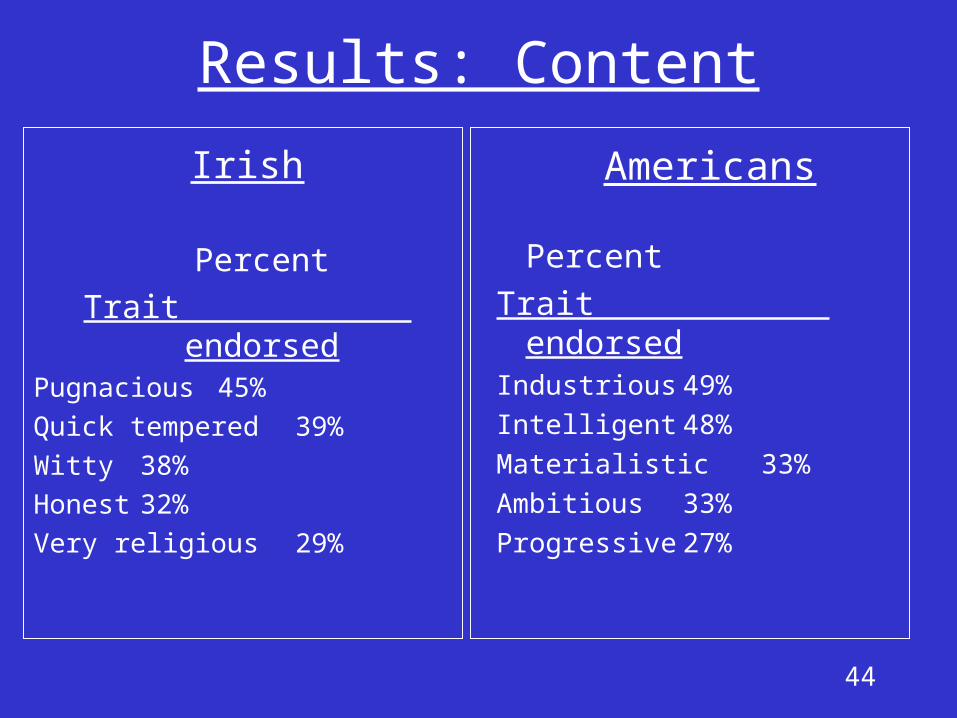
Results: Content
Irish
Percent
Trait endorsedPugnacious 45%
Quick tempered 39%
Witty 38%
Honest 32%
Very religious 29%
Americans Percent
Trait endorsedIndustrious 49%
Intelligent 48%
Materialistic 33%
Ambitious 33%
Progressive 27%
45
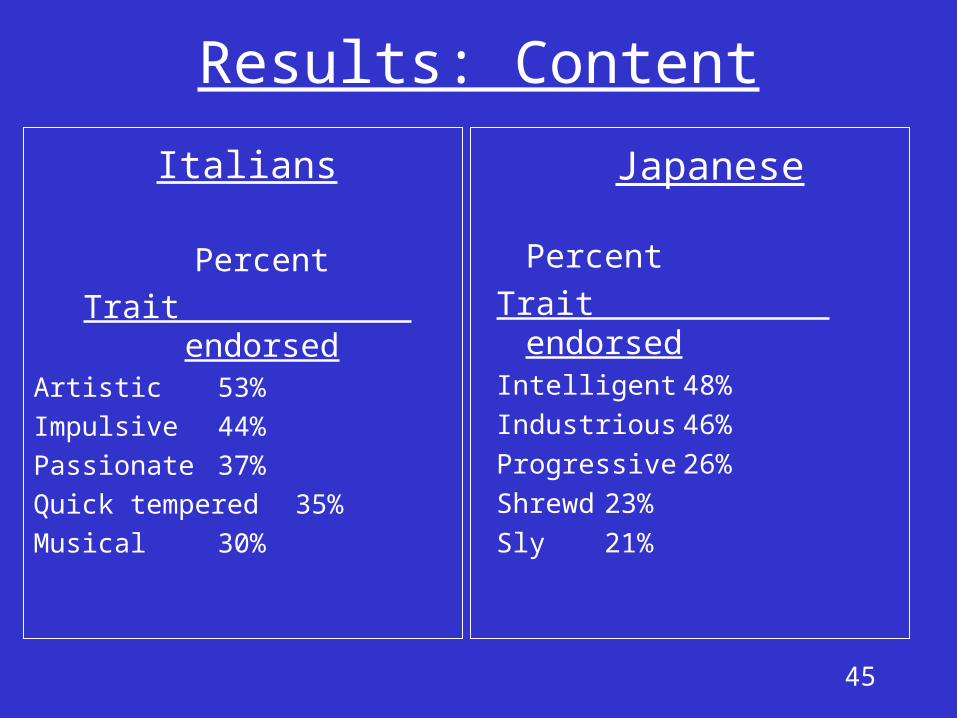
Results: Content
Italians
Percent
Trait endorsedArtistic 53%
Impulsive 44%
Passionate 37%
Quick tempered 35%
Musical 30%
Japanese Percent
Trait endorsedIntelligent 48%
Industrious 46%
Progressive 26%
Shrewd 23%
Sly 21%
46
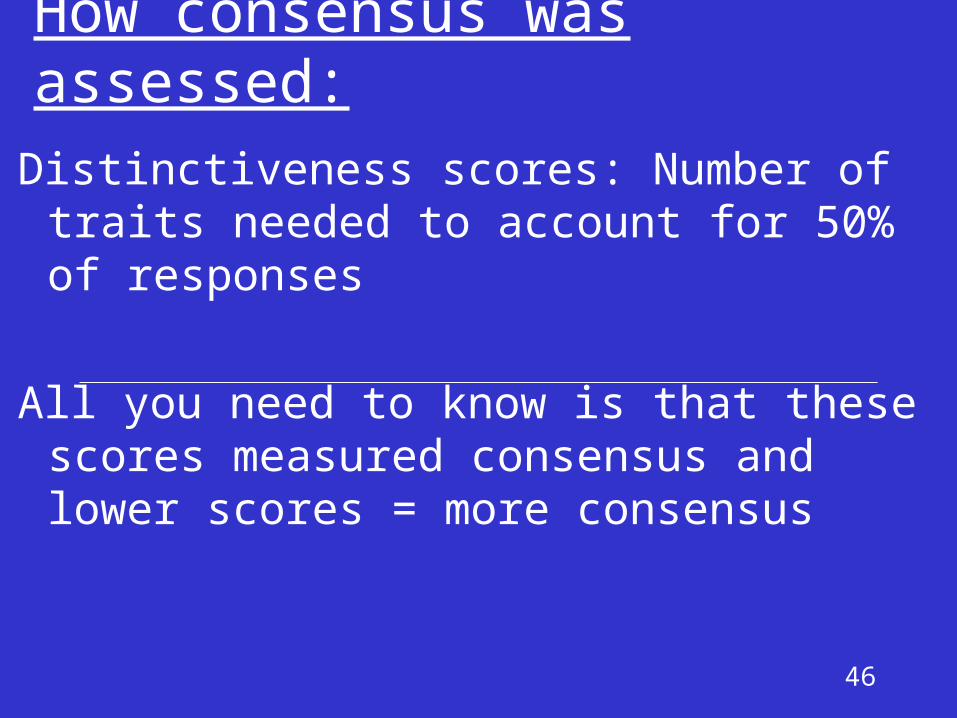
How consensus was assessed:
Distinctiveness scores: Number of traits needed to account for 50% of responses
All you need to know is that these scores measured consensus and lower scores = more consensus
47
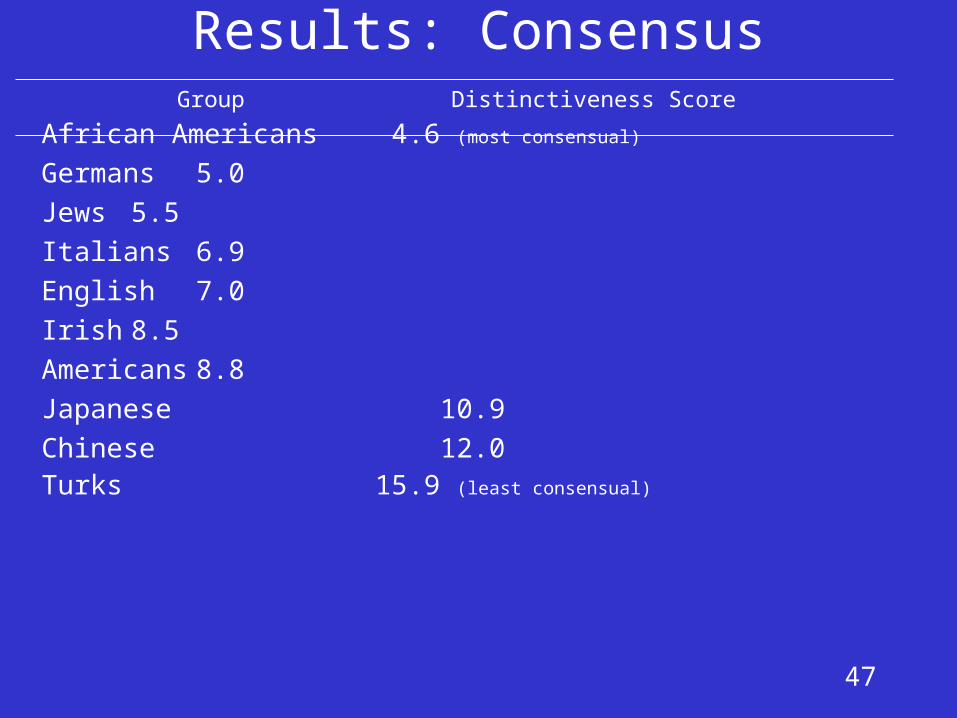
Results: Consensus Group Distinctiveness Score
African Americans 4.6 (most consensual)
Germans 5.0
Jews 5.5
Italians 6.9
English 7.0
Irish 8.5
Americans 8.8
Japanese 10.9
Chinese 12.0Turks 15.9 (least consensual)
48
Adjective Checklists
Benefits:Can include a lot of attributesEasy to complete
Drawback:May omit central traits from listList may become outdated
49
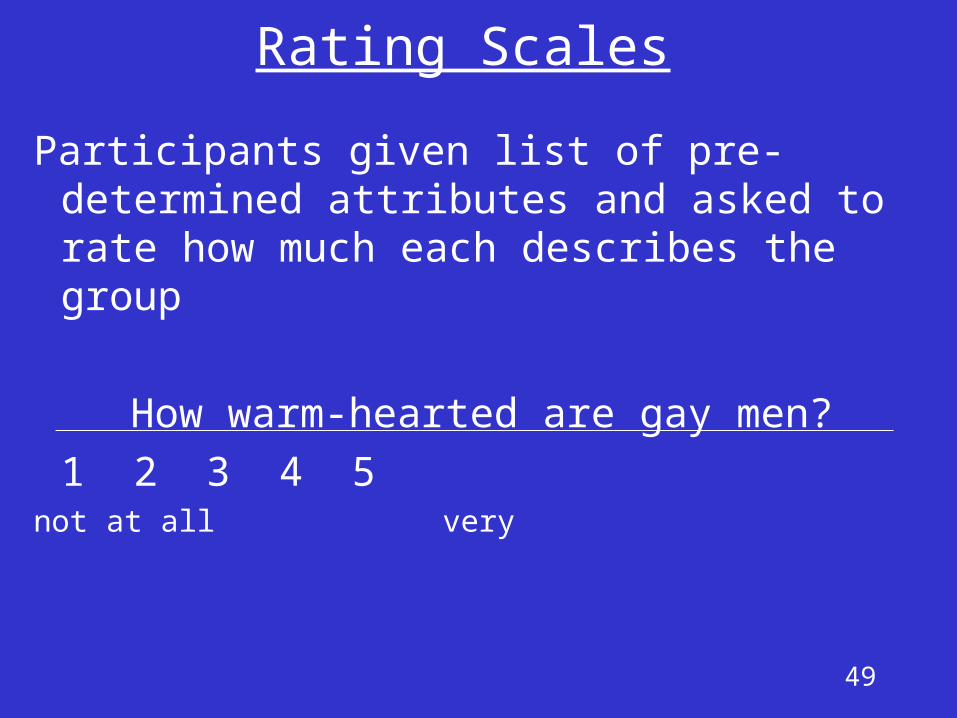
Rating Scales
Participants given list of pre-determined attributes and asked to rate how much each describes the group
How warm-hearted are gay men?
1 2 3 4 5not at all very
50
Rating ScalesBenefits:
Can include a lot of attributesEasy to complete
Drawback:May omit central traits from listList may become outdated
51
Rating Scales
One distinct advantage over Adjective Checklists:
More specific measurement of the stereotype --
Responses are not “all or none”
52
Rating Scales
Measurement specificity important because…….
Researchers can assess “stereotype strength”
53
Rating Scales
Definition: Stereotype Strength
Extent to which the attributes in a stereotype are thought
to characterize the group
Example……...
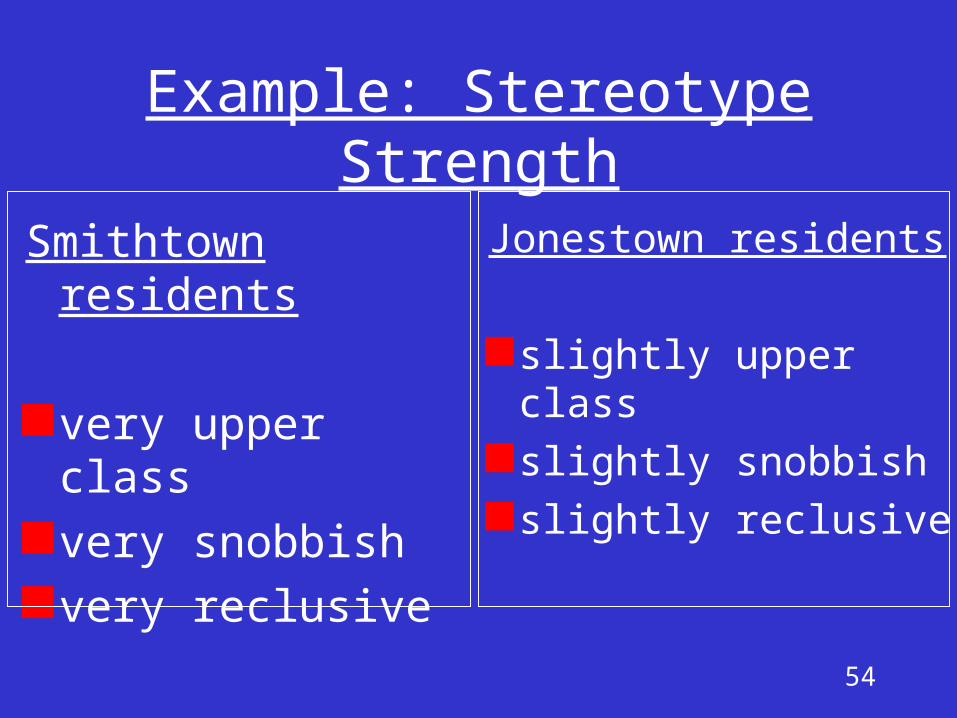
54
Example: Stereotype Strength
Smithtown residents
very upper classvery snobbishvery reclusive
Jonestown residents
slightly upper classslightly snobbishslightly reclusive
55
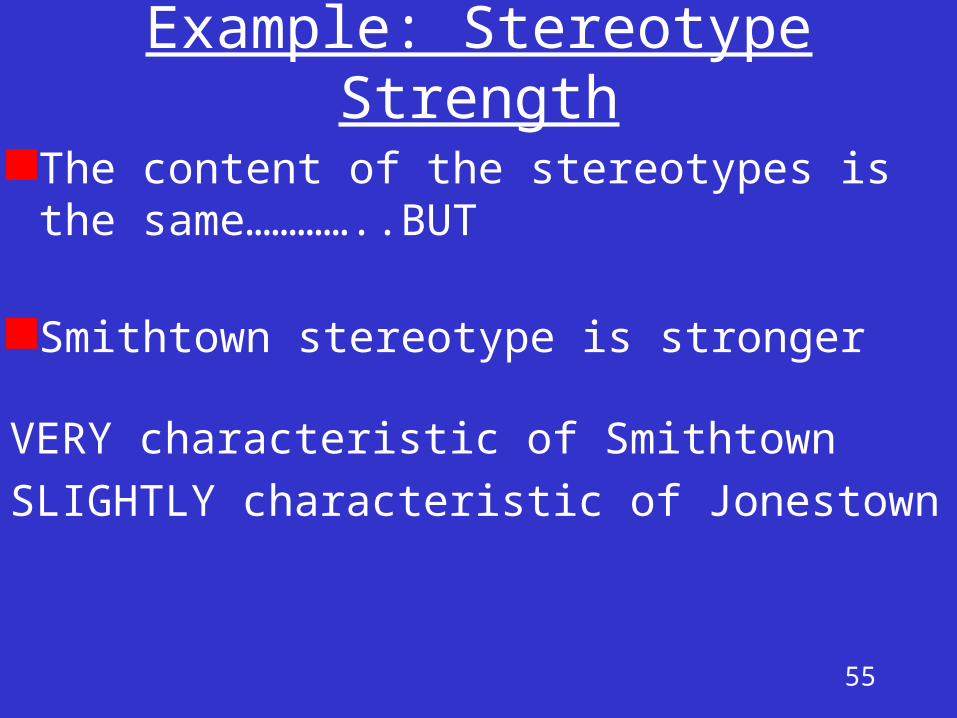
Example: Stereotype Strength
The content of the stereotypes is the same…………..BUT
Smithtown stereotype is stronger
VERY characteristic of Smithtown
SLIGHTLY characteristic of Jonestown
56
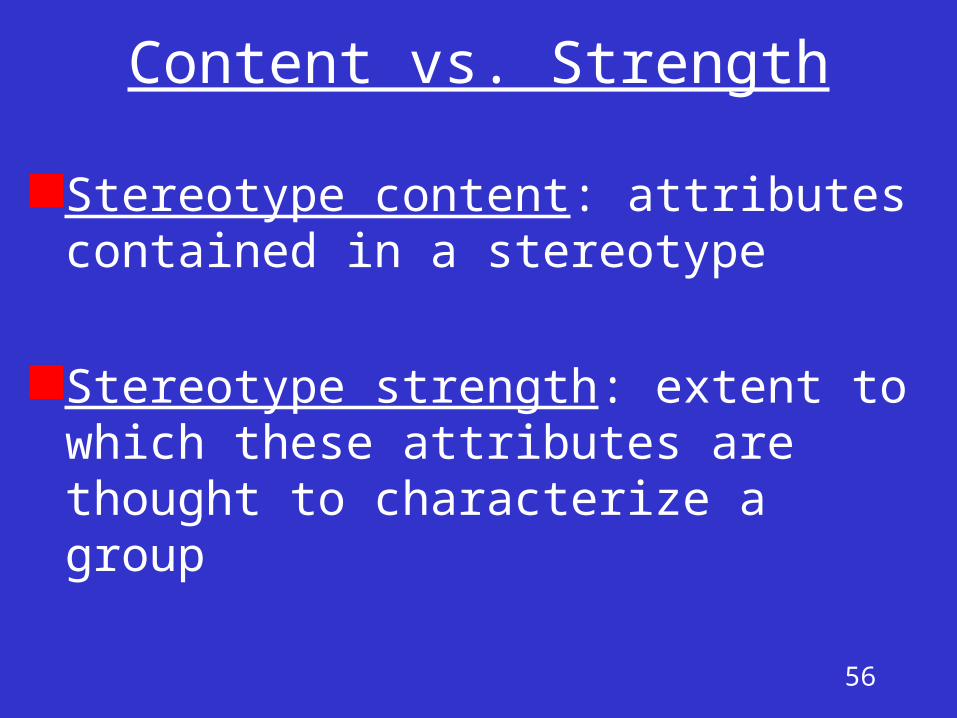
Content vs. Strength
Stereotype content: attributes contained in a stereotype
Stereotype strength: extent to which these attributes are thought to characterize a group

57
Stereotype Strength
Adjective Checklists cannot measure a stereotype’s strength
Rating scales can measure a stereotype’s strength
58
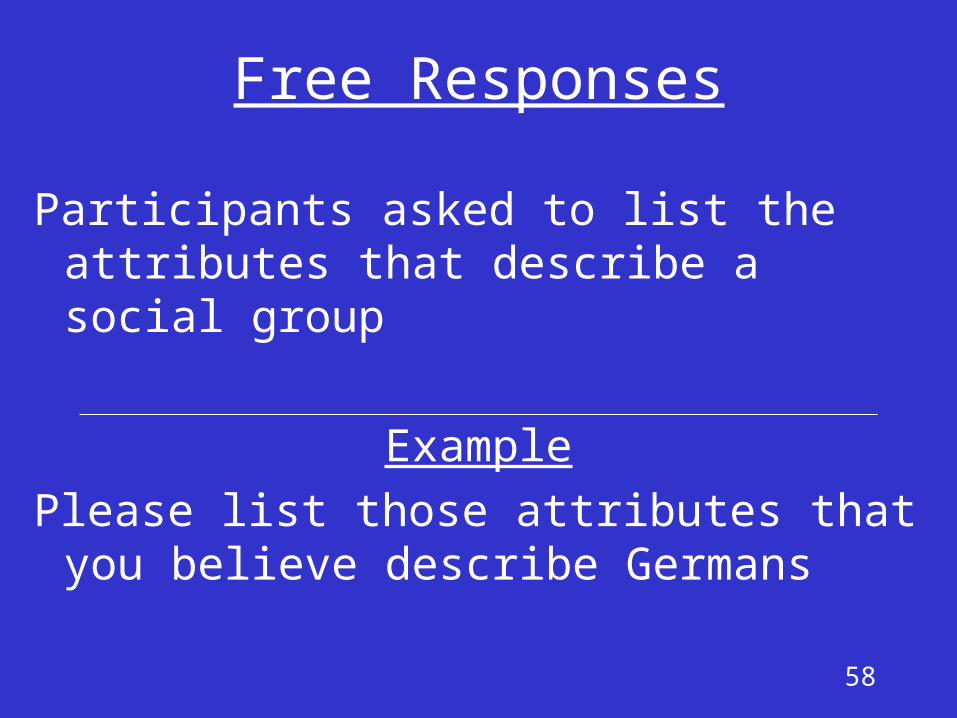
Free Responses
Participants asked to list the attributes that describe a social group
Example
Please list those attributes that you believe describe Germans
59
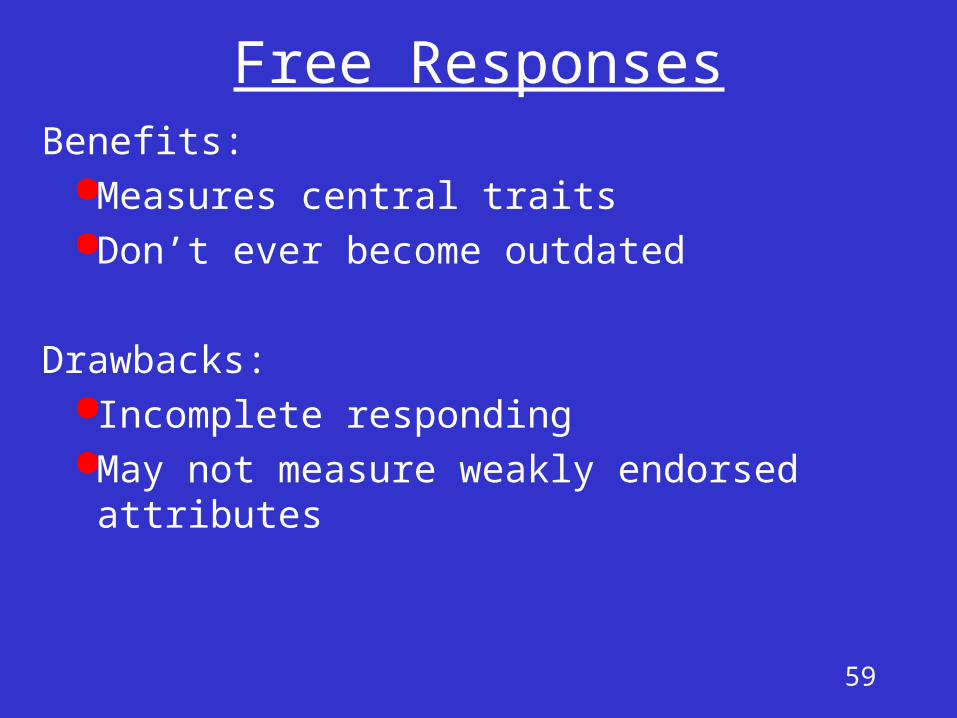
Free ResponsesBenefits:
Measures central traitsDon’t ever become outdated
Drawbacks:Incomplete respondingMay not measure weakly endorsed attributes
60
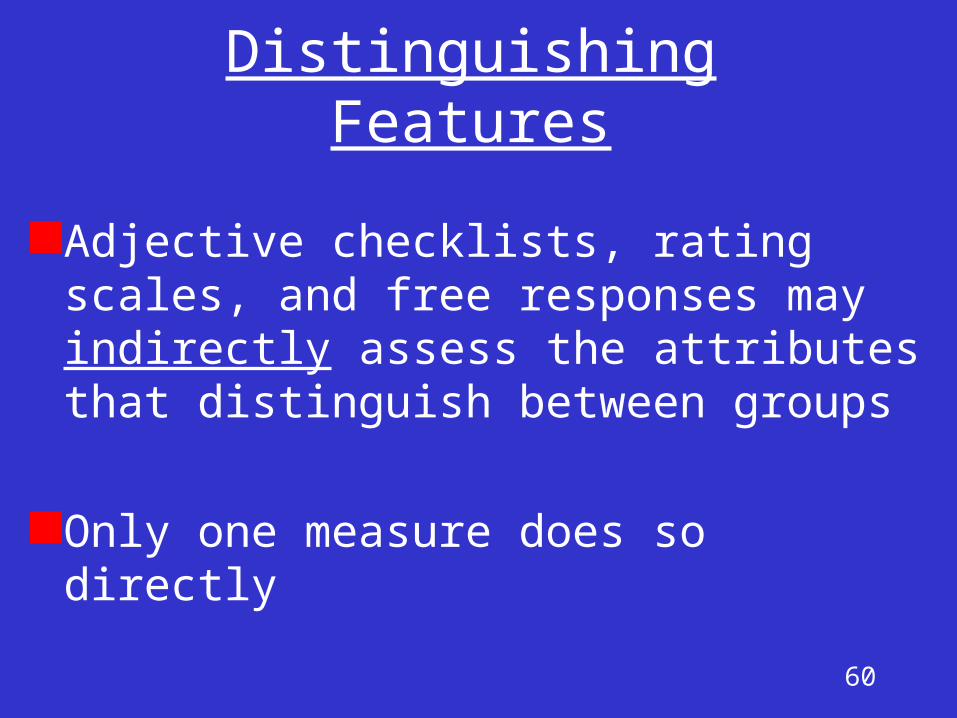
Distinguishing Features
Adjective checklists, rating scales, and free responses may indirectly assess the attributes that distinguish between groups
Only one measure does so directly
61
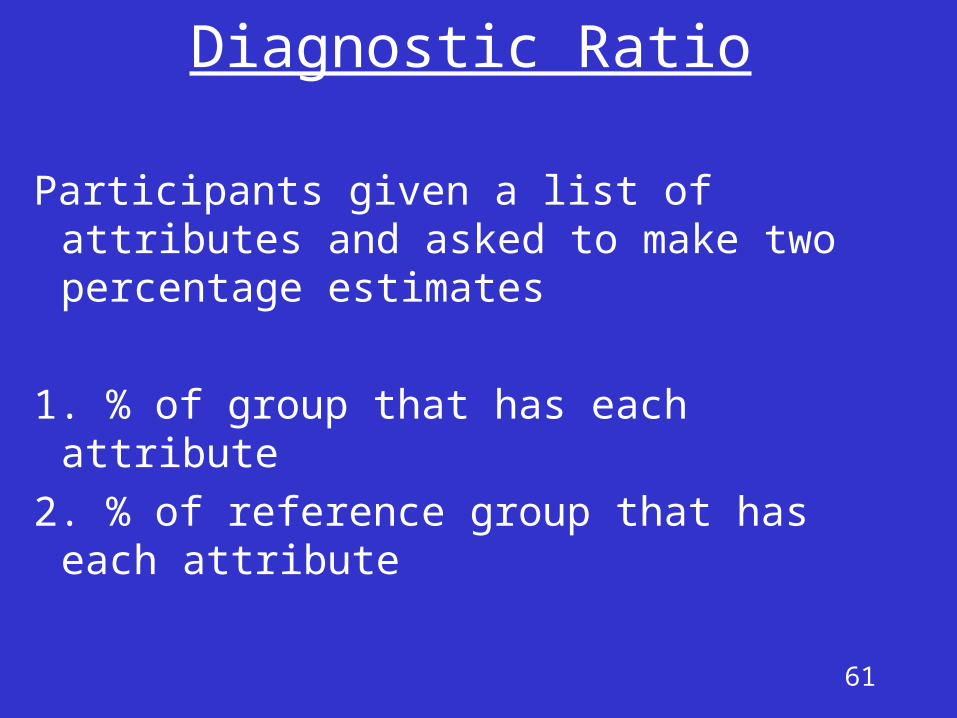
Diagnostic Ratio
Participants given a list of attributes and asked to make two percentage estimates
1. % of group that has each attribute
2. % of reference group that has each attribute
62
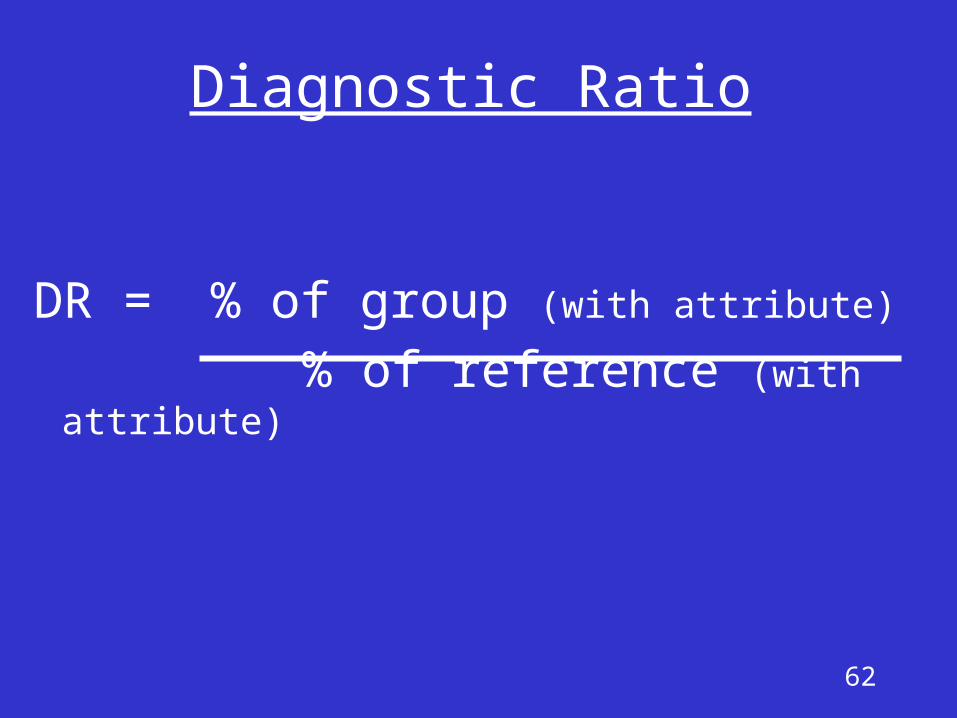
Diagnostic Ratio
DR = % of group (with attribute)
% of reference (with attribute)
63
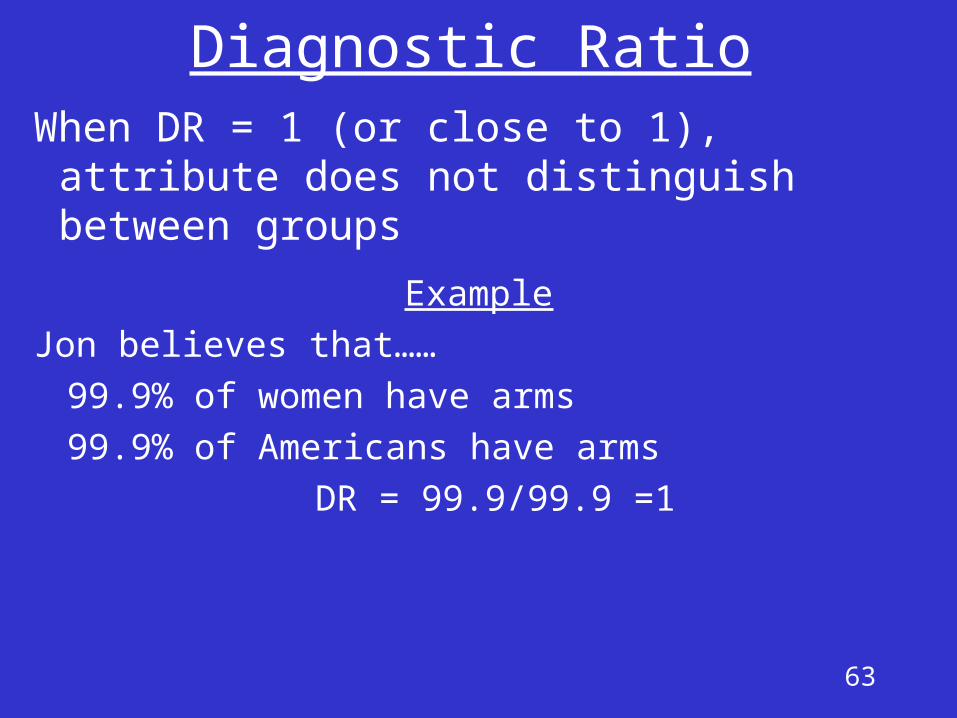
Diagnostic RatioWhen DR = 1 (or close to 1), attribute
does not distinguish between groups
Example
Jon believes that……
99.9% of women have arms
99.9% of Americans have arms
DR = 99.9/99.9 =1
64
Diagnostic Ratio
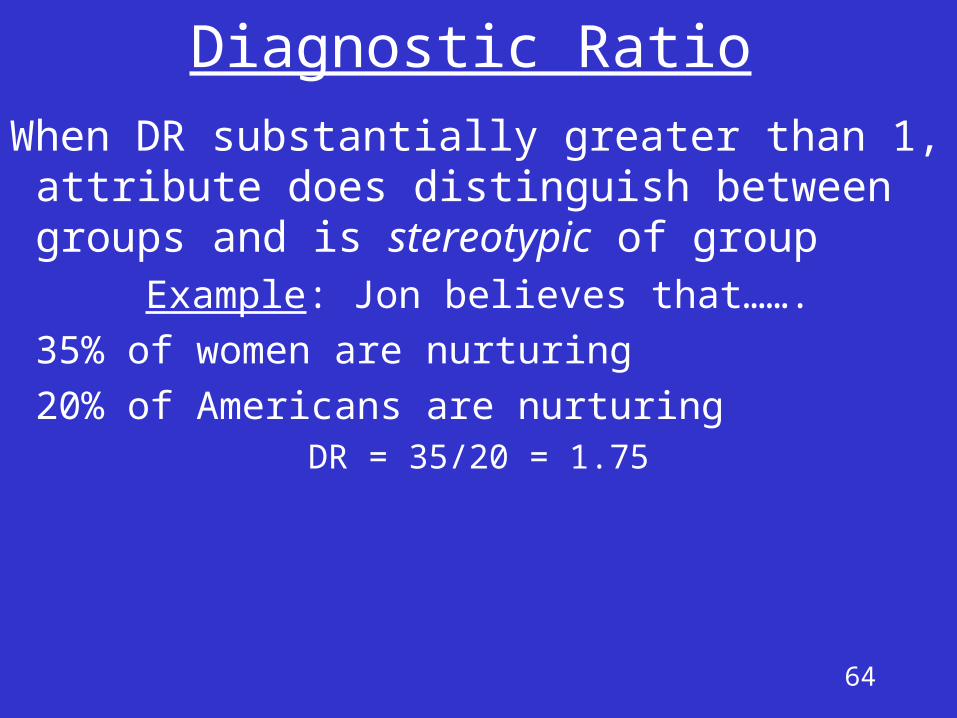
When DR substantially greater than 1, attribute does distinguish between groups and is stereotypic of group
Example: Jon believes that…….
35% of women are nurturing
20% of Americans are nurturingDR = 35/20 = 1.75
65
Diagnostic Ratio
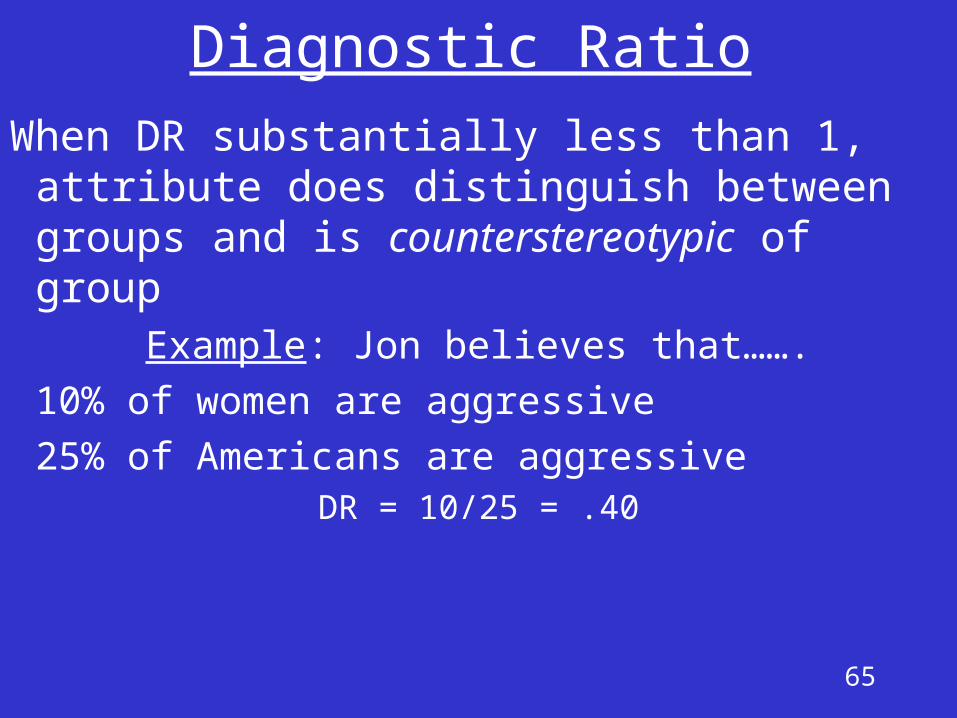
When DR substantially less than 1, attribute does distinguish between groups and is counterstereotypic of group
Example: Jon believes that…….
10% of women are aggressive
25% of Americans are aggressiveDR = 10/25 = .40
66
Diagnostic Ratio
So, according to the DR measure, a stereotype is defined….
As set of beliefs about a group that distinguish that group from other groups in either a stereotypic way (DR > 1) or a counterstereotypic way (DR < 1).
67
McCauley & Stitt (1978)
Purpose:
1. Show utility of DR
2. Measure (in)accuracy of stereotype about African Americans
68
McCauley & Stitt (1978)
Participants:
Sampled five groupsHigh school studentsCollege studentsUnion membersChurch ChoirSocial work students
69
McCauley & Stitt (1978)
Procedure:
Step 1: Participants estimated % of African Americans and % of Americans that had 7 characteristics……..

70
7 Characteristics
% completed HS
% that are illegitimate
% that were unemployed last month
% who have been victims of crimes
% on welfare
% w/4 or more children
% w/female heads of households
71
McCauley & Stitt (1978)
Procedure (continued):
Step 2: Obtained census information to serve as criteria for accuracy
Step 3: Transformed census information into DR scores
72
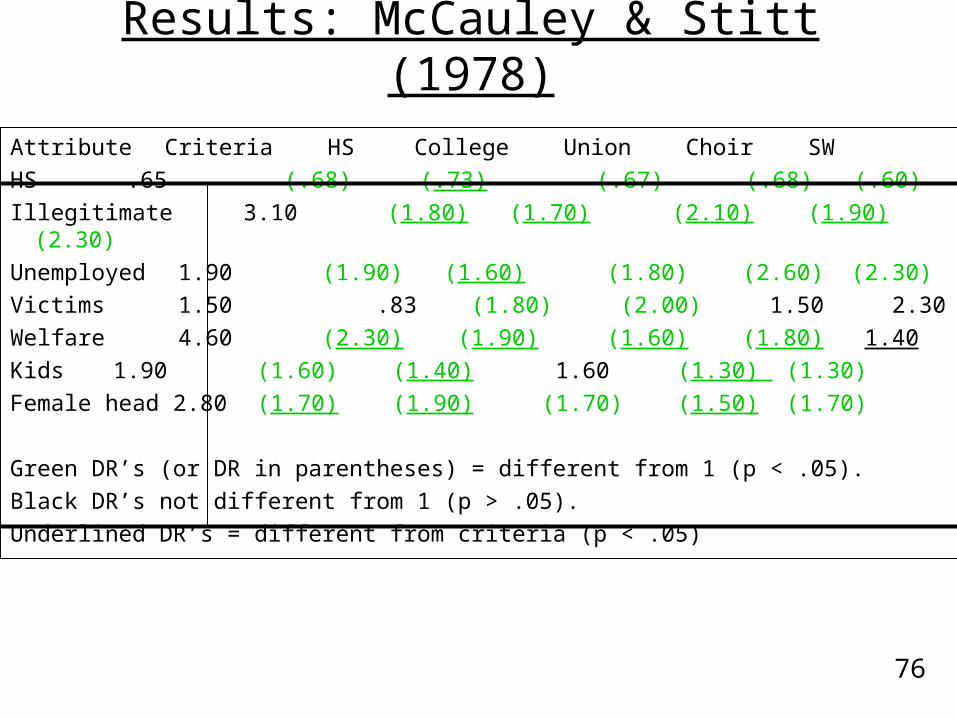
Results: McCauley & Stitt (1978)
76
Attribute Criteria HS College Union Choir SW
HS .65 (.68) (.73) (.67) (.68) (.60)
Illegitimate 3.10 (1.80) (1.70) (2.10) (1.90) (2.30)
Unemployed 1.90 (1.90) (1.60) (1.80) (2.60) (2.30)
Victims 1.50 .83 (1.80) (2.00) 1.50 2.30
Welfare 4.60 (2.30) (1.90) (1.60) (1.80) 1.40
Kids 1.90 (1.60) (1.40) 1.60 (1.30) (1.30)
Female head 2.80 (1.70) (1.90) (1.70) (1.50) (1.70)
Green DR’s (or DR in parentheses) = different from 1 (p < .05).
Black DR’s not different from 1 (p > .05).
Underlined DR’s = different from criteria (p < .05)
73
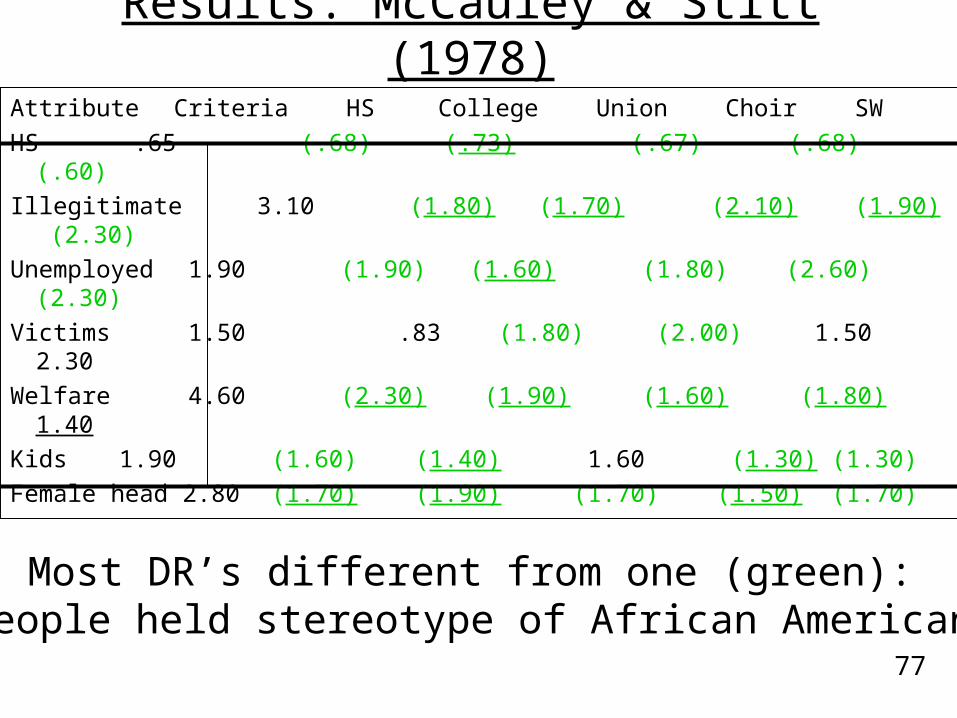
Results: McCauley & Stitt (1978)
77
Attribute Criteria HS College Union Choir SW
HS .65 (.68) (.73) (.67) (.68) (.60)
Illegitimate 3.10 (1.80) (1.70) (2.10) (1.90) (2.30)
Unemployed 1.90 (1.90) (1.60) (1.80) (2.60) (2.30)
Victims 1.50 .83 (1.80) (2.00) 1.50 2.30
Welfare 4.60 (2.30) (1.90) (1.60) (1.80) 1.40
Kids 1.90 (1.60) (1.40) 1.60 (1.30) (1.30)
Female head 2.80 (1.70) (1.90) (1.70) (1.50) (1.70)
Most DR’s different from one (green): People held stereotype of African Americans
74
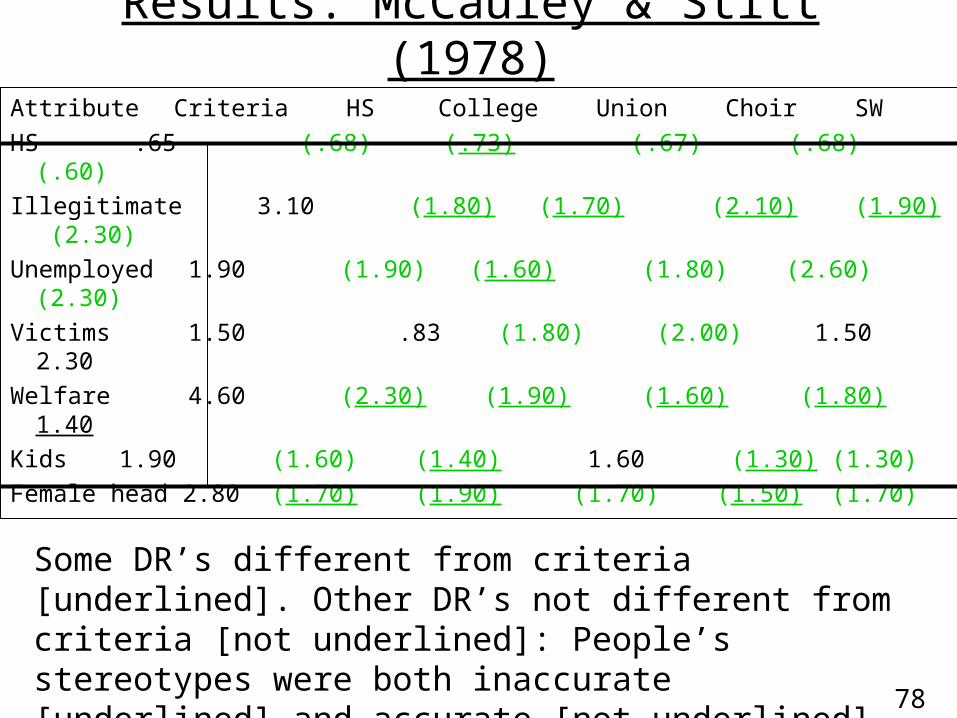
Results: McCauley & Stitt (1978)
78
Attribute Criteria HS College Union Choir SW
HS .65 (.68) (.73) (.67) (.68) (.60)
Illegitimate 3.10 (1.80) (1.70) (2.10) (1.90) (2.30)
Unemployed 1.90 (1.90) (1.60) (1.80) (2.60) (2.30)
Victims 1.50 .83 (1.80) (2.00) 1.50 2.30
Welfare 4.60 (2.30) (1.90) (1.60) (1.80) 1.40
Kids 1.90 (1.60) (1.40) 1.60 (1.30) (1.30)
Female head 2.80 (1.70) (1.90) (1.70) (1.50) (1.70)
Some DR’s different from criteria [underlined]. Other DR’s not different from criteria [not underlined]: People’s stereotypes were both inaccurate [underlined] and accurate [not underlined]
75
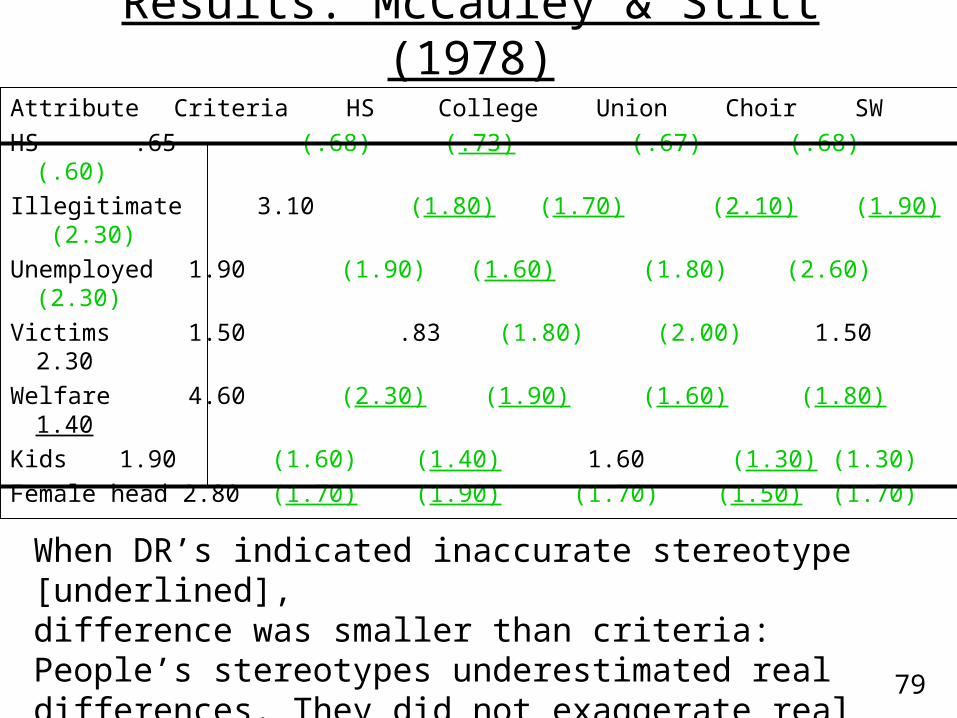
Results: McCauley & Stitt (1978)
79
Attribute Criteria HS College Union Choir SW
HS .65 (.68) (.73) (.67) (.68) (.60)
Illegitimate 3.10 (1.80) (1.70) (2.10) (1.90) (2.30)
Unemployed 1.90 (1.90) (1.60) (1.80) (2.60) (2.30)
Victims 1.50 .83 (1.80) (2.00) 1.50 2.30
Welfare 4.60 (2.30) (1.90) (1.60) (1.80) 1.40
Kids 1.90 (1.60) (1.40) 1.60 (1.30) (1.30)
Female head 2.80 (1.70) (1.90) (1.70) (1.50) (1.70)
When DR’s indicated inaccurate stereotype [underlined], difference was smaller than criteria: People’s stereotypes underestimated real differences. They did not exaggerate real differences
76
McCauley & Stitt (1978)
Summary of Findings
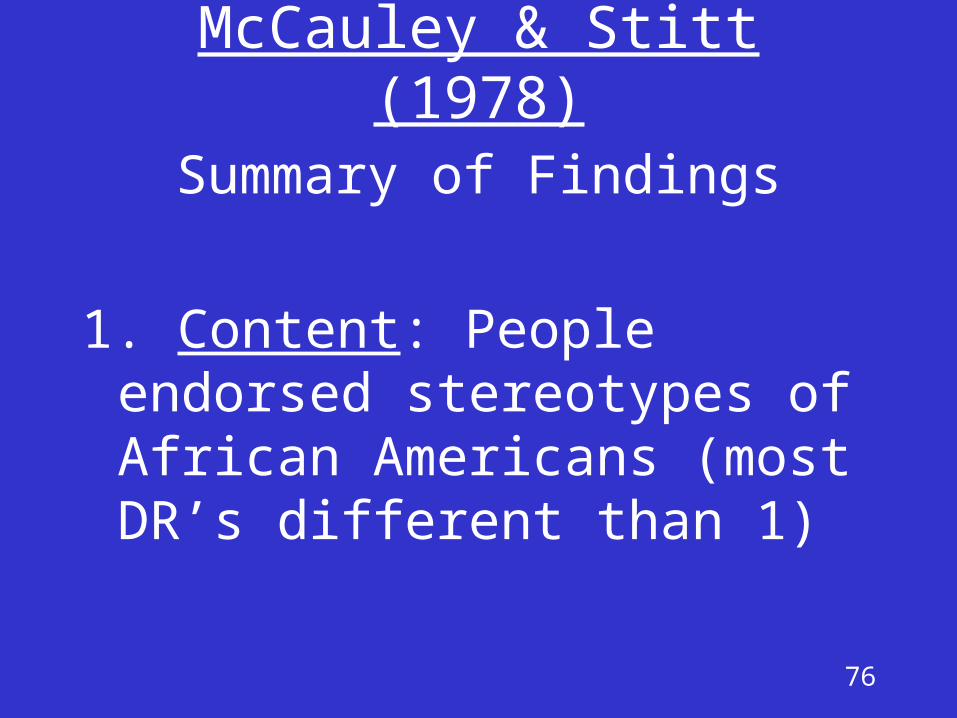
1. Content: People endorsed stereotypes of African Americans (most DR’s different than 1)
77
McCauley & Stitt (1978)
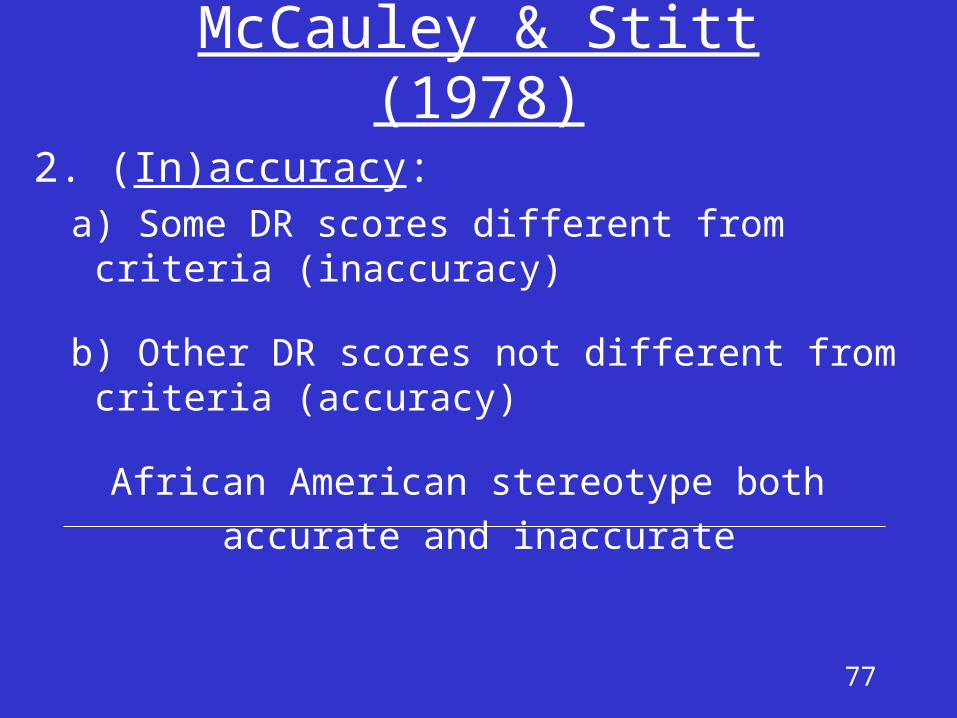
2. (In)accuracy: a) Some DR scores different from criteria
(inaccuracy)
b) Other DR scores not different from criteria (accuracy)
African American stereotype both
accurate and inaccurate
78
McCauley & Stitt (1978)
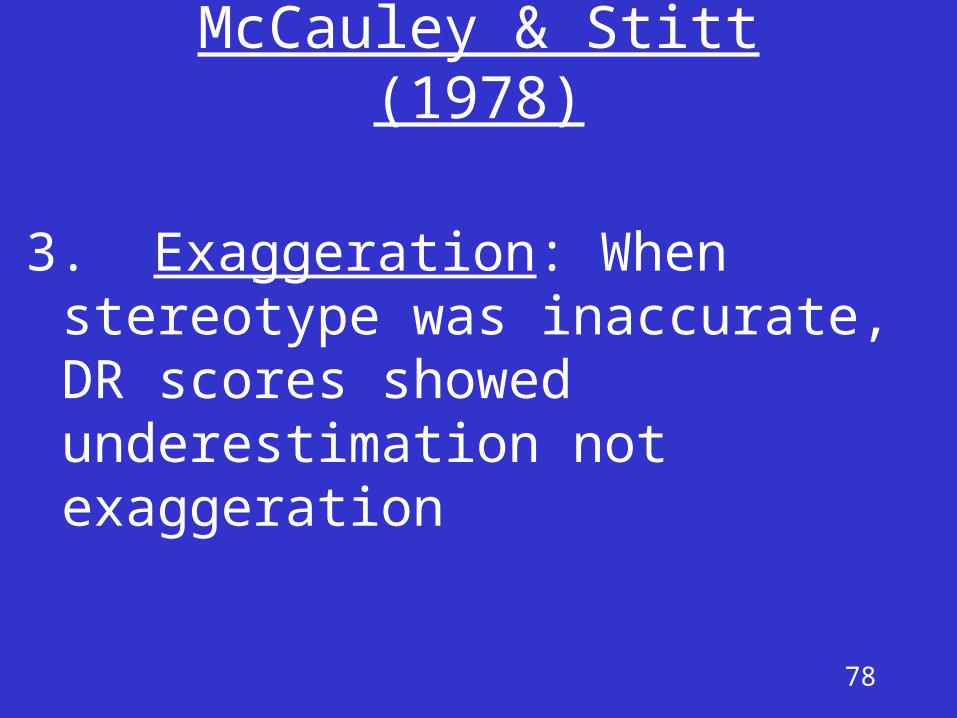
3. Exaggeration: When stereotype was inaccurate, DR scores showed underestimation not exaggeration
79
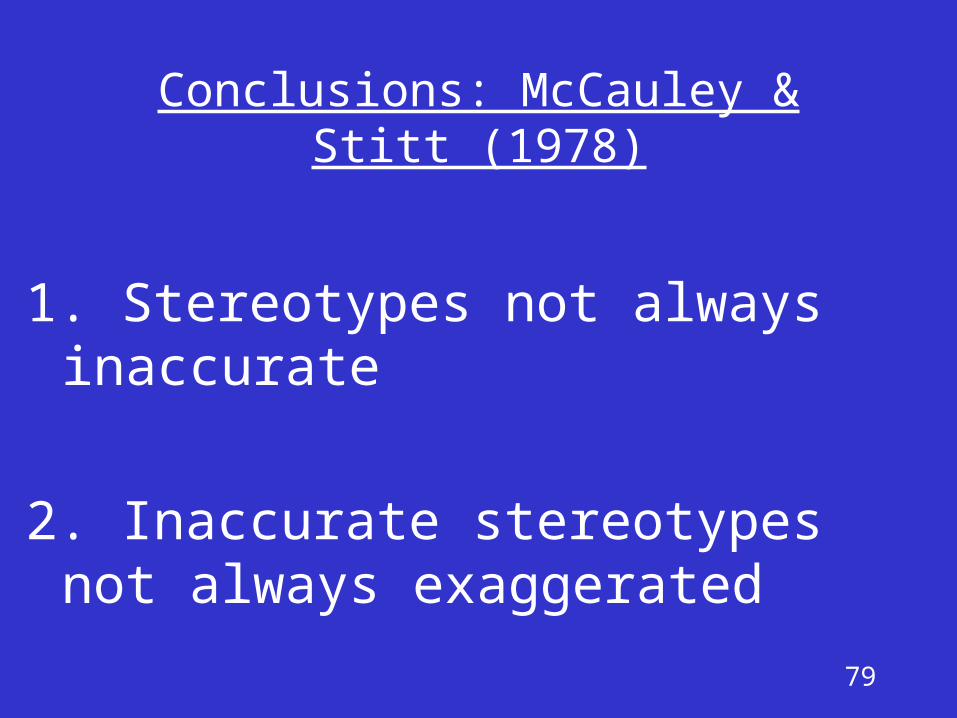
Conclusions: McCauley & Stitt (1978)
1. Stereotypes not always inaccurate
2. Inaccurate stereotypes not always exaggerated
80
Stereotypes Have Been Stereotyped
So, although people do hold stereotypes, those stereotypes are not necessarily inaccurate nor are they always exaggeration.
But what about resistance to change?
81
Princeton Trilogy
Katz & Braly (1933)Gilbert (1951)Karlins, Coffman, & Walters (1969)
Recent Replication/Extension
Madon et al. (2001)
82
Princeton Trilogy Limitation of the Princeton trilogy:
Never updated the attribute list
Problem because……
Outdated attribute list may omit current beliefs and underestimate change by leading people to endorse old, and therefore, similar stereotypes
83
Madon et al. (2001)
Three studies:
Study 1: replicated Princeton trilogy
Study 2: updated the attribute list
Study 3: assessed changes in favorableness
84
Madon et al. (2001) Study 1
Procedure:
1. Given original attribute list
2. For each group, selected the five most typical
85
Madon et al. (2001): Study 1
Results:
Content: Only 1 (African American) of the 10 stereotypes changed significantly
This is consistent with idea that stereotypes are resistant to change
86
Madon et al. (2001): Study 1
Results:
Consensus: Only 1 (African American) of the 10 stereotypes changed significantly
This too is consistent with idea that stereotypes are resistant to change

87
Outdated Attribute List
Study 1 showed little change
Could this be due to an
outdated attribute list?
Study 2 tested this by
updating the attribute list
88
Madon et al. (2001) Study 2
Procedure:
1. Updated original attribute list w/322
new attributes (total = 406)
2. Rated extent to which each attribute described the groups
89
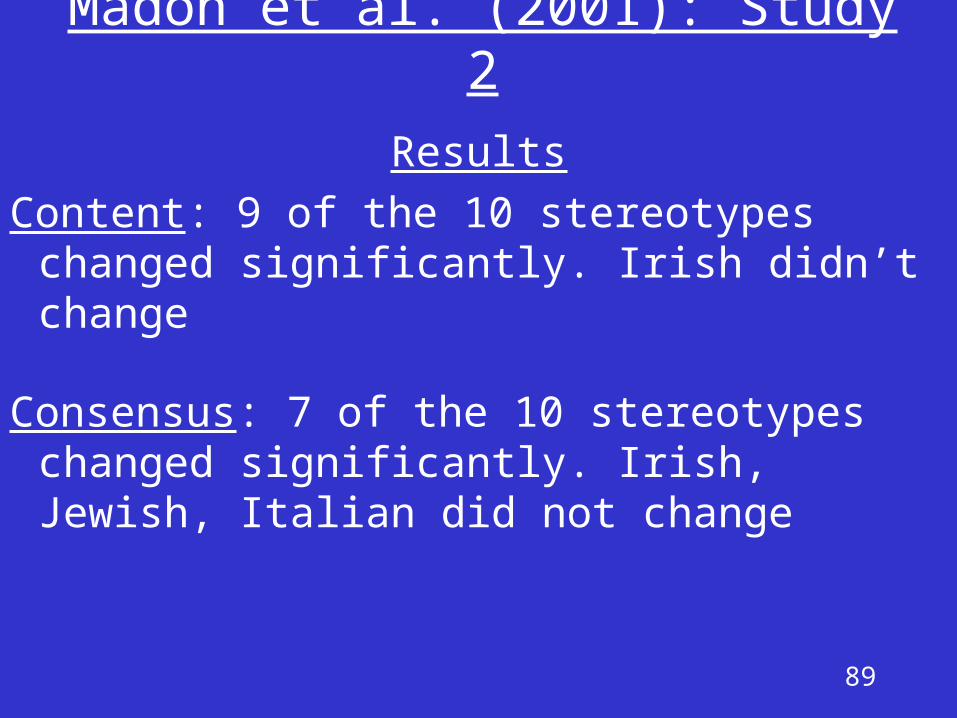
Madon et al. (2001): Study 2
Results
Content: 9 of the 10 stereotypes changed significantly. Irish didn’t change
Consensus: 7 of the 10 stereotypes changed significantly. Irish, Jewish, Italian did not change
90
Madon et al. (2001): Study 2
These results are NOT consistent with idea that stereotypes are resistant to change
91
Madon et al. (2001) Study 3
Purpose:
Examine whether the stereotypes have changed in favorableness
92
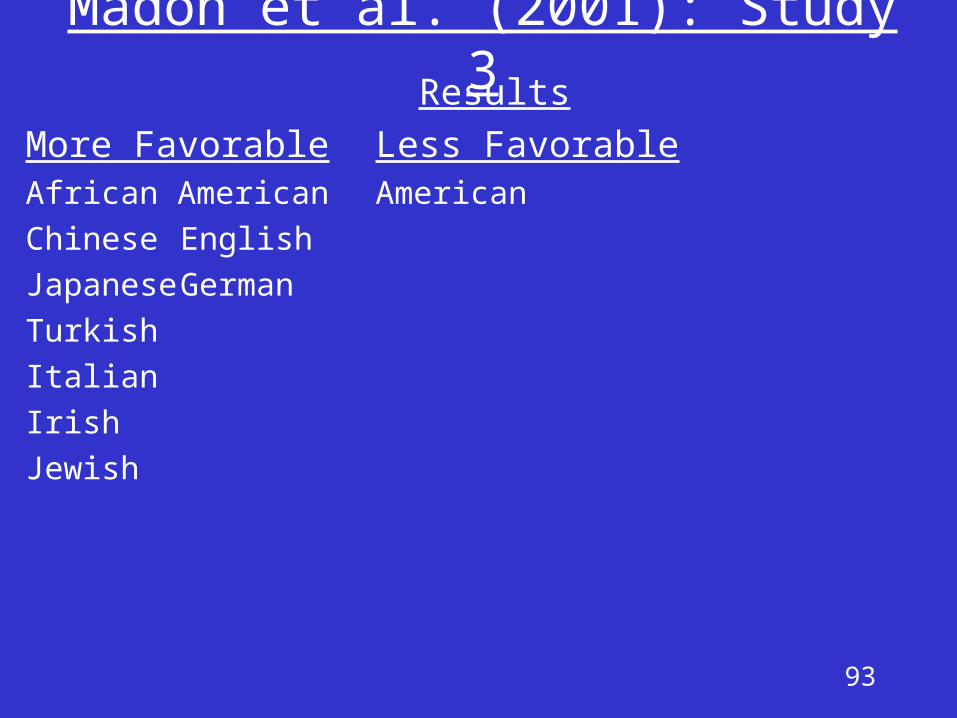
Madon et al. (2001): Study 3
Procedure:
Participants rated the favorableness of the 1933, 1951, 1969 and 1990s stereotypes
93
Madon et al. (2001): Study 3Results
More Favorable Less FavorableAfrican American American
Chinese English
Japanese German
Turkish
Italian
Irish
Jewish
94
Madon et al. (2001): Study 3
Changes in favorableness do NOT support idea that stereotypes are resistant to change
95
Stereotypes are not inherently inaccurate (McCauley & Stitt, 1978)
Stereotypes are not always exaggerated (McCauley & Stitt, 1978)
Stereotypes are not resistant to change (Madon et al., 2001)
96
Why Study Stereotypes?
Stereotypes may create social problems
One way they can do this is through self-fulfilling prophecies
97
Self-Fulfilling Prophecies
Definition:
Self-fulfilling prophecies are false beliefs that lead to their own fulfillment
98
Three steps to a SFP:
1. Perceiver holds false belief about target
2. Perceiver treats target in manner consistent with false belief
3. Target responds to this treatment in such a way as to confirm the originally false belief
99
Self-Fulfilling Prophecies are not Perceptual Biases
Perceptual biases:
When a perceiver believes that a false belief has come true, when in fact it has not
100
Self-Fulfilling Prophecies Do Not Reflect Predictive Accuracy
Predictive Accuracy:
When a perceiver correctly predicts a target’s future behavior, but did not cause that behavior to occur
(I predict Jazz will win, and they do)
101
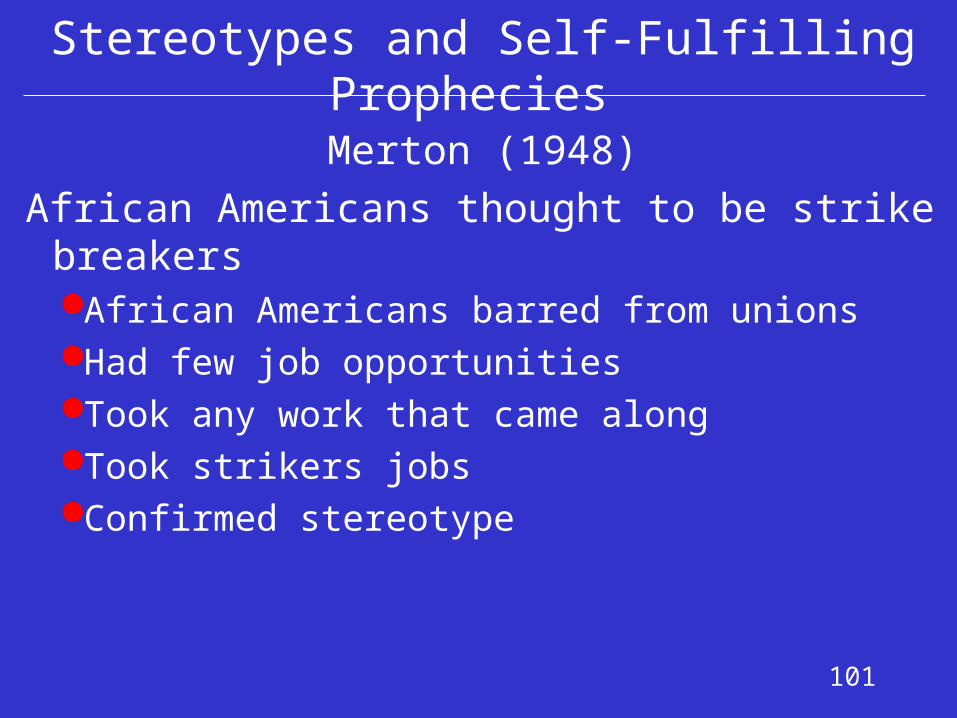
Stereotypes and Self-Fulfilling Prophecies
Merton (1948)
African Americans thought to be strike breakersAfrican Americans barred from unionsHad few job opportunitiesTook any work that came alongTook strikers jobsConfirmed stereotype

102
Research on Self-Fulfilling Prophecies
Studies fall into two broad categories
1. Naturalistic research:
Perceivers’ beliefs assessedInaccuracy of beliefs determinedTeachers and students
2. Experimental research:
False beliefs induced
103
Snyder, Tanke, & Bersheid (1978)
Purpose:
Examine whether the attractiveness stereotype is self-fulfilling
Stereotype is that attractive people have all sorts of good attributes (e.g., intelligent, friendly, sociable)
104
Snyder, Tanke, & Bersheid (1978)
Participants:51 men and 51 women men and women paired offnever saw one another
Men = perceivers
Women = targets
105
Snyder, Tanke, & Bersheid (1978)
Procedure:Interactions w/o nonverbal behaviorBiographical questionnaire for partnerPhoto of male Male got photo of his female partnerMale rated his partner on traitsConversed over telephone (tape made)Male rated his partner again
106
Snyder, Tanke, & Bersheid (1978)
Manipulation:
Attractive partner
Unattractive partner
107
Snyder, Tanke, & Bersheid (1978)
Judges listened to conversation
Judges rated male’s behavior
Judges rated female’s behavior
108
Snyder, Tanke, & Bersheid (1978)
Results:
Males judged warmer and nicer in attractive condition
Females judged warmer and friendlier in attractive condition
109
Snyder, Tanke, & Bersheid (1978)
Females did not differ across conditions
Thus, only possible cause of differences in behavior after conversation was due to the treatment they received…………...
110
Snyder, Tanke, & Bersheid (1978)
Specifically…….
The men were very warm and nice to the “beautiful” women
The “beautiful” women responded in kind.
111
Snyder, Tanke, & Bersheid (1978)
The men were not warm and not nice to the “ugly” women
The “ugly” women responded in kind.