Embed Size (px)
Citation preview

1
Knowing Your Customers Better Through Load Research
Presented By:
Lawrence M. Strawn
Senior Retail Pricing Coordinator
Orlando Utilities Commission
September 21, 2004

2
Agenda
• Background
• Define load research
• Getting started
• Meter sample selection
• Uses of data
3
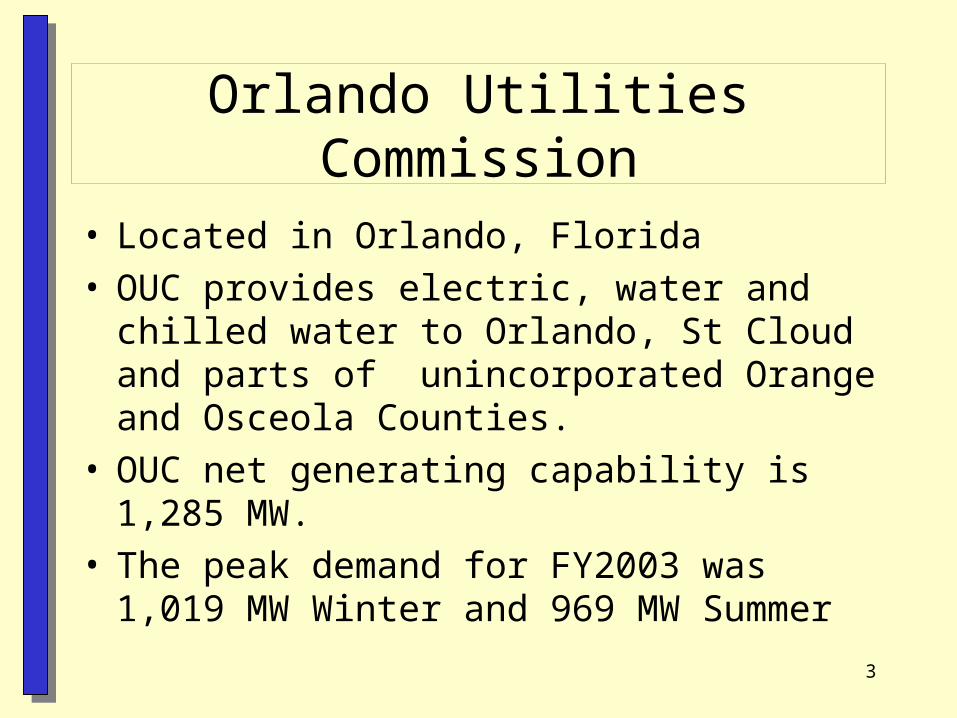
Orlando Utilities Commission
• Located in Orlando, Florida• OUC provides electric, water and chilled water to
Orlando, St Cloud and parts of unincorporated Orange and Osceola Counties.
• OUC net generating capability is 1,285 MW.• The peak demand for FY2003 was 1,019 MW
Winter and 969 MW Summer

4
Orlando Utilities Commission
• The State of Florida is regulated• OUC provides fully bundled service
(generation, transmission and distribution)• OUC electric customers:
– Residential 158,000 (86%)– Commercial 25,000 (14%)– Total 183,000
• OUC does not have a large industrial load
5
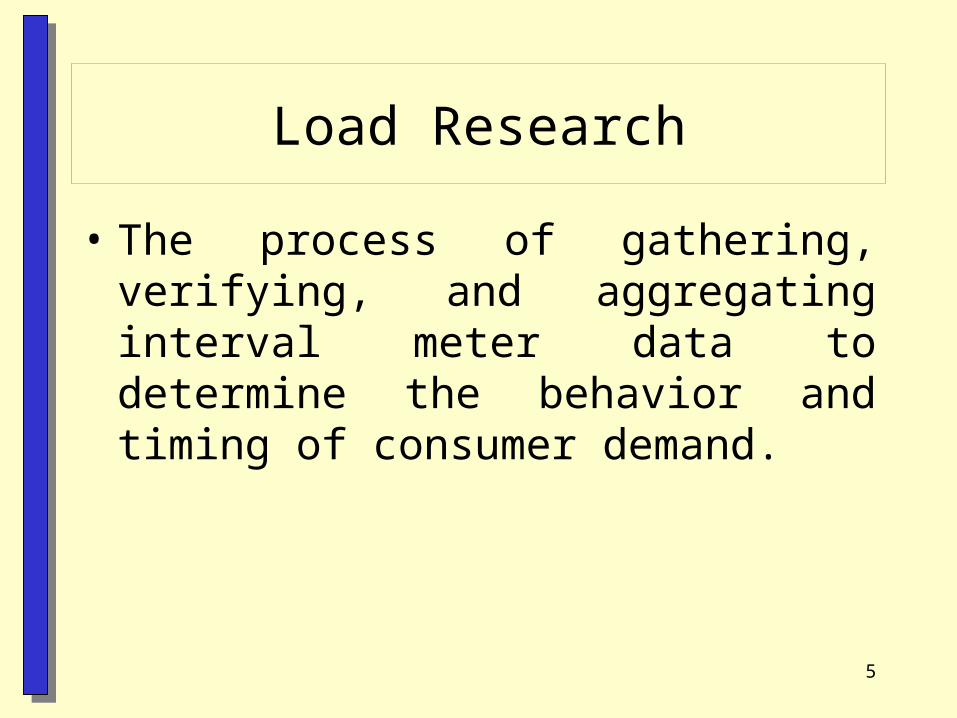
Load Research
• The process of gathering, verifying, and aggregating interval meter data to determine the behavior and timing of consumer demand.
6
Getting Started
• Determine your objective
• Metering equipment
• Hardware required
• Software required
• Required resources
• Determine meter sample selection
• Capital and ongoing costs

7
OUC’s Load Research Objective
• Gain a better understanding of customer and customer class usage characteristics.
• Understand the costs associated with servicing varying usage characteristics.
• Develop rate strategies that send the appropriate rate signals to customers.
• Have necessary information available to develop innovative rates.• Seasonal time of use rates.• Curtailable rates.• Photovoltaic rates.
8
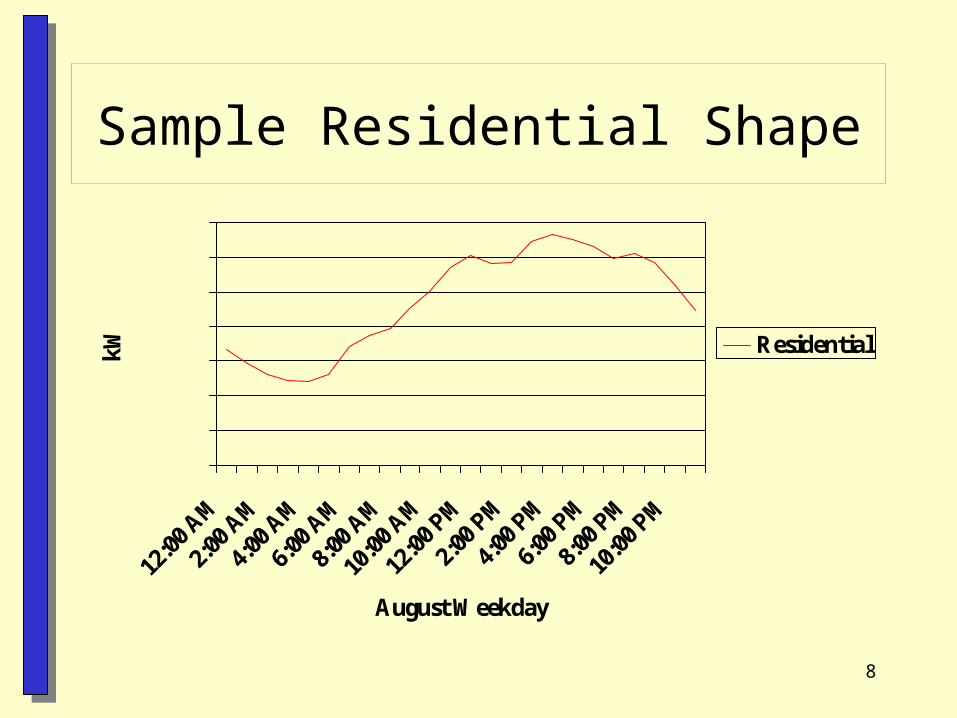
Sample Residential Shape
12:0
0 AM
2:00
AM
4:00
AM
6:00
AM
8:00
AM
10:0
0 AM
12:0
0 PM
2:00
PM
4:00
PM
6:00
PM
8:00
PM
10:0
0 PM
August Weekday
kW Residential
9
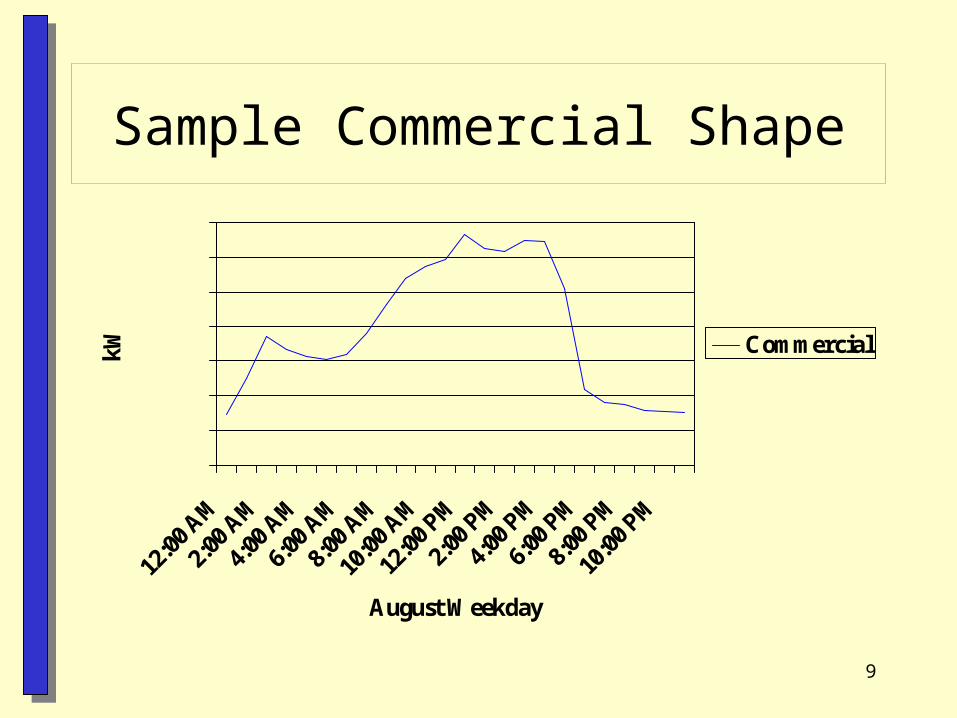
Sample Commercial Shape
12:0
0 AM
2:00
AM
4:00
AM
6:00
AM
8:00
AM
10:0
0 AM
12:0
0 PM
2:00
PM
4:00
PM
6:00
PM
8:00
PM
10:0
0 PM
August Weekday
kW Commercial
10
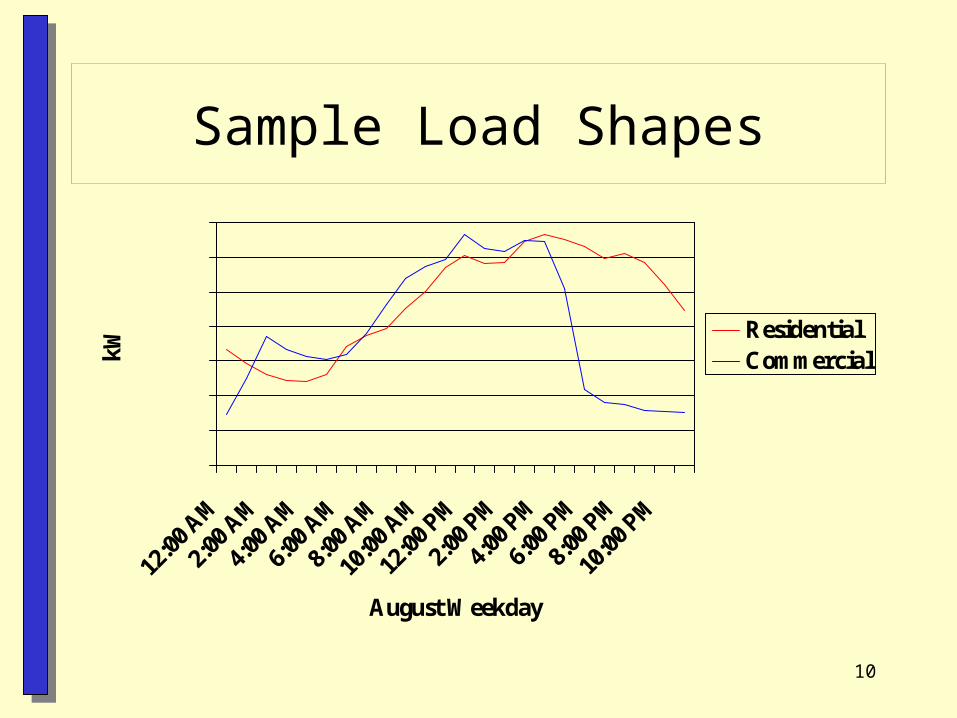
Sample Load Shapes
12:0
0 AM
2:00
AM
4:00
AM
6:00
AM
8:00
AM
10:0
0 AM
12:0
0 PM
2:00
PM
4:00
PM
6:00
PM
8:00
PM
10:0
0 PM
August Weekday
kW
ResidentialCommercial
11
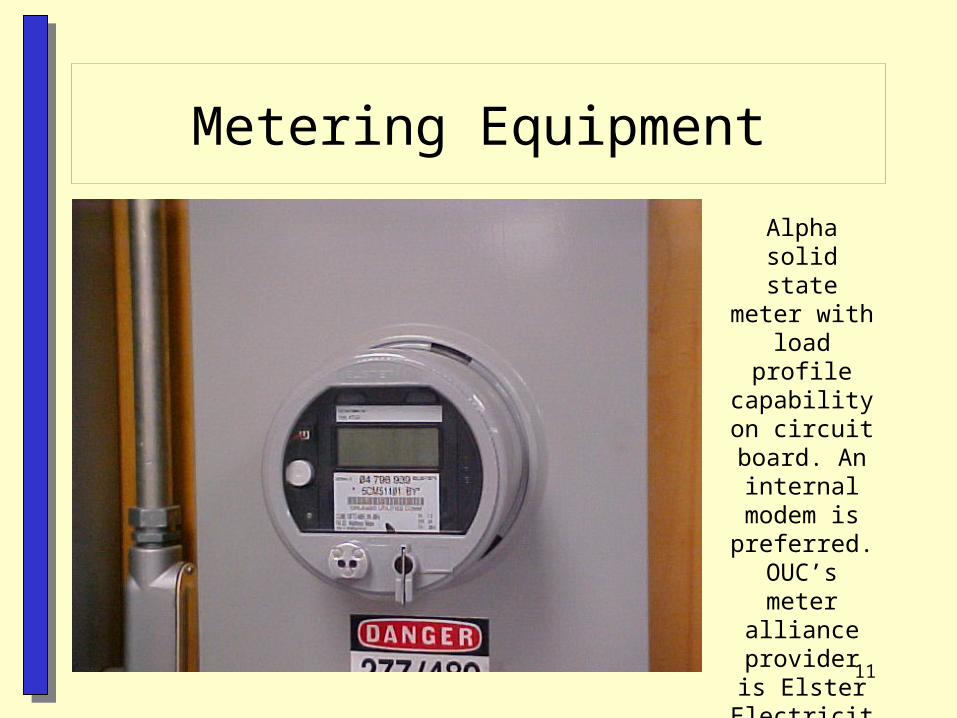
Metering Equipment
Alpha solid state meter with load
profile capability on circuit board. An internal modem is preferred.
OUC’s meter alliance
provider is Elster
Electricity, LLC.
12
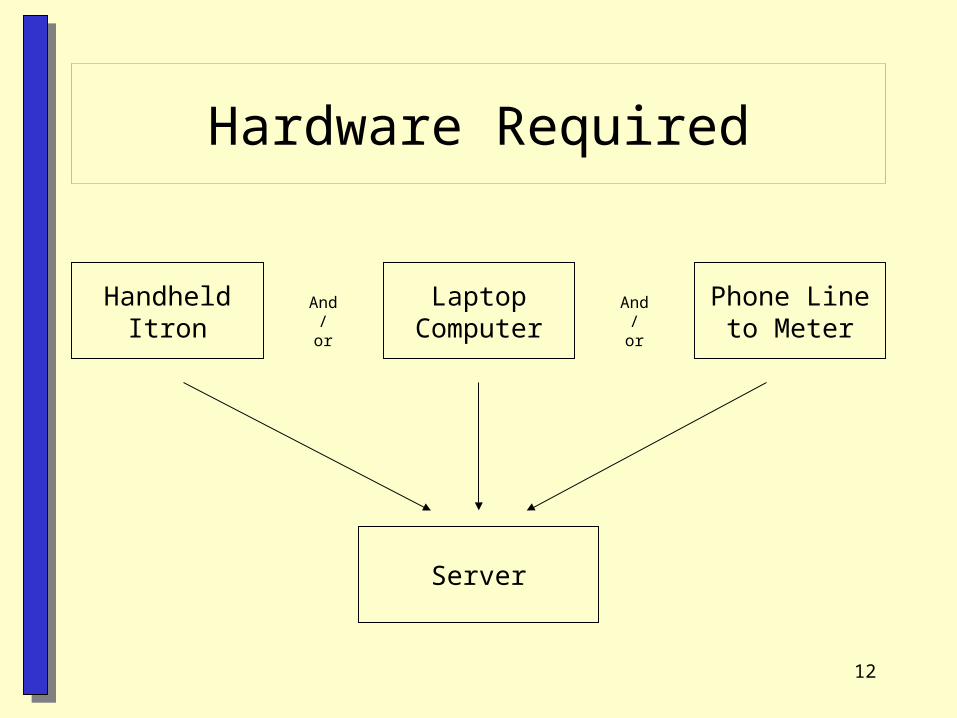
Hardware Required
Handheld Itron
Laptop Computer
Phone Line to Meter
Server
And / or
And / or

13
Hardware Required
14
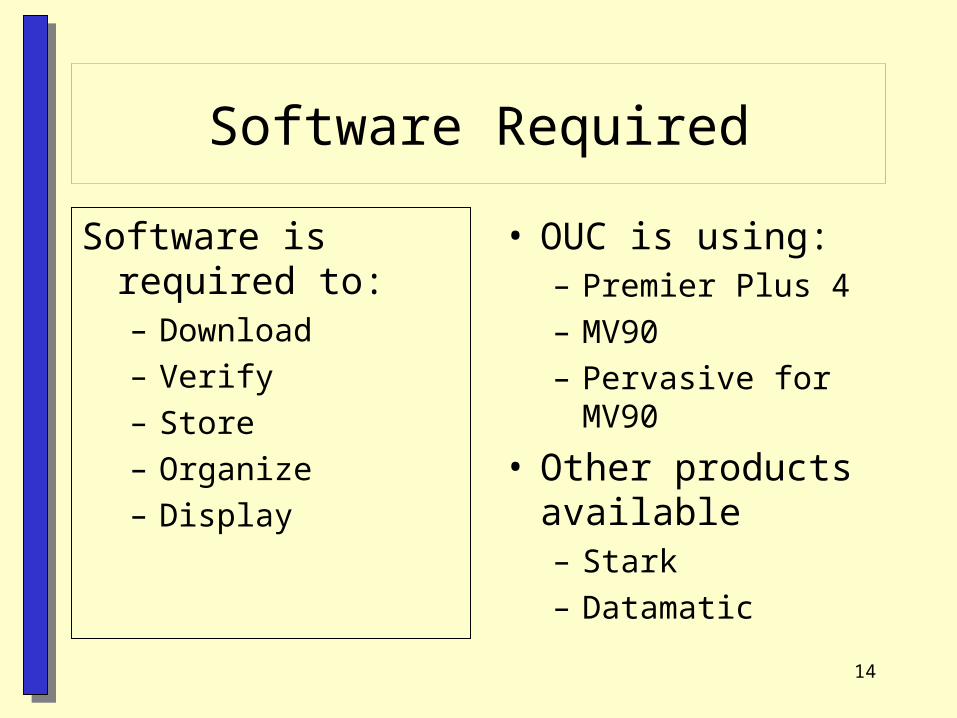
Software Required
• OUC is using:– Premier Plus 4
– MV90
– Pervasive for MV90
• Other products available– Stark
– Datamatic
Software is required to:– Download
– Verify
– Store
– Organize
– Display
15
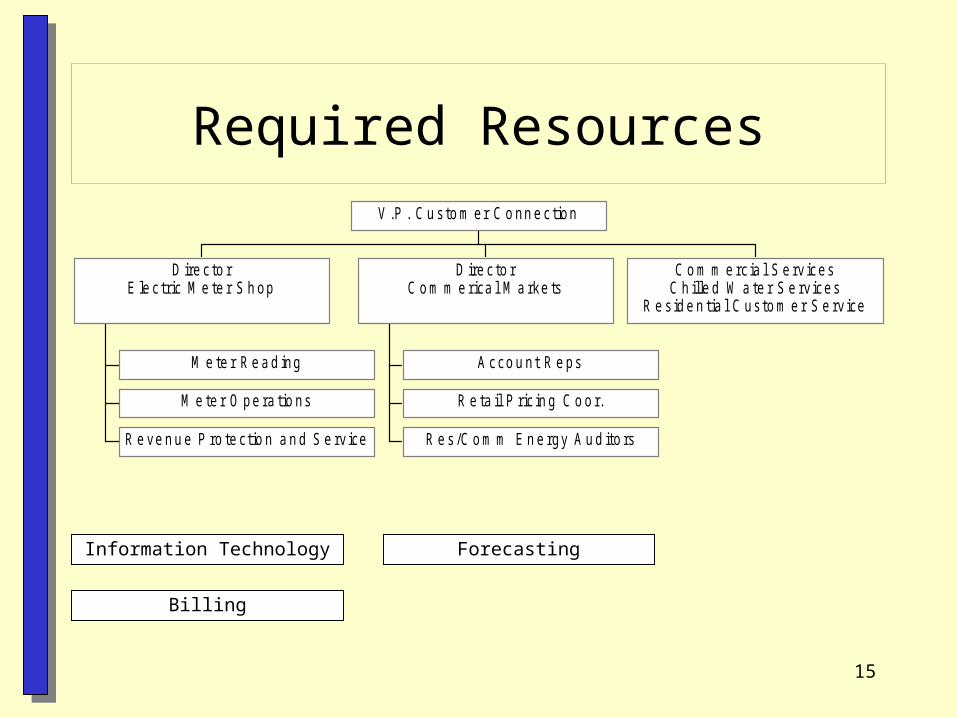
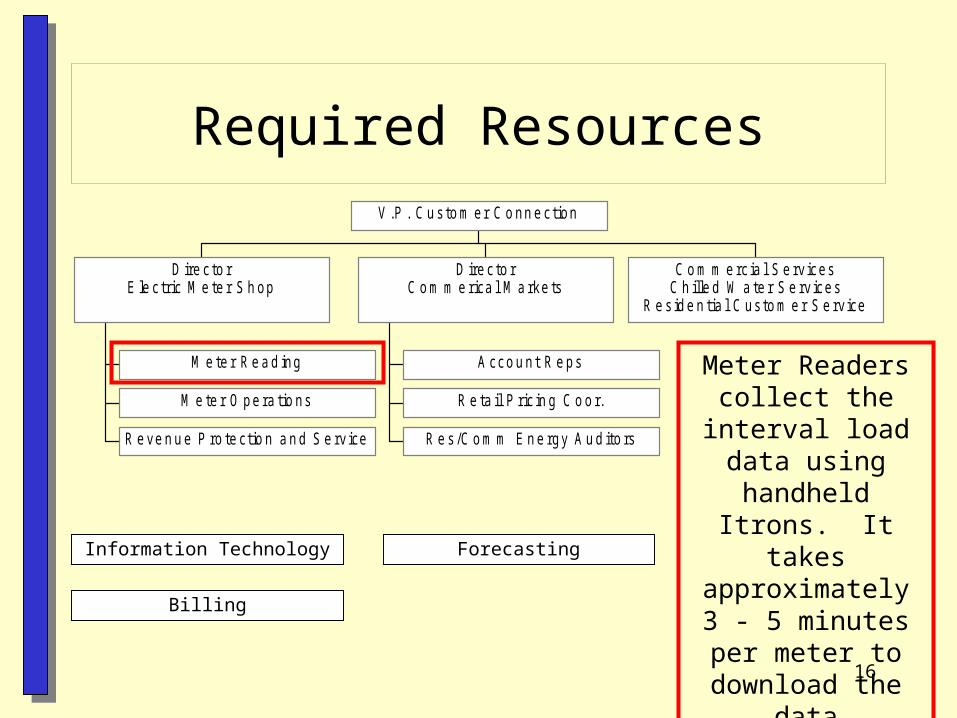
Required Resources
M e te r R e a d ing
M e te r O pe ra tio ns
R e ve n u e P ro te ctio n a n d S e rv ice
D ire c to rE le c tric M e te r S h op
A cco u n t R e ps
R e ta il P ric in g C o o r.
R e s /C o m m E n e rgy A u d ito rs
D ire c to rC o m m e rica l M a rke ts
C o m m e rc ia l S e rv ic esC h ille d W a te r S e rv ic es
R e s id e n tia l C us to m e r S e rv ice
V .P . C u s to m er C o nn e c tion
Information Technology
Billing
Forecasting
16
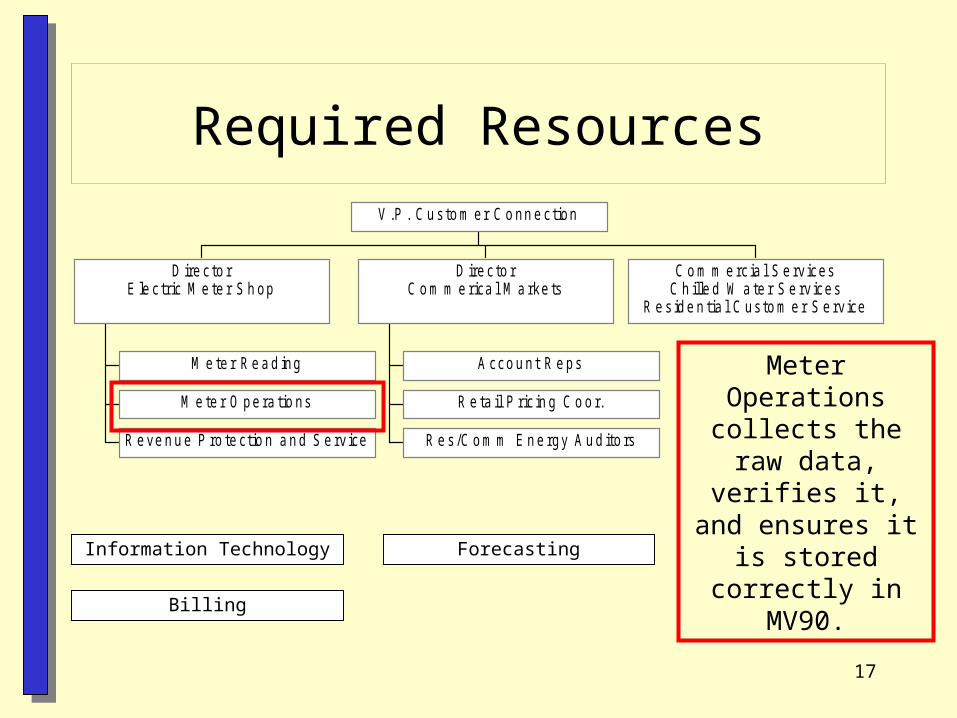
Required Resources
M e te r R e a d ing
M e te r O pe ra tio ns
R e ve n u e P ro te ctio n a n d S e rv ice
D ire c to rE le c tric M e te r S h op
A cco u n t R e ps
R e ta il P ric in g C o o r.
R e s /C o m m E n e rgy A u d ito rs
D ire c to rC o m m e rica l M a rke ts
C o m m e rc ia l S e rv ic esC h ille d W a te r S e rv ic es
R e s id e n tia l C us to m e r S e rv ice
V .P . C u s to m er C o nn e c tion
Information Technology
Billing
Forecasting
Meter Readers collect the interval
load data using handheld Itrons. It
takes approximately 3 - 5 minutes per meter to download the
data
17
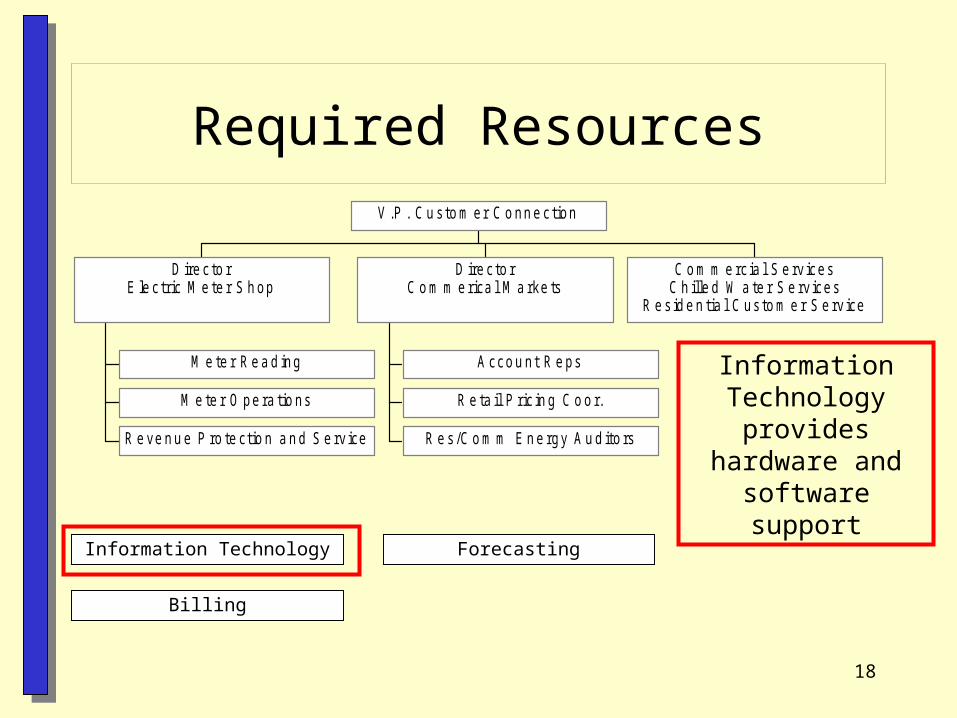
Required Resources
M e te r R e a d ing
M e te r O pe ra tio ns
R e ve n u e P ro te ctio n a n d S e rv ice
D ire c to rE le c tric M e te r S h op
A cco u n t R e ps
R e ta il P ric in g C o o r.
R e s /C o m m E n e rgy A u d ito rs
D ire c to rC o m m e rica l M a rke ts
C o m m e rc ia l S e rv ic esC h ille d W a te r S e rv ic es
R e s id e n tia l C us to m e r S e rv ice
V .P . C u s to m er C o nn e c tion
Information Technology
Billing
Forecasting
Meter Operations collects the raw
data, verifies it, and ensures it is stored correctly in MV90.
18
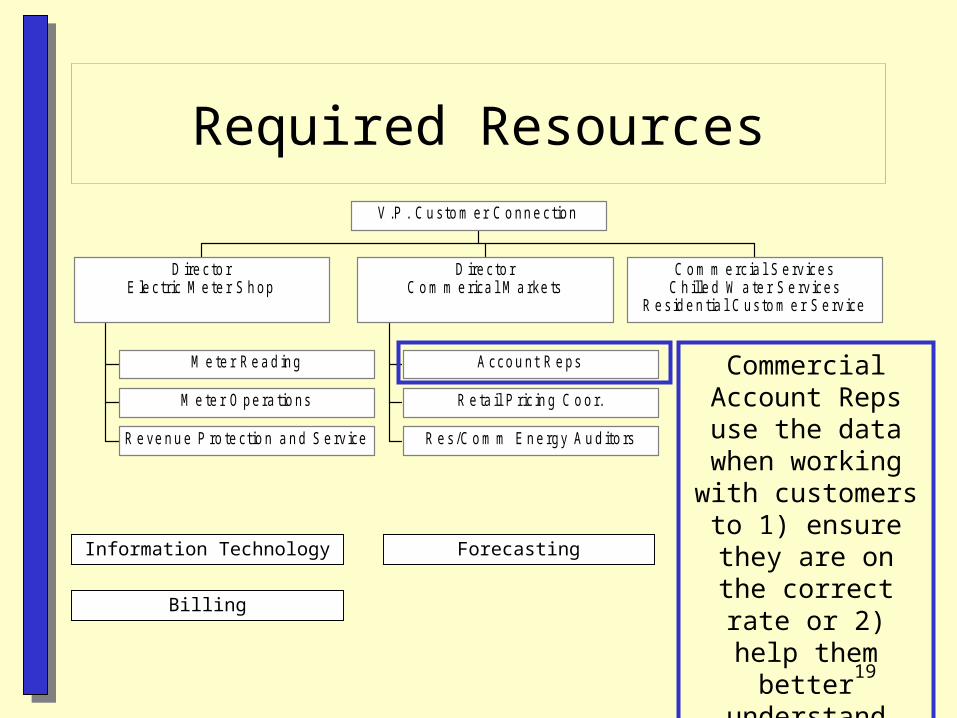
Required Resources
M e te r R e a d ing
M e te r O pe ra tio ns
R e ve n u e P ro te ctio n a n d S e rv ice
D ire c to rE le c tric M e te r S h op
A cco u n t R e ps
R e ta il P ric in g C o o r.
R e s /C o m m E n e rgy A u d ito rs
D ire c to rC o m m e rica l M a rke ts
C o m m e rc ia l S e rv ic esC h ille d W a te r S e rv ic es
R e s id e n tia l C us to m e r S e rv ice
V .P . C u s to m er C o nn e c tion
Information Technology
Billing
Forecasting
Information Technology
provides hardware and software
support
19
Required Resources
M e te r R e a d ing
M e te r O pe ra tio ns
R e ve n u e P ro te ctio n a n d S e rv ice
D ire c to rE le c tric M e te r S h op
A cco u n t R e ps
R e ta il P ric in g C o o r.
R e s /C o m m E n e rgy A u d ito rs
D ire c to rC o m m e rica l M a rke ts
C o m m e rc ia l S e rv ic esC h ille d W a te r S e rv ic es
R e s id e n tia l C us to m e r S e rv ice
V .P . C u s to m er C o nn e c tion
Information Technology
Billing
Forecasting
Commercial Account Reps use
the data when working with
customers to 1) ensure they are on the correct rate or 2) help them better
understand their operations.
20
Required Resources
M e te r R e a d ing
M e te r O pe ra tio ns
R e ve n u e P ro te ctio n a n d S e rv ice
D ire c to rE le c tric M e te r S h op
A cco u n t R e ps
R e ta il P ric in g C o o r.
R e s /C o m m E n e rgy A u d ito rs
D ire c to rC o m m e rica l M a rke ts
C o m m e rc ia l S e rv ic esC h ille d W a te r S e rv ic es
R e s id e n tia l C us to m e r S e rv ice
V .P . C u s to m er C o nn e c tion
Information Technology
Billing
Forecasting
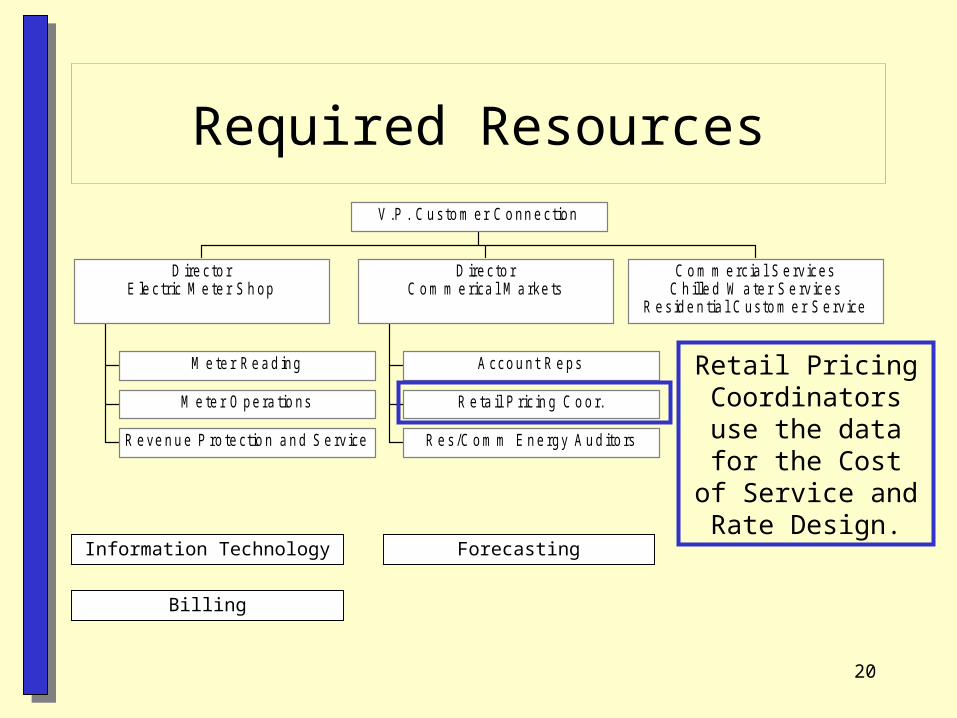
Retail Pricing Coordinators use the data for the
Cost of Service and Rate Design.
21
Required Resources
M e te r R e a d ing
M e te r O pe ra tio ns
R e ve n u e P ro te ctio n a n d S e rv ice
D ire c to rE le c tric M e te r S h op
A cco u n t R e ps
R e ta il P ric in g C o o r.
R e s /C o m m E n e rgy A u d ito rs
D ire c to rC o m m e rica l M a rke ts
C o m m e rc ia l S e rv ic esC h ille d W a te r S e rv ic es
R e s id e n tia l C us to m e r S e rv ice
V .P . C u s to m er C o nn e c tion
Information Technology
Billing
Forecasting
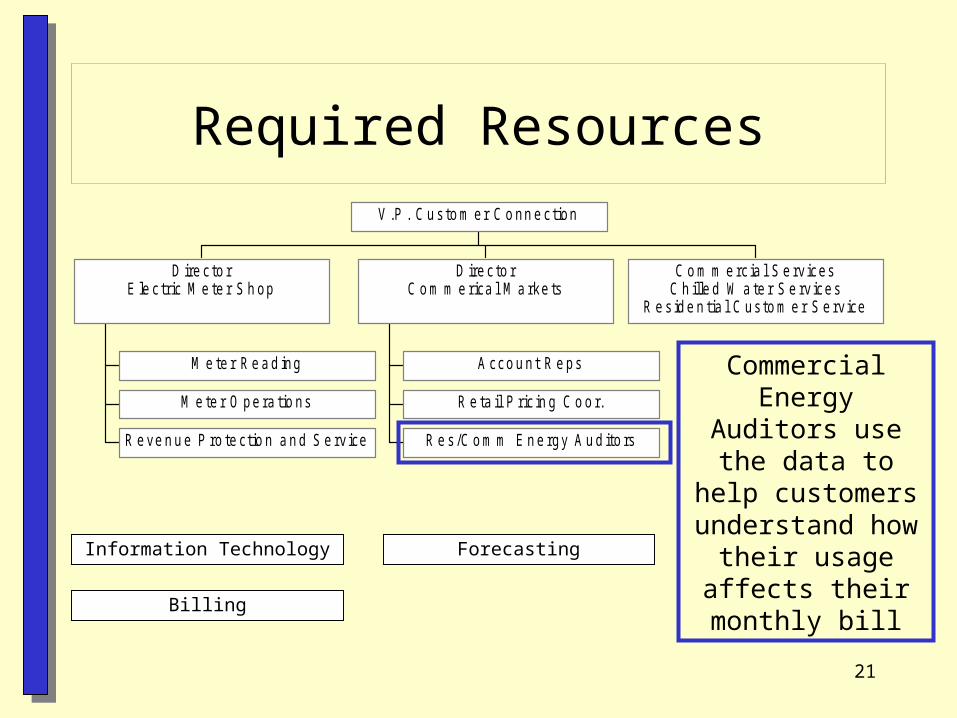
Commercial Energy Auditors use the
data to help customers
understand how their usage affects their monthly bill
22
Required Resources
M e te r R e a d ing
M e te r O pe ra tio ns
R e ve n u e P ro te ctio n a n d S e rv ice
D ire c to rE le c tric M e te r S h op
A cco u n t R e ps
R e ta il P ric in g C o o r.
R e s /C o m m E n e rgy A u d ito rs
D ire c to rC o m m e rica l M a rke ts
C o m m e rc ia l S e rv ic esC h ille d W a te r S e rv ic es
R e s id e n tia l C us to m e r S e rv ice
V .P . C u s to m er C o nn e c tion
Information Technology
Billing
Forecasting
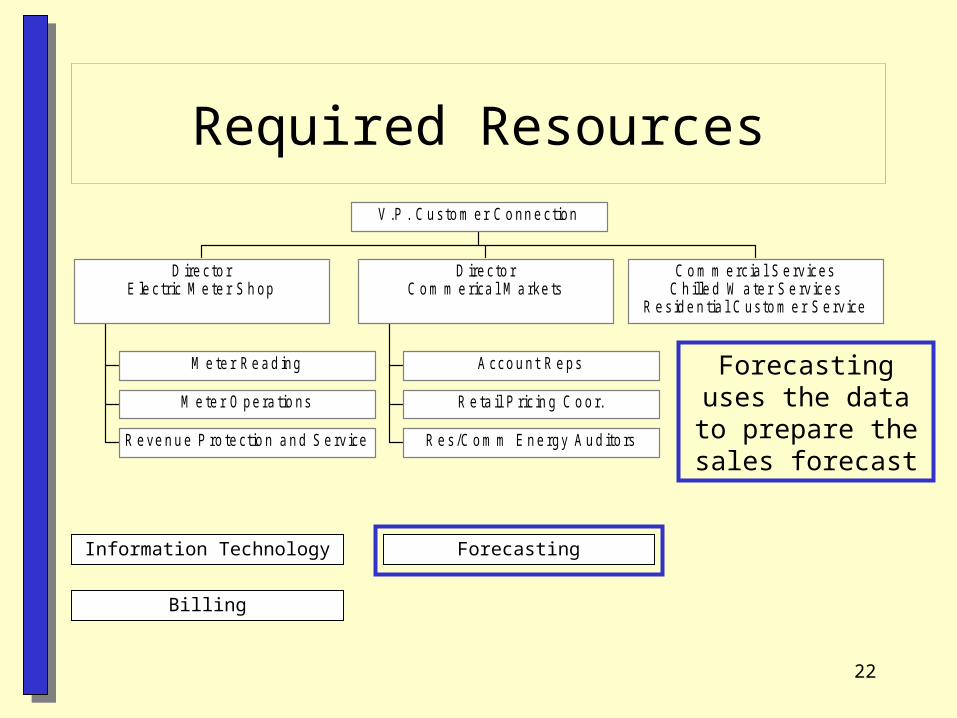
Forecasting uses the data to prepare the sales forecast
23
Meter Sample Selection
24
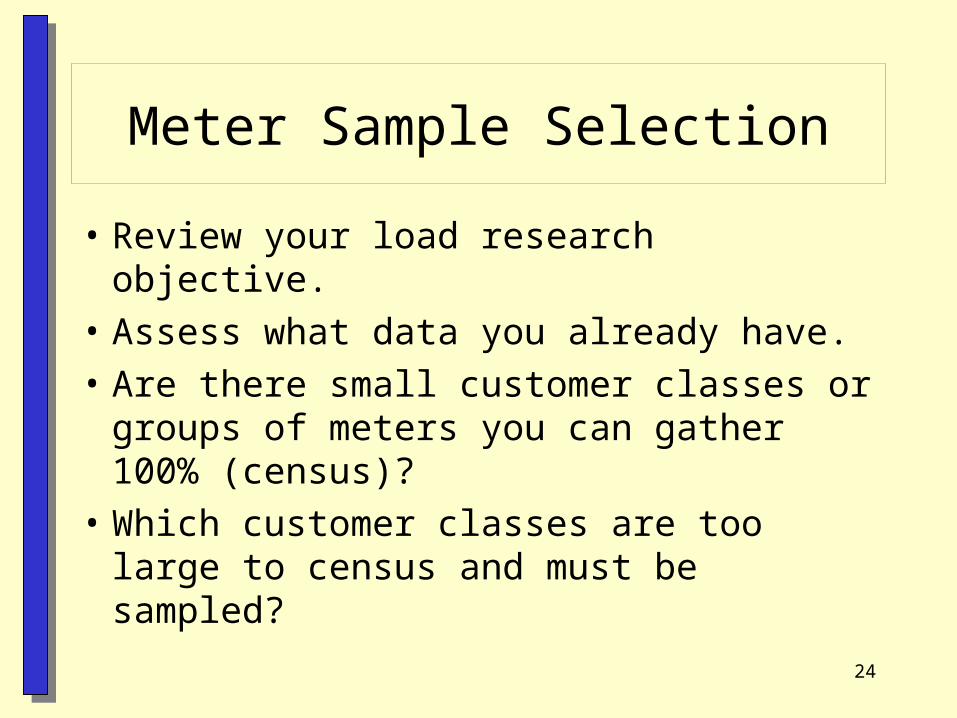
Meter Sample Selection
• Review your load research objective.
• Assess what data you already have.
• Are there small customer classes or groups of meters you can gather 100% (census)?
• Which customer classes are too large to census and must be sampled?
25
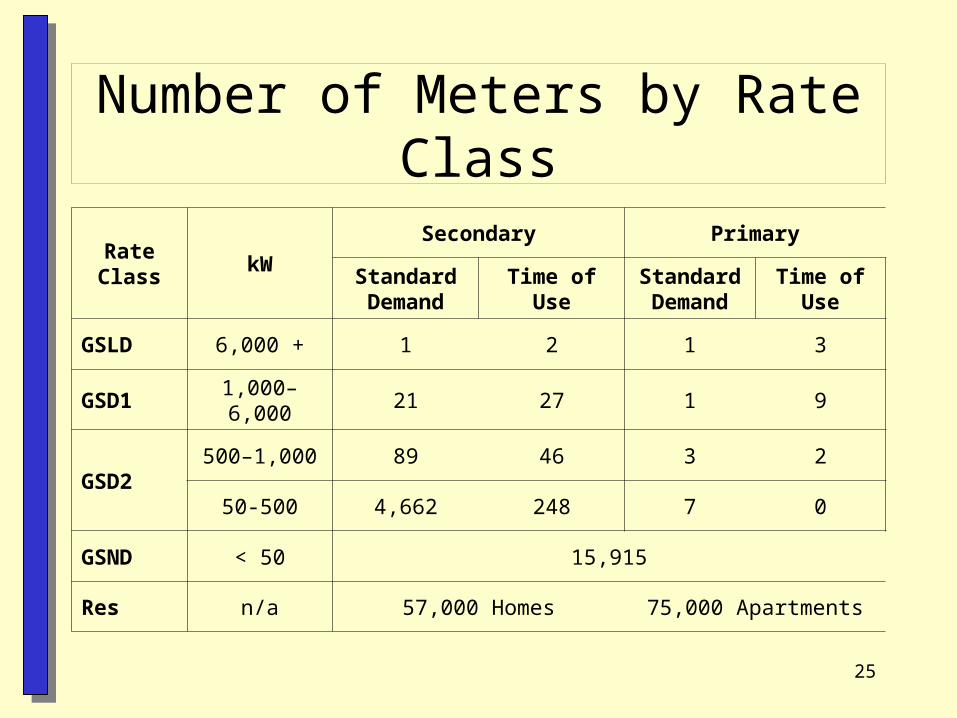
Number of Meters by Rate Class
Rate Class kW
Secondary Primary
Standard Demand
Time of UseStandard Demand
Time of Use
GSLD 6,000 + 1 2 1 3
GSD1 1,000–6,000 21 27 1 9
GSD2500–1,000 89 46 3 2
50-500 4,662 248 7 0
GSND < 50 15,915
Res n/a 57,000 Homes 75,000 Apartments
26
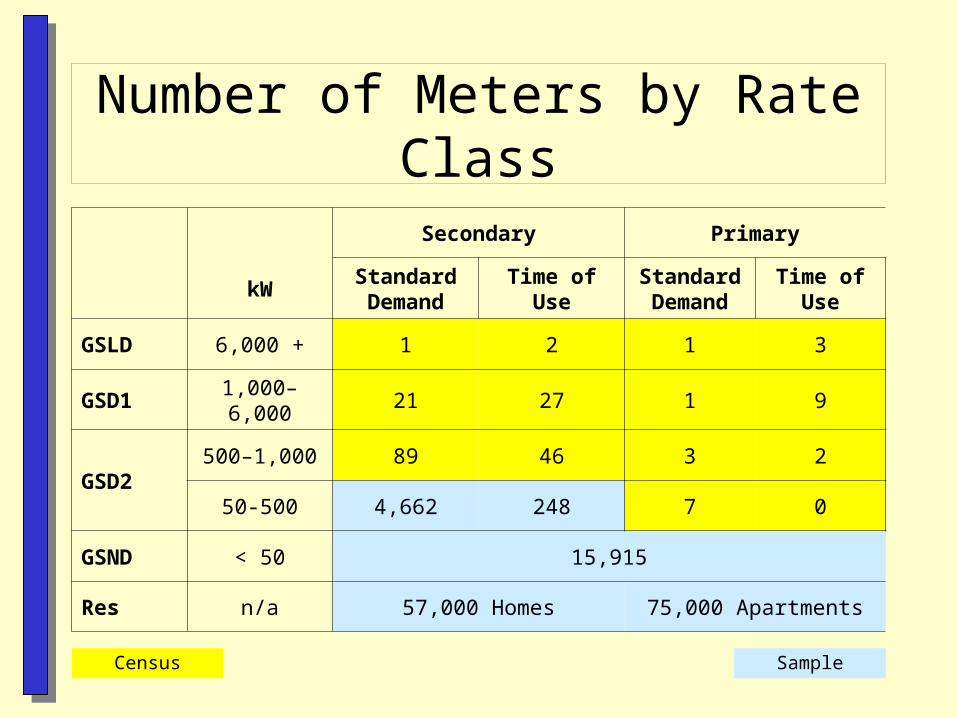
Number of Meters by Rate Class
Secondary Primary
kWStandard Demand
Time of UseStandard Demand
Time of Use
GSLD 6,000 + 1 2 1 3
GSD1 1,000–6,000 21 27 1 9
GSD2500–1,000 89 46 3 2
50-500 4,662 248 7 0
GSND < 50 15,915
Res n/a 57,000 Homes 75,000 Apartments
Census Sample
27
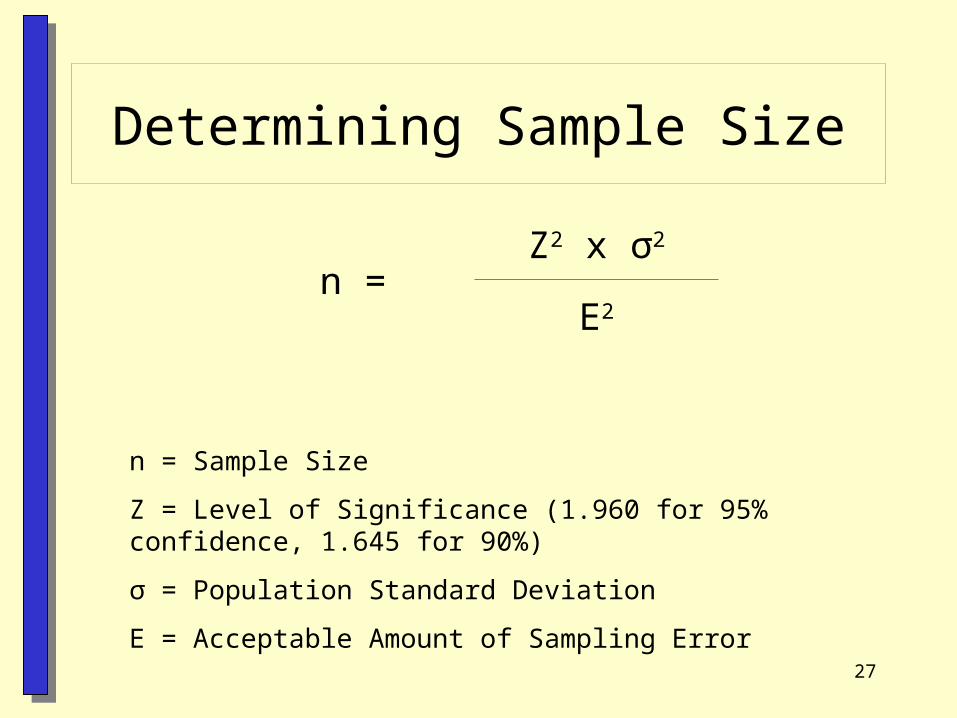
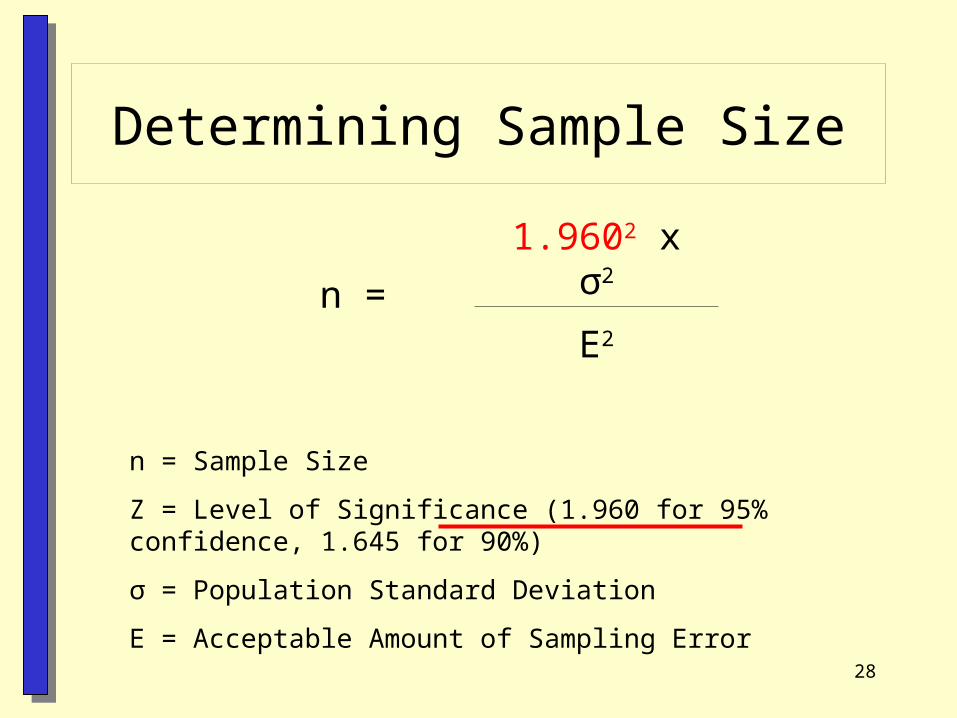
Determining Sample Size
n =Z2 x σ2
E2
n = Sample Size
Z = Level of Significance (1.960 for 95% confidence, 1.645 for 90%)
σ = Population Standard Deviation
E = Acceptable Amount of Sampling Error
28
Determining Sample Size
n =1.9602 x σ2
E2
n = Sample Size
Z = Level of Significance (1.960 for 95% confidence, 1.645 for 90%)
σ = Population Standard Deviation
E = Acceptable Amount of Sampling Error
29
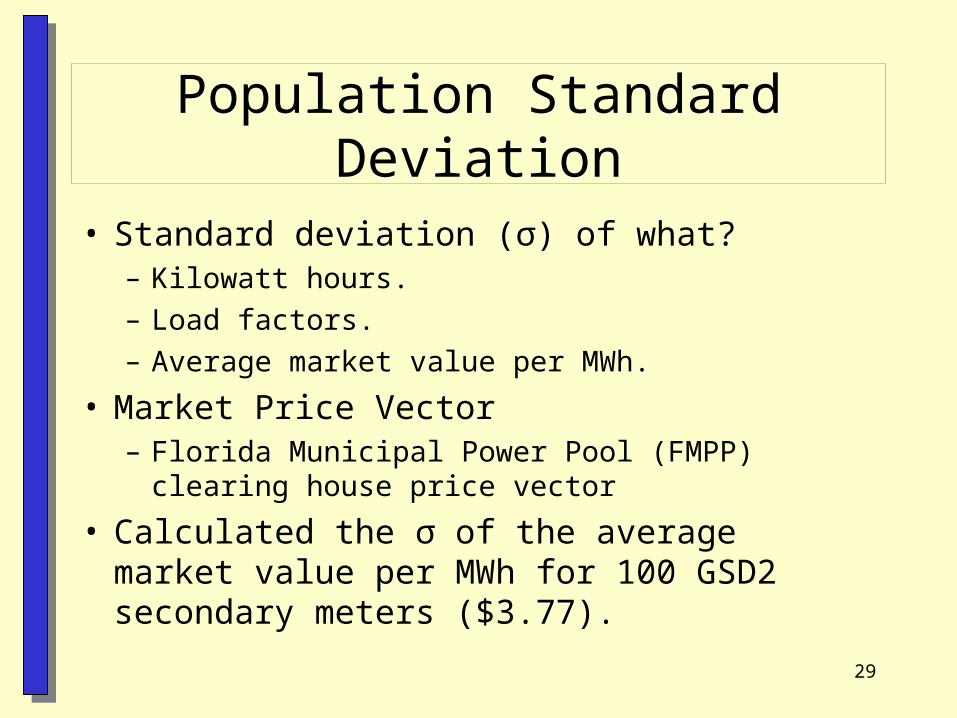
Population Standard Deviation
• Standard deviation (σ) of what?– Kilowatt hours.
– Load factors.
– Average market value per MWh.
• Market Price Vector– Florida Municipal Power Pool (FMPP) clearing house
price vector
• Calculated the σ of the average market value per MWh for 100 GSD2 secondary meters ($3.77).
30
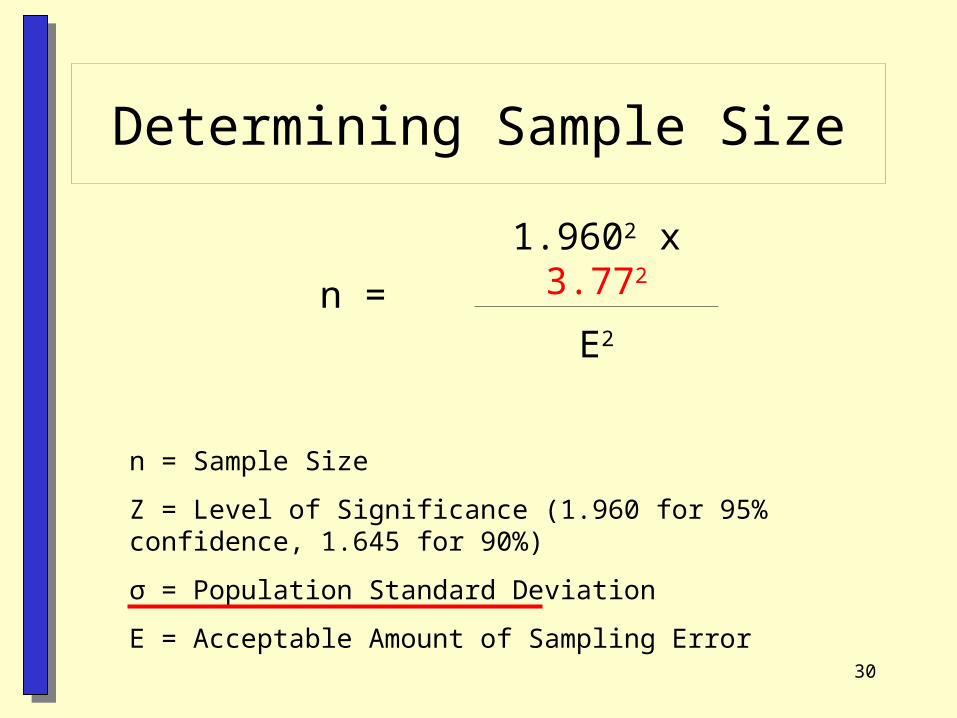
Determining Sample Size
n =1.9602 x 3.772
E2
n = Sample Size
Z = Level of Significance (1.960 for 95% confidence, 1.645 for 90%)
σ = Population Standard Deviation
E = Acceptable Amount of Sampling Error
31
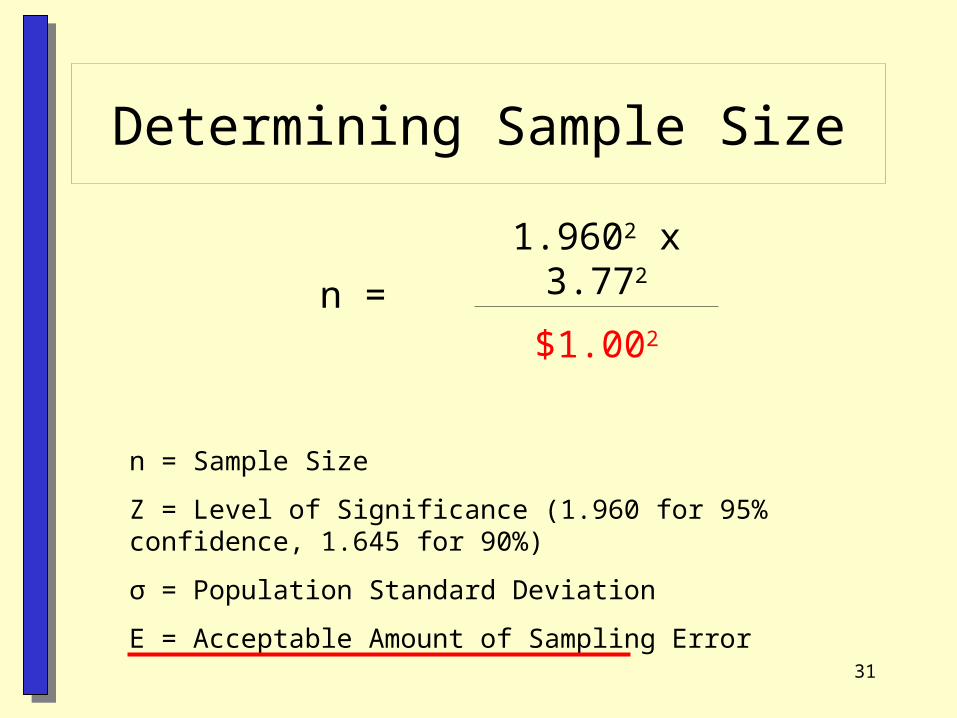
Determining Sample Size
n =1.9602 x 3.772
$1.002
n = Sample Size
Z = Level of Significance (1.960 for 95% confidence, 1.645 for 90%)
σ = Population Standard Deviation
E = Acceptable Amount of Sampling Error
32
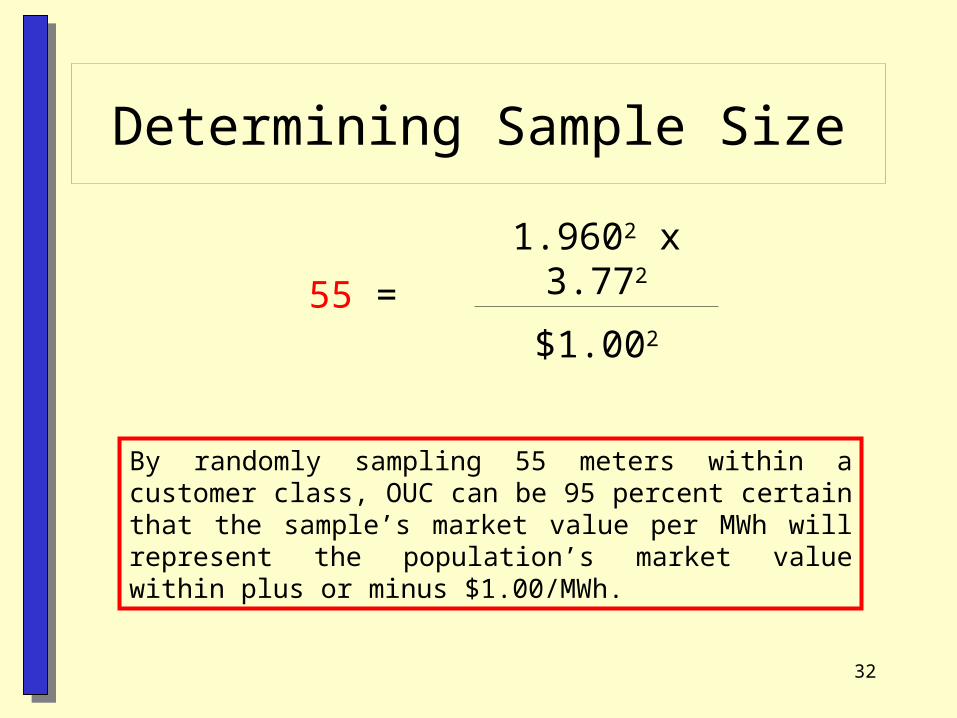
Determining Sample Size
55 =1.9602 x 3.772
$1.002
By randomly sampling 55 meters within a customer class, OUC can be 95 percent certain that the sample’s market value per MWh will represent the population’s market value within plus or minus $1.00/MWh.
33
Uses of Data
Calculating Allocation Factors to Use in the
Cost of Service and Rate Design
34
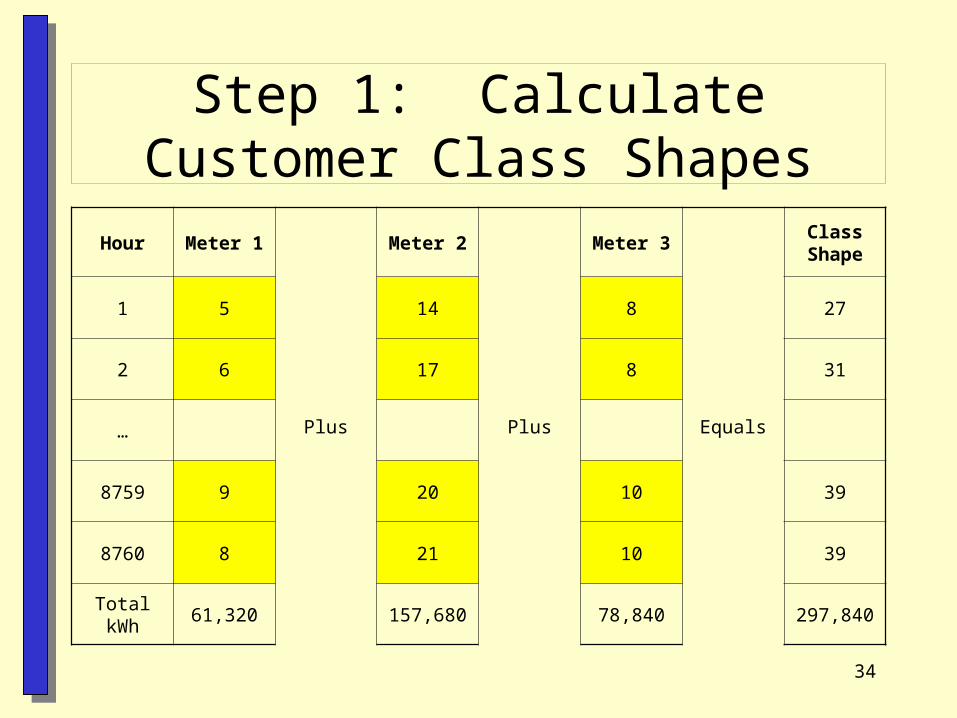
Step 1: Calculate Customer Class Shapes
Hour Meter 1
Plus
Meter 2
Plus
Meter 3
Equals
Class Shape
1 5 14 8 27
2 6 17 8 31
…
8759 9 20 10 39
8760 8 21 10 39
Total kWh 61,320 157,680 78,840 297,840
35
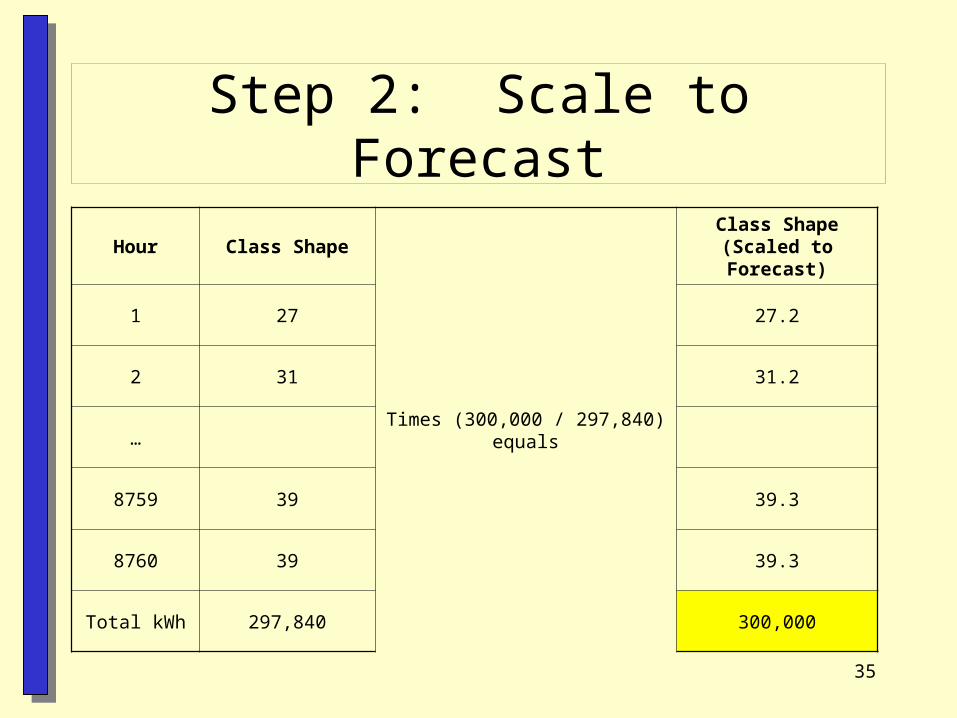
Step 2: Scale to Forecast
Hour Class Shape
Times (300,000 / 297,840) equals
Class Shape (Scaled to Forecast)
1 27 27.2
2 31 31.2
…
8759 39 39.3
8760 39 39.3
Total kWh 297,840 300,000
36
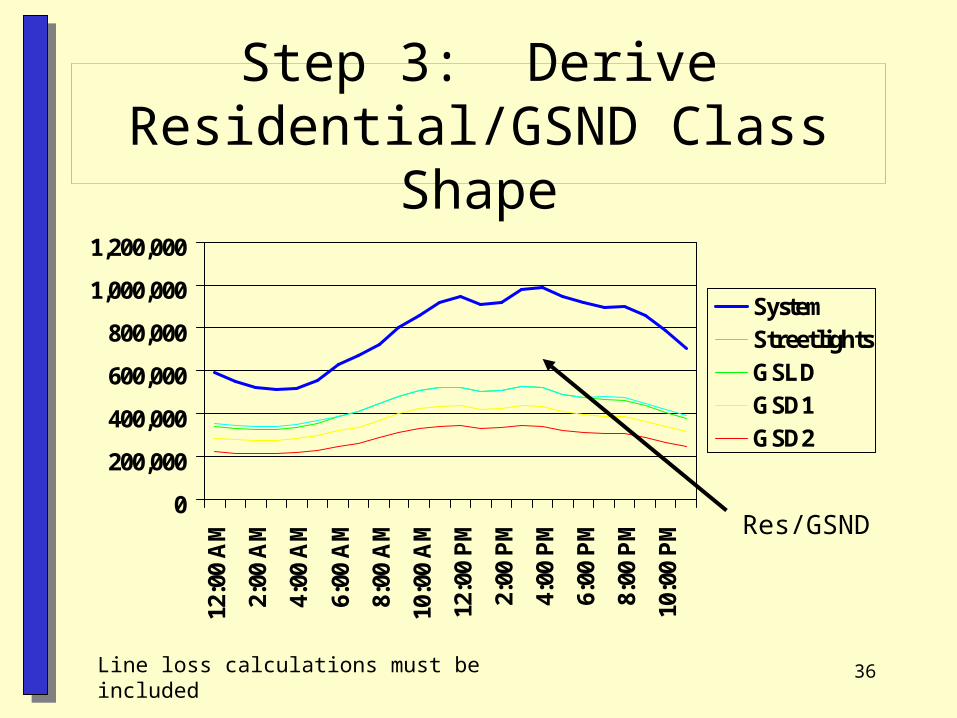
Step 3: Derive Residential/GSND Class Shape
0
200,000
400,000
600,000
800,000
1,000,000
1,200,00012
:00
AM
2:00
AM
4:00
AM
6:00
AM
8:00
AM
10:0
0 A
M
12:0
0 P
M
2:00
PM
4:00
PM
6:00
PM
8:00
PM
10:0
0 P
M
SystemStreetlightsGSLDGSD1GSD2
Res/GSND
Line loss calculations must be included
37
Step 4: Verify Shape of Res/GSND
Compare average market value per MWh of calculated shape to that of sample shape. The two market values should be within $1.00 per MWh.
38
Step 5: Compute Allocation Factors
• Monthly coincident peak (12CP)
• Non-coincident peak (NCP)
• Average and excess demands
• Average market value per MWh– By class– By time period within class
39
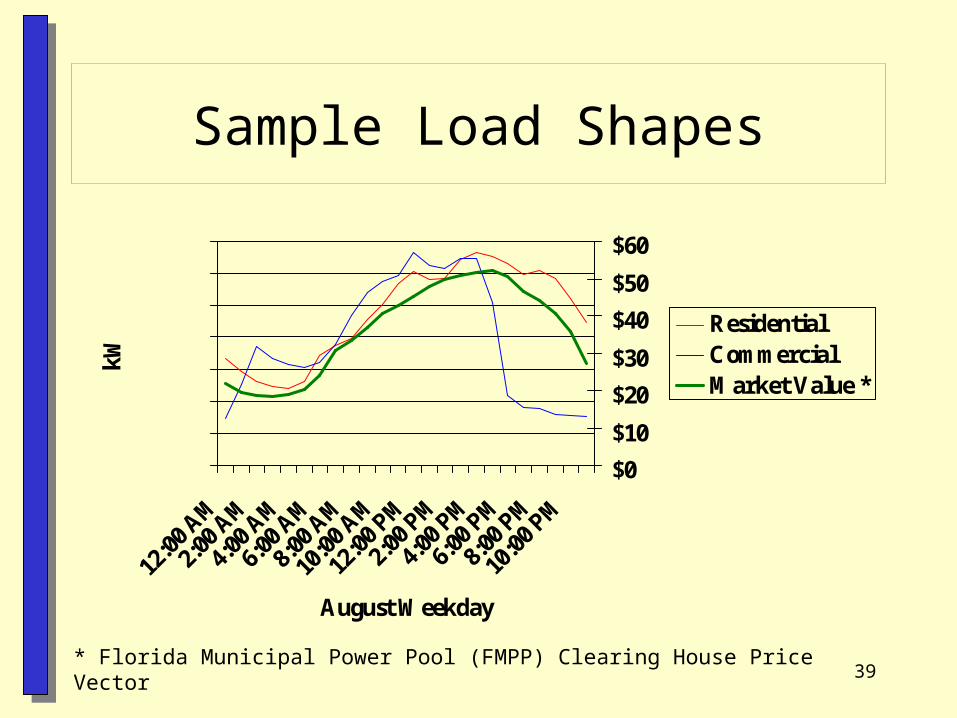
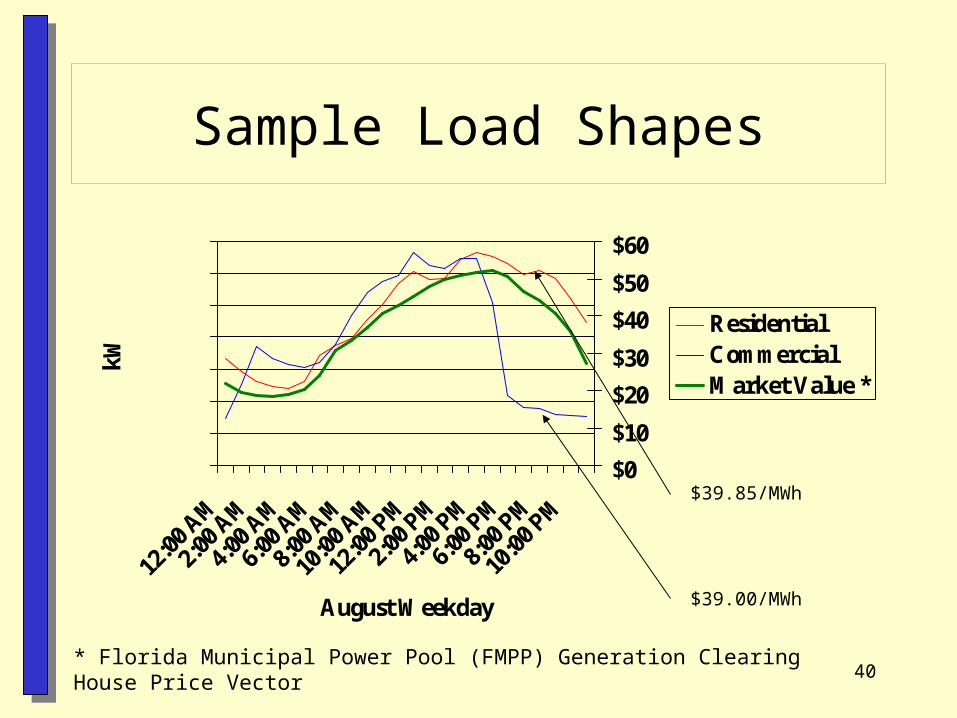
Sample Load Shapes
12:0
0 AM
2:00
AM
4:00
AM
6:00
AM
8:00
AM
10:0
0 AM
12:0
0 PM
2:00
PM
4:00
PM
6:00
PM
8:00
PM
10:0
0 PM
August Weekday
kW
$0
$10
$20
$30
$40
$50
$60
ResidentialCommercialMarket Value *
* Florida Municipal Power Pool (FMPP) Clearing House Price Vector
40
Sample Load Shapes
12:0
0 AM
2:00
AM
4:00
AM
6:00
AM
8:00
AM
10:0
0 AM
12:0
0 PM
2:00
PM
4:00
PM
6:00
PM
8:00
PM
10:0
0 PM
August Weekday
kW
$0
$10
$20
$30
$40
$50
$60
ResidentialCommercialMarket Value *
$39.85/MWh
$39.00/MWh
* Florida Municipal Power Pool (FMPP) Generation Clearing House Price Vector
41
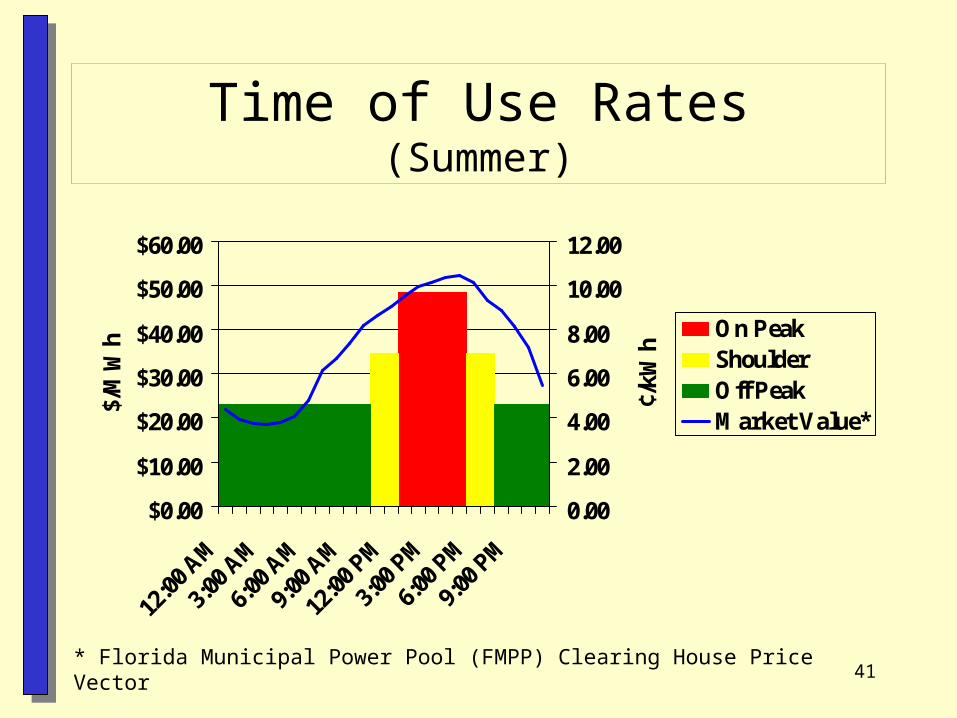
Time of Use Rates(Summer)
$0.00
$10.00
$20.00
$30.00
$40.00
$50.00
$60.00
12:0
0 AM
3:00
AM
6:00
AM
9:00
AM
12:0
0 PM
3:00
PM
6:00
PM
9:00
PM
$/M
Wh
0.00
2.00
4.00
6.00
8.00
10.00
12.00
¢/kW
h
On PeakShoulderOff PeakMarket Value*
* Florida Municipal Power Pool (FMPP) Clearing House Price Vector
42
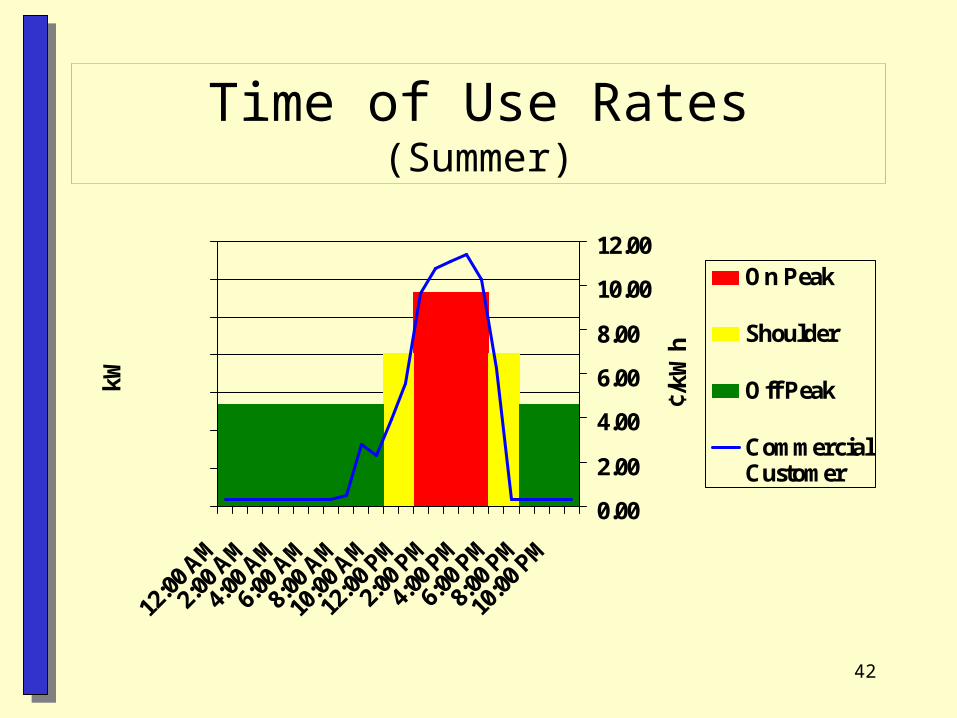
Time of Use Rates(Summer)
12:0
0 AM
2:00
AM
4:00
AM
6:00
AM
8:00
AM
10:0
0 AM
12:0
0 PM
2:00
PM
4:00
PM
6:00
PM
8:00
PM
10:0
0 PM
kW
0.00
2.00
4.00
6.00
8.00
10.00
12.00
¢/kW
h
On Peak
Shoulder
Off Peak
CommercialCustomer
43
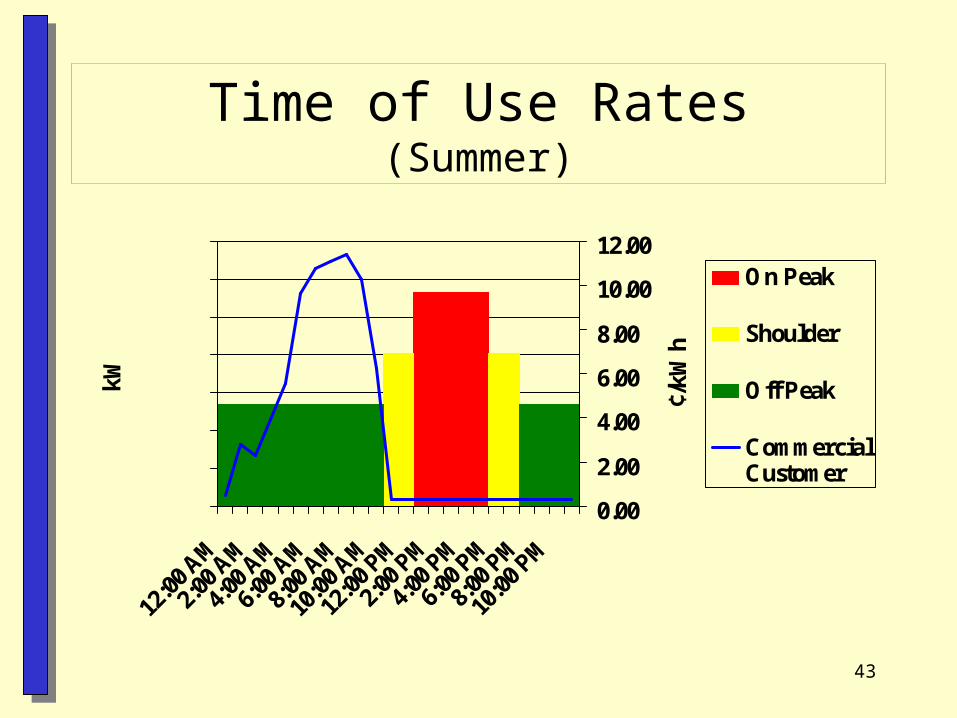
Time of Use Rates(Summer)
12:0
0 AM
2:00
AM
4:00
AM
6:00
AM
8:00
AM
10:0
0 AM
12:0
0 PM
2:00
PM
4:00
PM
6:00
PM
8:00
PM
10:0
0 PM
kW
0.00
2.00
4.00
6.00
8.00
10.00
12.00
¢/kW
h
On Peak
Shoulder
Off Peak
CommercialCustomer
44
Other Uses of Load Research Data
• OUConsumption Online– Enables customers to understand their cost
causation
• Totalize kW on contiguous site
• Look at cost for an individual customer
• Energy conservation programs