Embed Size (px)
Citation preview
May 2018
Disclaimer: Forward Looking Statements
This presentation/announcement may contain forward looking statements with projections regarding, among
other things, the Group’s strategy, revenues, earnings, trading profit, trading margin, finance costs, tax rate,
capital expenditure, dividends, cash flow, net debt or other financial measures, the impact of foreign exchange
fluctuations, the impact of raw material fluctuations and other competitive pressures. These and other forward
looking statements reflect management expectations based on currently available data.
However, actual results will be influenced by, among other things, macro-economic conditions, food industry
supply and demand issues, foreign exchange fluctuations, raw material and commodity fluctuations, the
successful acquisition and integration of new businesses, the successful execution of business transformation
programmes and other, as of today, unknown factors. Therefore actual results may differ materially from these
projections.
These forward looking statements speak only as of the date they were made and the Group undertakes no
obligation to publicly update any forward looking statement, whether as a result of new information, future
events or otherwise.
© Kerry 2018 | 2
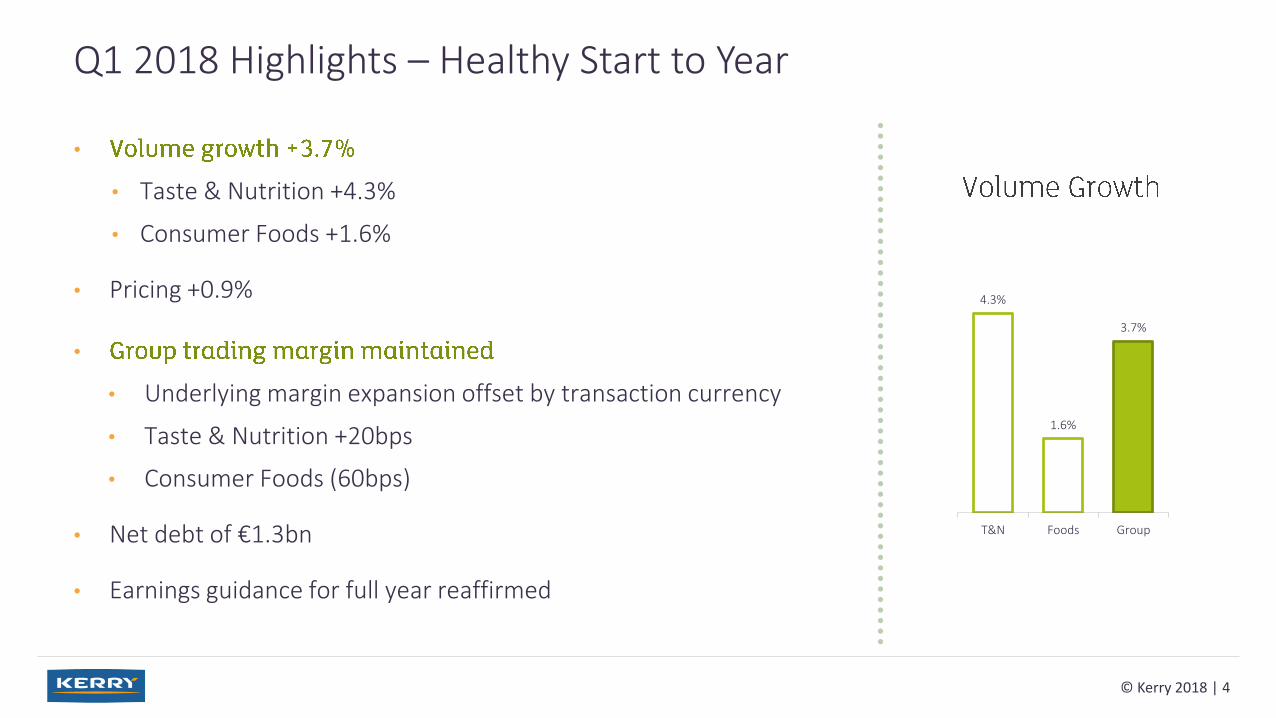
•
• Taste & Nutrition +4.3%
• Consumer Foods +1.6%
• Pricing +0.9%
•
• Underlying margin expansion offset by transaction currency
• Taste & Nutrition +20bps
• Consumer Foods (60bps)
• Net debt of €1.3bn
• Earnings guidance for full year reaffirmed
Q1 2018 Highlights – Healthy Start to Year
© Kerry 2018 | 4
4.3%
1.6%
3.7%
T&N Foods Group
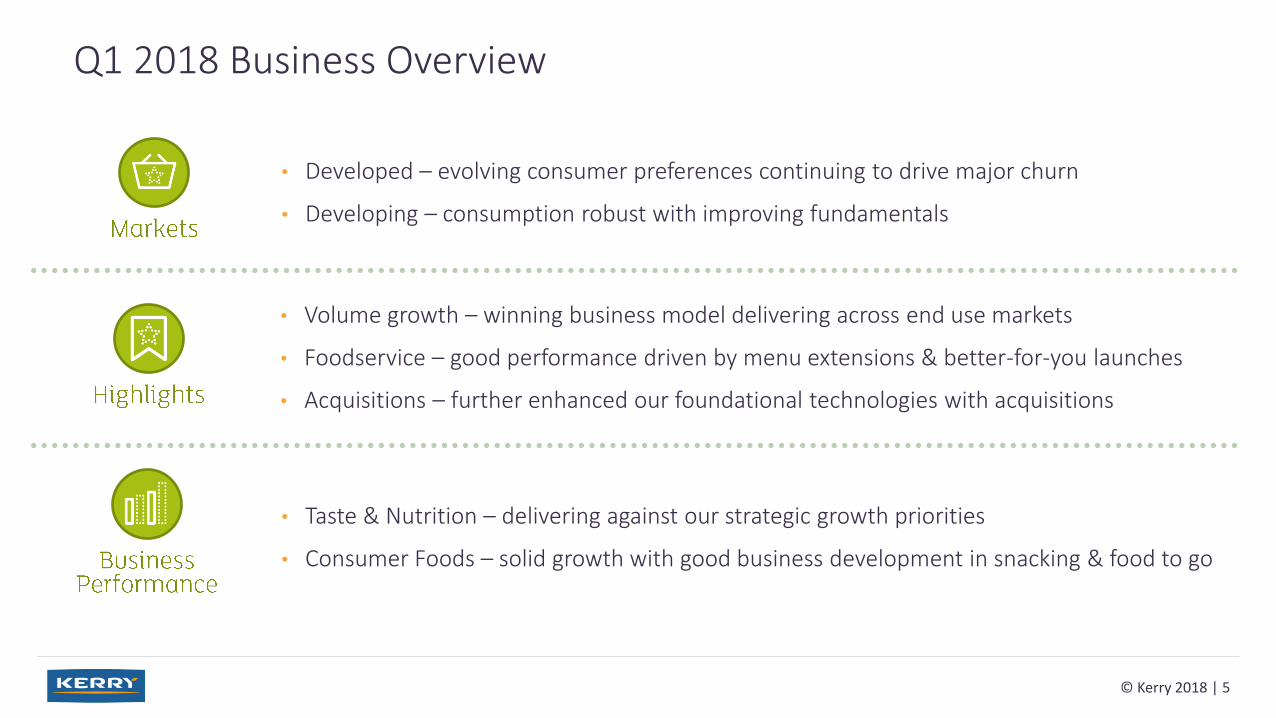
Q1 2018 Business Overview
© Kerry 2018 | 5
• Developed – evolving consumer preferences continuing to drive major churn
• Developing – consumption robust with improving fundamentals
• Volume growth – winning business model delivering across end use markets
• Foodservice – good performance driven by menu extensions & better-for-you launches
• Acquisitions – further enhanced our foundational technologies with acquisitions
• Taste & Nutrition – delivering against our strategic growth priorities
• Consumer Foods – solid growth with good business development in snacking & food to go
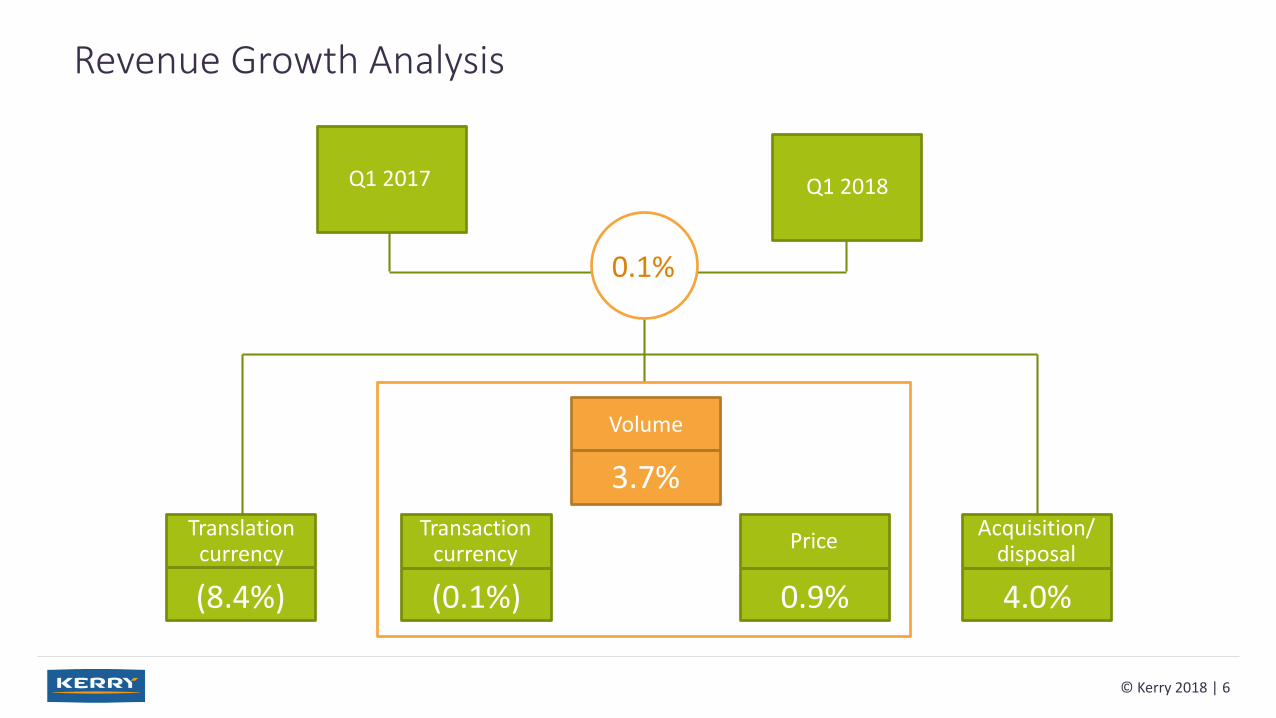
Revenue Growth Analysis
© Kerry 2018 | 6
Q1 2018
0.1%
3.6%
Volume
Q1 2017
3.7%
Volume
(0.1%)
Transactioncurrency
0.9%
Price
4.0%
Acquisition/disposal
(8.4%)
Translation currency
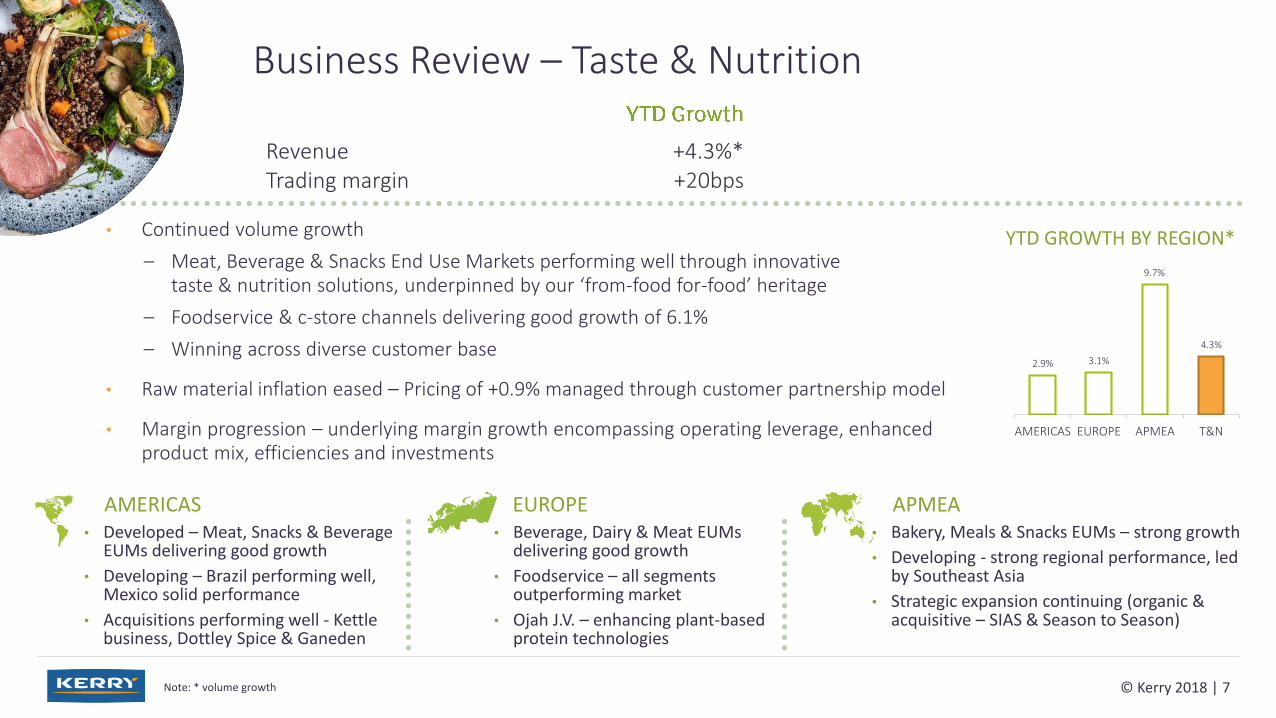
Business Review – Taste & Nutrition
• Continued volume growth
– Meat, Beverage & Snacks End Use Markets performing well through innovativetaste & nutrition solutions, underpinned by our ‘from-food for-food’ heritage
– Foodservice & c-store channels delivering good growth of 6.1%
– Winning across diverse customer base
• Raw material inflation eased – Pricing of +0.9% managed through customer partnership model
• Margin progression – underlying margin growth encompassing operating leverage, enhanced product mix, efficiencies and investments
© Kerry 2018 | 7
Revenue +4.3%*Trading margin +20bps
Note: * volume growth
APMEAEUROPEAMERICAS• Developed – Meat, Snacks & Beverage
EUMs delivering good growth
• Developing – Brazil performing well, Mexico solid performance
• Acquisitions performing well - Kettle business, Dottley Spice & Ganeden
• Bakery, Meals & Snacks EUMs – strong growth
• Developing - strong regional performance, led by Southeast Asia
• Strategic expansion continuing (organic & acquisitive – SIAS & Season to Season)
• Beverage, Dairy & Meat EUMs delivering good growth
• Foodservice – all segments outperforming market
• Ojah J.V. – enhancing plant-based protein technologies
2.9% 3.1%
9.7%
4.3%
AMERICAS EUROPE APMEA T&N
YTD GROWTH BY REGION*
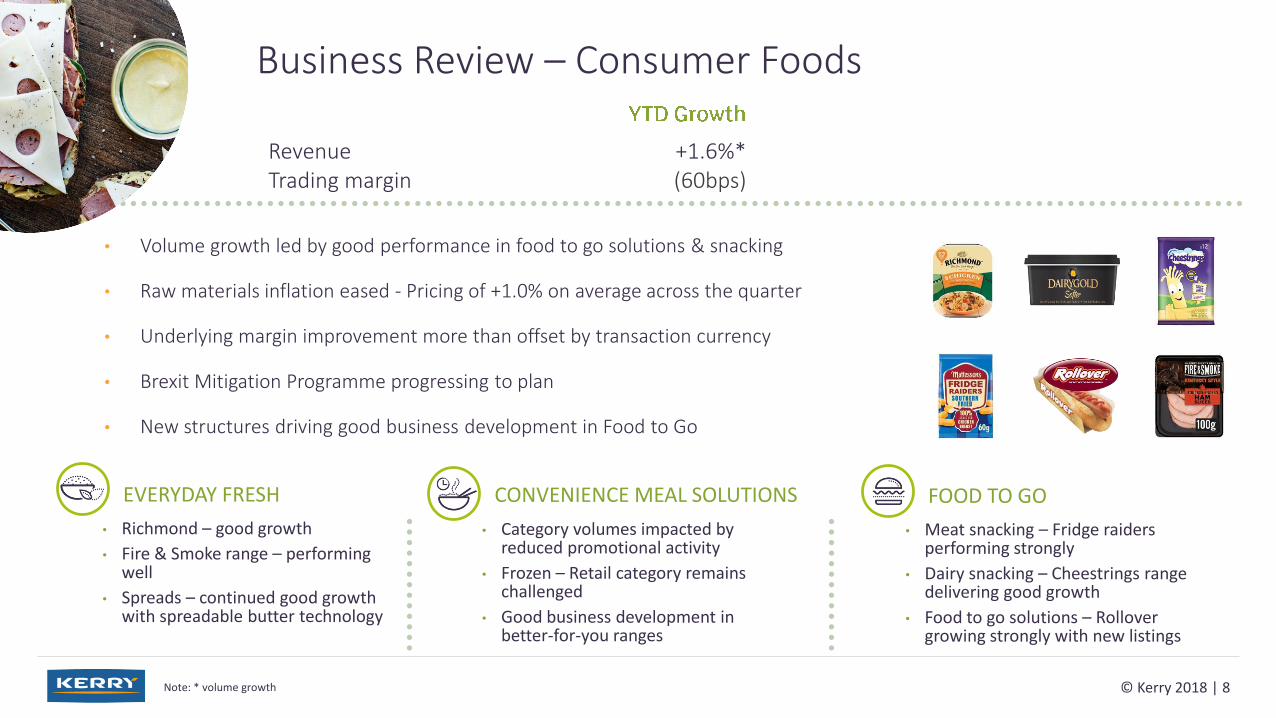
Business Review – Consumer Foods
• Volume growth led by good performance in food to go solutions & snacking
• Raw materials inflation eased - Pricing of +1.0% on average across the quarter
• Underlying margin improvement more than offset by transaction currency
• Brexit Mitigation Programme progressing to plan
• New structures driving good business development in Food to Go
© Kerry 2018 | 8
Revenue +1.6%*Trading margin (60bps)
Note: * volume growth
FOOD TO GO CONVENIENCE MEAL SOLUTIONSEVERYDAY FRESH
• Richmond – good growth
• Fire & Smoke range – performing well
• Spreads – continued good growth with spreadable butter technology
• Meat snacking – Fridge raiders performing strongly
• Dairy snacking – Cheestrings range delivering good growth
• Food to go solutions – Rollover growing strongly with new listings
• Category volumes impacted by reduced promotional activity
• Frozen – Retail category remains challenged
• Good business development in better-for-you ranges
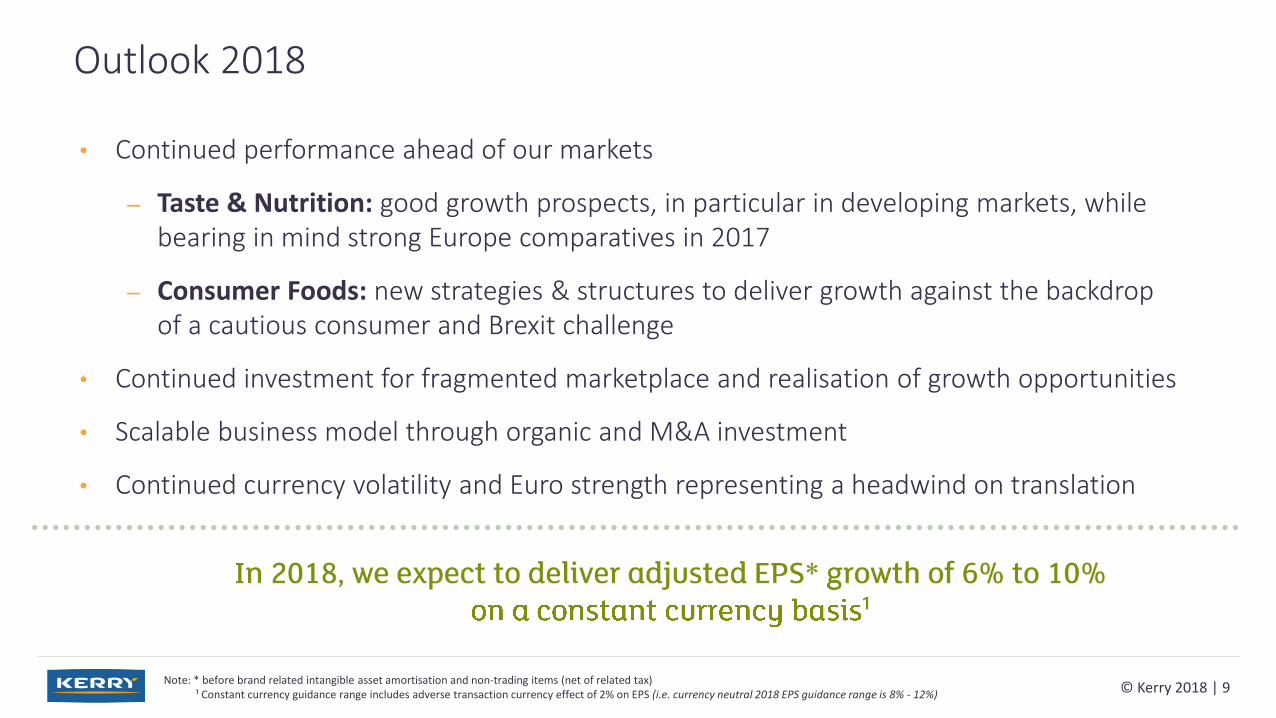
Outlook 2018
• Continued performance ahead of our markets
– Taste & Nutrition: good growth prospects, in particular in developing markets, while bearing in mind strong Europe comparatives in 2017
– Consumer Foods: new strategies & structures to deliver growth against the backdrop of a cautious consumer and Brexit challenge
• Continued investment for fragmented marketplace and realisation of growth opportunities
• Scalable business model through organic and M&A investment
• Continued currency volatility and Euro strength representing a headwind on translation
Note: * before brand related intangible asset amortisation and non-trading items (net of related tax)¹ Constant currency guidance range includes adverse transaction currency effect of 2% on EPS (i.e. currency neutral 2018 EPS guidance range is 8% - 12%) © Kerry 2018 | 9
¹

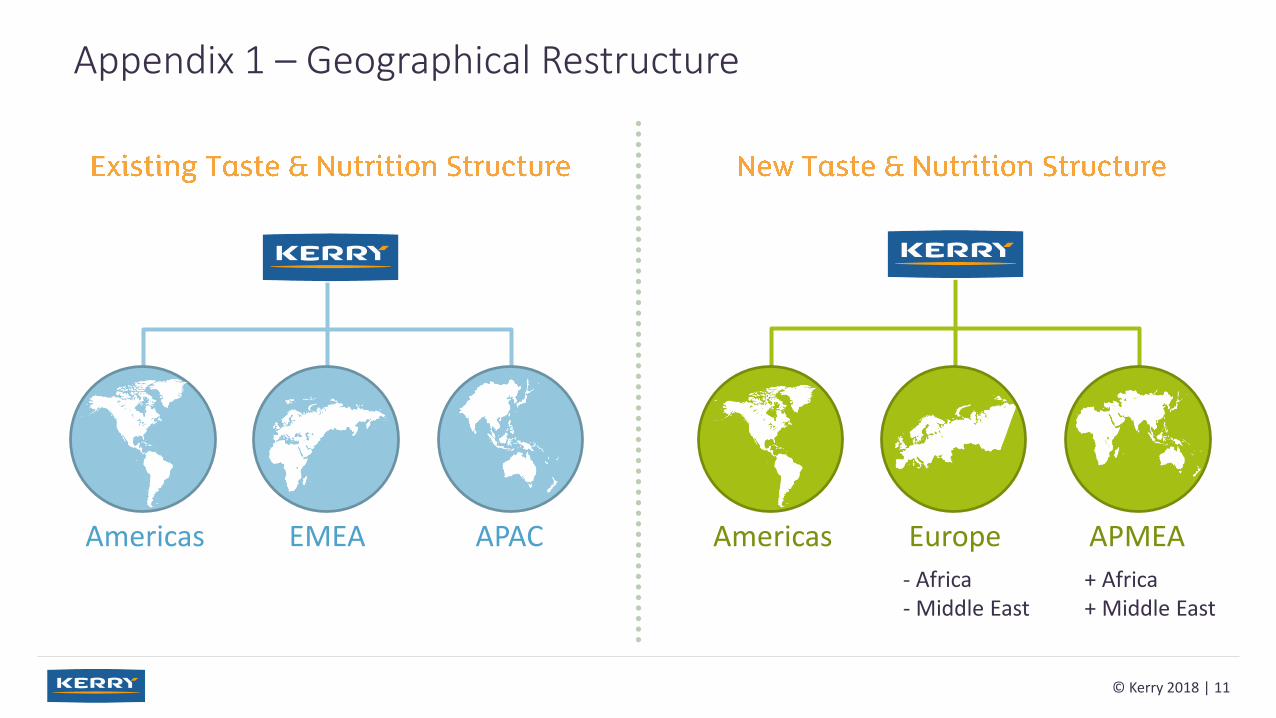
Appendix 1 – Geographical Restructure
© Kerry 2018 | 11
Americas Europe APMEAAmericas EMEA APAC
+ Africa+ Middle East
- Africa- Middle East
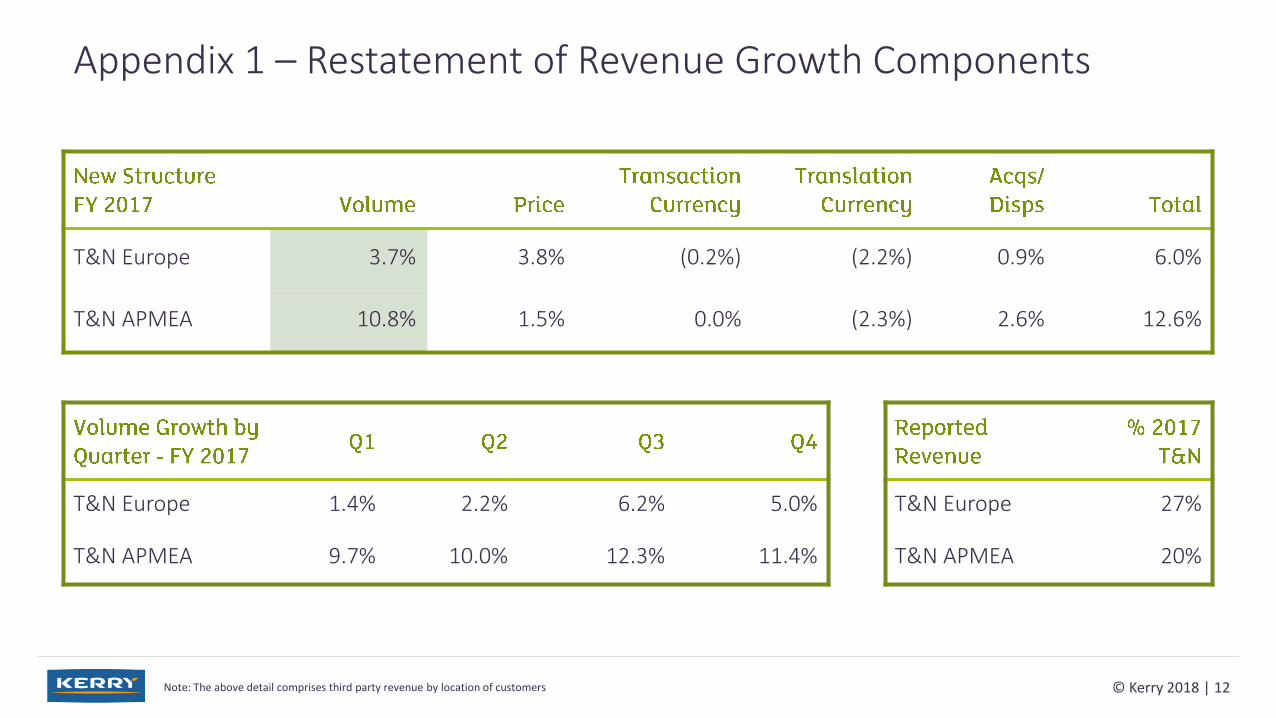
Appendix 1 – Restatement of Revenue Growth Components
Note: The above detail comprises third party revenue by location of customers © Kerry 2018 | 12
T&N Europe 3.7% 3.8% (0.2%) (2.2%) 0.9% 6.0%
T&N APMEA 10.8% 1.5% 0.0% (2.3%) 2.6% 12.6%
T&N Europe 1.4% 2.2% 6.2% 5.0%
T&N APMEA 9.7% 10.0% 12.3% 11.4%
T&N Europe 27%
T&N APMEA 20%

May 2018