Embed Size (px)
Citation preview

1
Determination of Work of Adhesion of biological cell under AFM bead
indentation
Xinyao Zhu, E. Siamantouras, K.K. Liu and X. Liu*
School of Engineering, University of Warwick, Coventry CV4 7AL, UK Corresponding author: Tel: +44(0)24 765 23136, Fax: Fax: +44(0)24 76 418922 Email: [email protected] Abstract Hertz contact theory has been widely used for the determination of cell elasticity based on AFM indentation experiments. In light of the adhesive contact between AFM tip and cell, this study applied Johnson-Kendall-Roberts (JKR) model to fit the indentation force-displacement (F-D) curves reported previously. A MIN6 cell has been modeled as first a sphere and then a flattened cell with different thicknesses. The results have shown that both basic JKR model and “generalized” JKR model can best describe the unloading force-displacement behaviors of the indentation curves. The Young’s modulus of the cell and the work of adhesion of the cell-indenter interface are obtained. In comparison to the Hertzian contact model, the JKR model provides obviously better fitting to the experimental results, indicating the adhesion is significant in the cell interaction. KEY WORDS: JKR model; AFM indentation; Young’s modulus; Work of adhesion 1. Introduction The atomic force microscope (AFM) is a powerful instrument for studying topographical and mechanical properties such as elastic modulus and viscoelasticity, and hardness of biological materials (Dulińskaa et al., 2006). The high resolution and reasonably fast speed of AFM measurements have made it possible to investigate the topography and mechanical properties of living biological cells or tissues (Ikai et al., 1997; Nowakowshi et al., 2001). Generally, AFM investigation of living cells or biological tissues can provide detailed information about topography of cytoplasm membrane and cellular mechanical properties. These topography and mechanical properties are reliable indicators of cellular physiological status because they are determined by cytoskeleton together with the cytoplasm membrane and numerous proteins (Lekka et al., 2001). Any change in cellular physiology may cause alternations in its topographical or mechanical behaviors. As a result, the correlations between cytoskeleton and its topographical and mechanical properties could lead to possible medical diagnosis of pathological cells by comparing these properties determined from AFM indentation with its normal counterpart. A pioneering example using AFM in medical diagnostics was reported by Zachee (Zachee et al., 1992) where changes in shape of red blood cells were observed in patients after splenectomy. Another typical example was given by Lekka (Lekka et al., 2001) to show that chitosan has more significant effect on stiffness of normal cells than cancer cells.
The adhesion between cells or micro-particles is interfacial property affected by combination of cyto-membrane and cytoskeleton. The adhesion, characterized as adhesion force, is mainly derived from van der Waals forces when two uncharged particles approach into contact. Thus, detection of variation in cell adhesion behavior may serve as alternative method for single-cell-based diagnostics. Therefore, since the adhesion between the cell membrane and the
2
micro-particle is crucial, a model that could accurately describe this process would be necessary for results interpretation.
At micro-nanometer level, the significance of adhesion force between two contacting bodies under gravitational force increases with reduction in body size, surface roughness and contact load (Cho and Park, 2004). As a result, adhesion forces are inevitably associated with performance in atomic force microscopy (AFM) indentation which in turn provides a method to quantitatively study cell adhesion (Alessandrini and Facci, 2005; Maciaszek et al., 2014). The work of adhesion (regarded as magnitude of energy needed per unit area for new surface) has been used to characterize cell adhesion (Sirghi et al., 2008).
In this study, we first consider the cell in a spherical shape, and have applied Johnson-Kendall-Roberts (JKR) model to fit the force-displacement curves obtained from AFM indentation experiments (Siamantouras et al, 2014a). Then we treat the cell as a layer with finite thickness to provide more realistic modeling. In this regard, a more “generalized” JKR model (Shull, 2002) is used to fit the force-displacement curves. We found that both models provide good agreement with experimental results of force-displacement curves. The “generalized” model has the potential to be implemented in various studies that are investigating malignant cells for the accurate detection of work adhesion in AFM indentation.
2. Methodology 2.1 Data preparation Atomic force microscopy was used as a force spectroscopy tool to record force-displacement (F-d) curves from living MIN6 cells. The cells were maintained in physiological temperature (37ºC) in all experiments. The protocol for the tissue culture has been described in details elsewhere (Hills et al., 2012). A tipless cantilever, from ArrowTM (TL1, Nanoworld AG, Switzerland) with force constant of 0.03N/m was used. Recording of F-d curves was conducted in liquid media (CO2 free DMEM). To perform single cell indentation experiments, a spherical microbead (11 μm in diameter) was manually attached on the cantilever and the spring constant was then determined to be 0.059 N/m by using the thermal noise method after attachment (Siamantouras et al., 2014b). The depth of indentation was calculated by subtracting the deflection of the cantilever from the displacement of the piezo-actuator for a given spring constant (JPK Data Processing, Berlin, Germany). The data used for testing the theoretical model were extracted from the recently reported AFM indentation experiments of pancreatic cells (Siamantouras et al., 2014a), in which Hertz contact model was applied to analyse F-d curves for calculating the Young's modulus (E) between two sets of data with different elasticity. In this paper, we have used MIN6 cells cultured for 48h with low glucose which are named as Sample A and cells cultured in 48h +R568 are named as Sample B (Siamantouras et al., 2014b).
2.2 Theoretical model A conventional method to determine cellular elastic modulus is to fit the force-displacement curve obtained from AFM indentation with Hertz contact model (Demichelis, et al., 2015). When an AFM indenter approaches a cell, the molecules (atoms) of the two surfaces interact mainly by Van Der Waals forces and hence the adhesion force is inevitable in cell-indenter interaction. This
3
adhesion force has been studied by many researchers (Zhang and Zhang, 2008, Sirghi et al., 2008, Maciaszek et al., 2014). Therefore, it is desirable to take cell adhesion into consideration for the determination of its mechanical properties in cell AFM indentation.
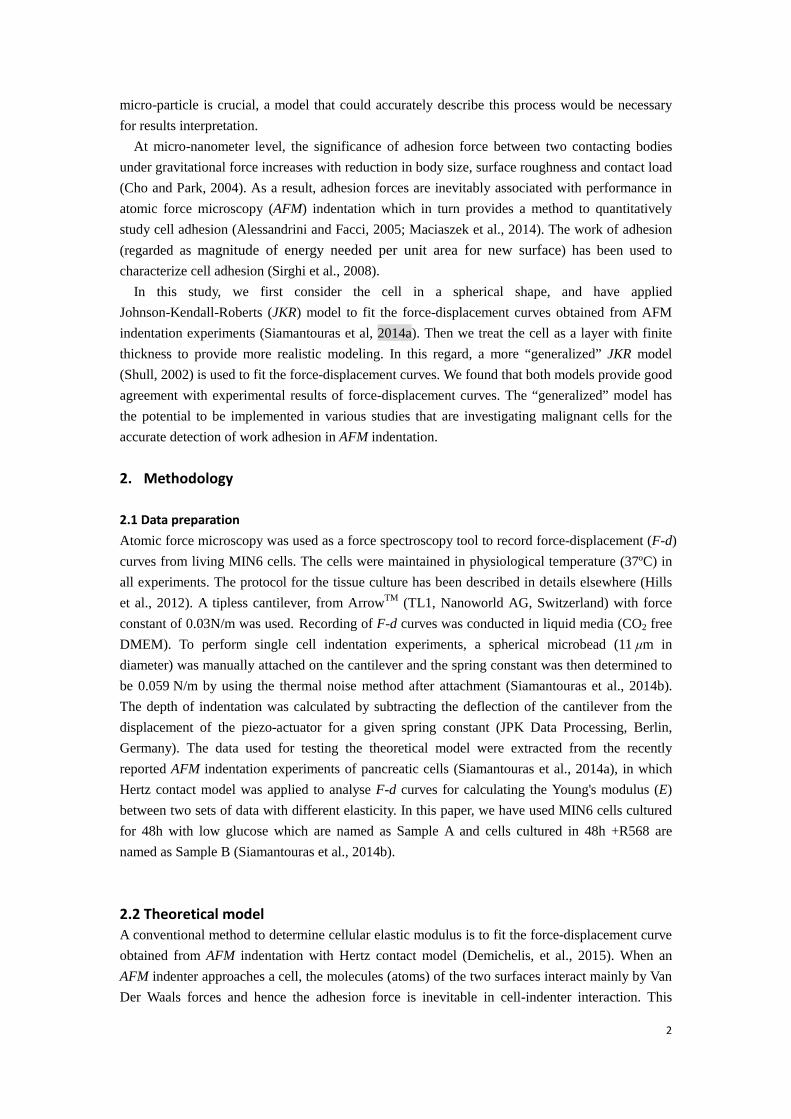
In general, the cells spread on substrate in various shapes, some like spheres and some like pancakes (Hills et al., 2012; Siamantouraset et al., 2014a). Therefore, we consider cells have either spherical or flattened shapes as shown in Fig. 1 (a, b), respectively.
(a)
(b)
Fig. 1 Schematic diagrams of the AFM bead tip in contact with cells of (a) spherical shape and (b) flattened shape.
In this study, the cell is firstly treated as homogeneous, incompressible and linear elastic sphere
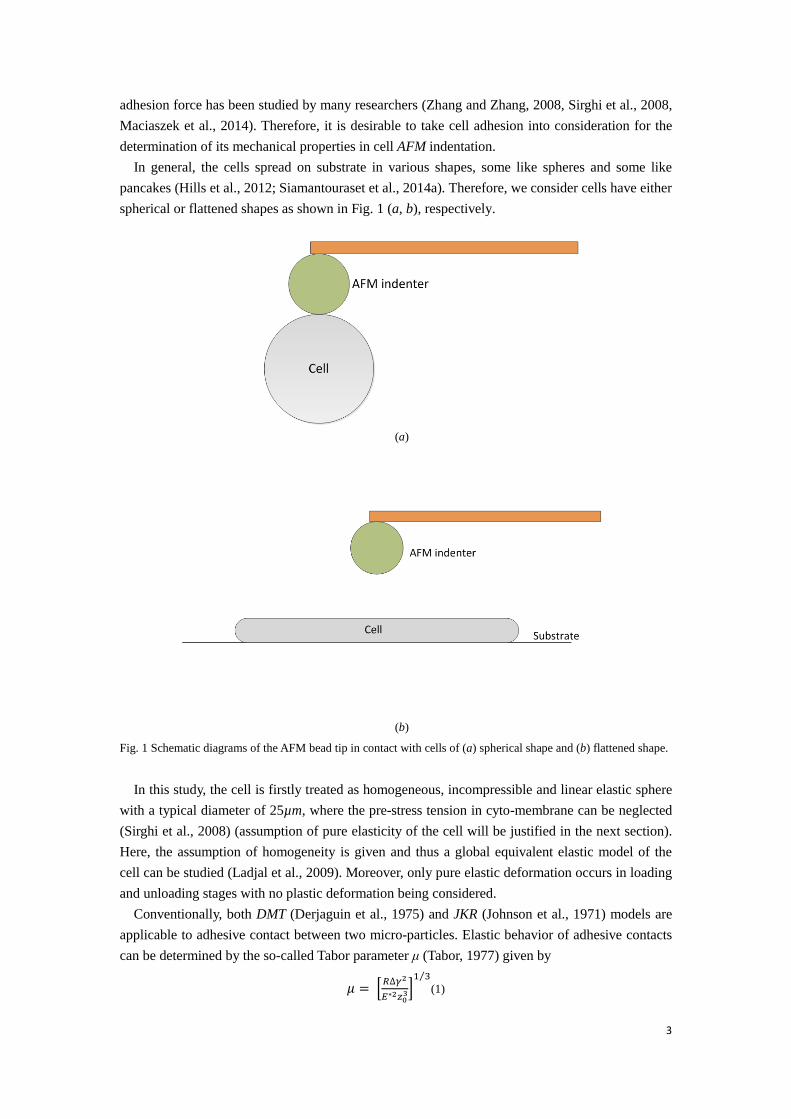
with a typical diameter of 25µm, where the pre-stress tension in cyto-membrane can be neglected (Sirghi et al., 2008) (assumption of pure elasticity of the cell will be justified in the next section). Here, the assumption of homogeneity is given and thus a global equivalent elastic model of the cell can be studied (Ladjal et al., 2009). Moreover, only pure elastic deformation occurs in loading and unloading stages with no plastic deformation being considered. Conventionally, both DMT (Derjaguin et al., 1975) and JKR (Johnson et al., 1971) models are applicable to adhesive contact between two micro-particles. Elastic behavior of adhesive contacts can be determined by the so-called Tabor parameter μ (Tabor, 1977) given by
𝜇 = �𝑅∆𝛾2
𝐸∗2𝑧03�1 3⁄
(1)
4
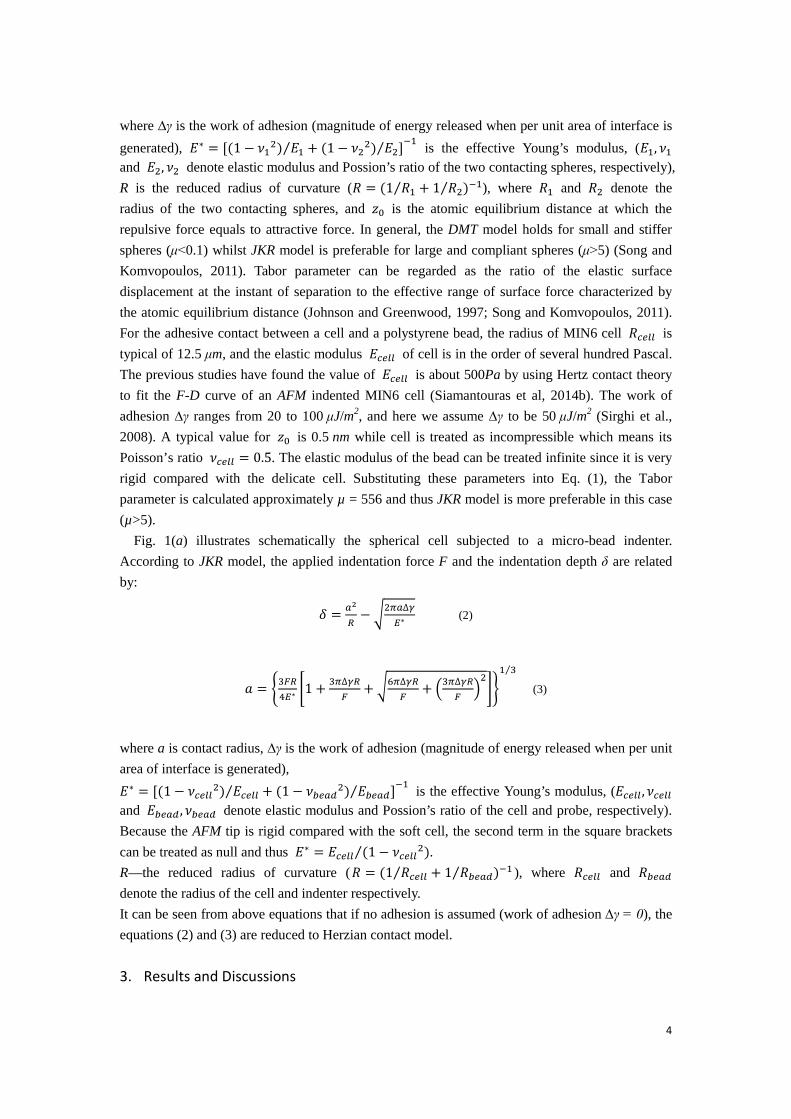
where ∆γ is the work of adhesion (magnitude of energy released when per unit area of interface is generated), 𝐸∗ = [(1− 𝜈12) 𝐸1 + (1− 𝜈22) 𝐸2]⁄⁄ −1 is the effective Young’s modulus, (𝐸1, 𝜈1 and 𝐸2, 𝜈2 denote elastic modulus and Possion’s ratio of the two contacting spheres, respectively), R is the reduced radius of curvature (𝑅 = (1 𝑅1 + 1 𝑅2⁄⁄ )−1), where 𝑅1 and 𝑅2 denote the radius of the two contacting spheres, and 𝑧0 is the atomic equilibrium distance at which the repulsive force equals to attractive force. In general, the DMT model holds for small and stiffer spheres (μ˂0.1) whilst JKR model is preferable for large and compliant spheres (μ˃5) (Song and Komvopoulos, 2011). Tabor parameter can be regarded as the ratio of the elastic surface displacement at the instant of separation to the effective range of surface force characterized by the atomic equilibrium distance (Johnson and Greenwood, 1997; Song and Komvopoulos, 2011). For the adhesive contact between a cell and a polystyrene bead, the radius of MIN6 cell 𝑅𝑐𝑐𝑐𝑐 is typical of 12.5 μm, and the elastic modulus 𝐸𝑐𝑐𝑐𝑐 of cell is in the order of several hundred Pascal. The previous studies have found the value of 𝐸𝑐𝑐𝑐𝑐 is about 500Pa by using Hertz contact theory to fit the F-D curve of an AFM indented MIN6 cell (Siamantouras et al, 2014b). The work of adhesion ∆γ ranges from 20 to 100 μJ/m2, and here we assume ∆γ to be 50 μJ/m2 (Sirghi et al., 2008). A typical value for 𝑧0 is 0.5 nm while cell is treated as incompressible which means its Poisson’s ratio 𝜈𝑐𝑐𝑐𝑐 = 0.5. The elastic modulus of the bead can be treated infinite since it is very rigid compared with the delicate cell. Substituting these parameters into Eq. (1), the Tabor parameter is calculated approximately µ = 556 and thus JKR model is more preferable in this case (µ>5).
Fig. 1(a) illustrates schematically the spherical cell subjected to a micro-bead indenter. According to JKR model, the applied indentation force F and the indentation depth δ are related by:
𝛿 = 𝑎2
𝑅− �2𝜋𝑎∆𝛾
𝐸∗ (2)
𝑎 = �3𝐹𝑅4𝐸∗
�1 + 3𝜋∆𝛾𝑅𝐹
+ �6𝜋∆𝛾𝑅𝐹
+ �3𝜋∆𝛾𝑅𝐹
�2��1 3⁄
(3)
where a is contact radius, ∆γ is the work of adhesion (magnitude of energy released when per unit area of interface is generated), 𝐸∗ = [(1− 𝜈𝑐𝑐𝑐𝑐2) 𝐸𝑐𝑐𝑐𝑐 + (1− 𝜈𝑏𝑐𝑎𝑏2) 𝐸𝑏𝑐𝑎𝑏]⁄⁄ −1 is the effective Young’s modulus, (𝐸𝑐𝑐𝑐𝑐 ,𝜈𝑐𝑐𝑐𝑐 and 𝐸𝑏𝑐𝑎𝑏 ,𝜈𝑏𝑐𝑎𝑏 denote elastic modulus and Possion’s ratio of the cell and probe, respectively). Because the AFM tip is rigid compared with the soft cell, the second term in the square brackets can be treated as null and thus 𝐸∗ = 𝐸𝑐𝑐𝑐𝑐 (1− 𝜈𝑐𝑐𝑐𝑐2)⁄ . R—the reduced radius of curvature (𝑅 = (1 𝑅𝑐𝑐𝑐𝑐 + 1 𝑅𝑏𝑐𝑎𝑏⁄⁄ )−1 ), where 𝑅𝑐𝑐𝑐𝑐 and 𝑅𝑏𝑐𝑎𝑏 denote the radius of the cell and indenter respectively. It can be seen from above equations that if no adhesion is assumed (work of adhesion ∆γ = 0), the equations (2) and (3) are reduced to Herzian contact model. 3. Results and Discussions
5
(a)
(b)
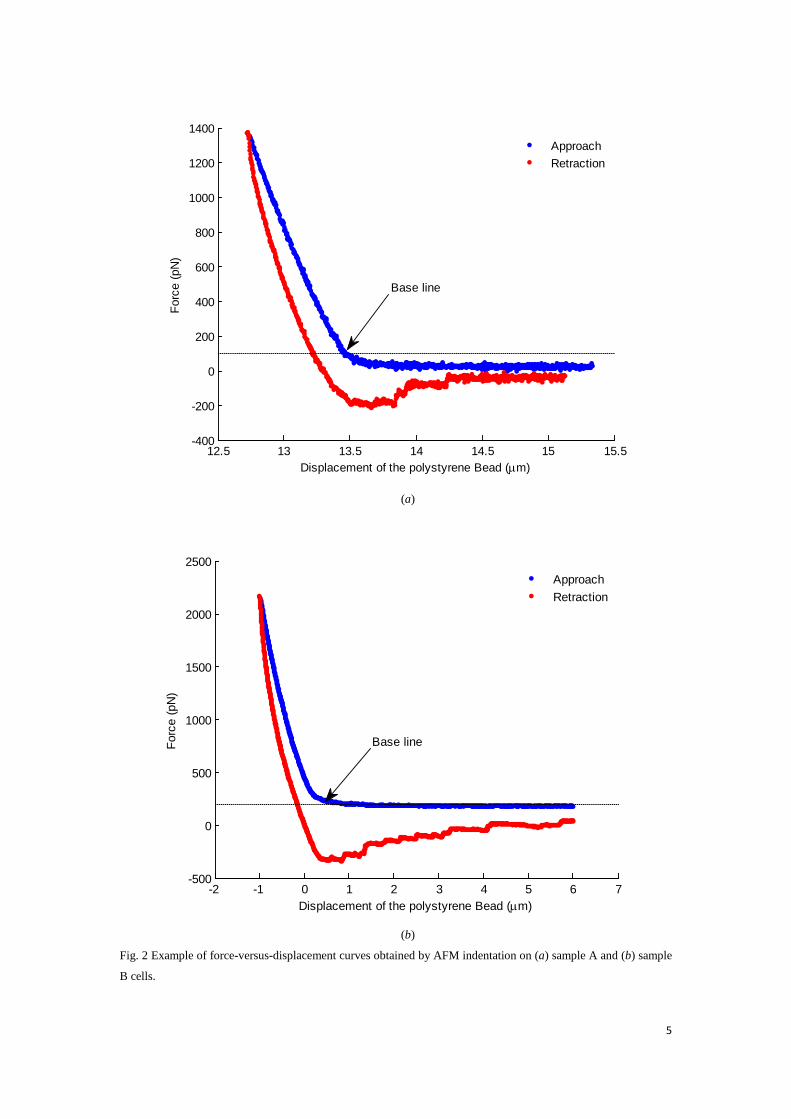
Fig. 2 Example of force-versus-displacement curves obtained by AFM indentation on (a) sample A and (b) sample
B cells.
12.5 13 13.5 14 14.5 15 15.5-400
-200
0
200
400
600
800
1000
1200
1400
Displacement of the polystyrene Bead (mm)
Forc
e (p
N)
ApproachRetraction
Base line
-2 -1 0 1 2 3 4 5 6 7-500
0
500
1000
1500
2000
2500
Displacement of the polystyrene Bead (mm)
Forc
e (p
N)
ApproachRetraction
Base line
6
Fig. 2 shows the result of force against displacement corresponding to MIN6 cells. The micro-bead was initially made contact to the cell with the applied force of 100 pN as the baseline. The maximum indentation depth of cell is approximately 0.7μm. Thus, the substrate effect is negligible since the indentation is smaller than 10% of the sample thickness (ISO14577-4; Dimitriadis et al., 2002; Jung et al., 2004).
3.1 Verification of Cellular Viscous Properties The enclosed area between the loading and unloading curves where force is positive (compressive force) reveals that the cell exhibits viscoelastic property, as shown in Fig. 2. The gap suggests the energy supplied by the tip is not fully recovered by the cell (while in an absolute elastic material it will be fully recovered), which confirms that living cells are viscoelastic (Alcaraz et al., 2003). The viscoelastic behavior is ascribed to intrinsic viscoelasticity of the cytoplasm (Koay et al., 2003). Viscous relaxation time is one typical time scale for characterizing this viscoelastic behavior which causes difference in force indentation measurements if different indentation velocities are applied (Li et al., 2008; Rosenbluth et al., 2006). The influence of viscosity effect on cell indentation can be reduced or even neglected if an indentation is performed in a time that is much longer than the force relaxation time of the cell (A-Hassan et al., 1998). Therefore, before fitting JKR model to the experimental data, the viscous relaxation time of the cell-AFM indentation system has to be estimated and then the evaluated viscous relaxation time can be compared with the characteristic time of indentation (loading time). In general, elastic properties are derived from the unloading curve as the unloading process is of purely elastic nature. As we assume there is no plastic deformation occurs in the cell indentation, thus the energy loss is considered due to viscoelastic properties. Viscoelastic Hertz contact model can be fitted to the loading part of the F-d curve to determine the viscous relaxation time. According to Hertz model (Hertz, 1882), if the cell is regarded as pure elastic, the dependence of indentation force (F) on indentation depth (δ) is expressed as:
𝐹 = 4√𝑅3(1−𝜈2)𝐸𝛿
3 2⁄ (4)
where E, ν denote the Young’s modulus and Poisson’s ratio of the cell respectively. For its viscoelastic counterpart, both Radok (Lee and Radok, 1960) and Ting (Ting, 1966) offered a general solution to linear viscoelastic Boussinesq problem provided the contact radius is non-decreasing as mutual approach increases. According to their theory, substituting the elastic modulus in the Hertz contact model with the modulus-displacement convolution in the time domain leads to the relationship between the indentation depth and the applied force as (Yu et al., 2013):
𝐹(𝑡) = 4√𝑅3(1−𝜈2)𝐸(𝑡) ∗ [𝛿(𝑡)]3 2⁄ (5)
where E(t) is the relaxed modulus, and
𝐸(𝑡) ∗ [𝛿(𝑡)]3 2⁄ = ∫ 𝐸(𝑡 − 𝜉) 𝑏𝑏𝑑
𝑡𝑑=0− [𝛿(𝜉)]3 2⁄ 𝑑𝜉 (6)
In our indentation experiment, because the bead approached and detached the cell in a constant speed, the indentation depth can be described as:
𝛿 = 𝑣𝑡 (7) where v denotes the constant speed. In order to determine the viscoelastic response for this
7
indentation system, Eq. (5) is transformed into the Laplace domain and solved for stress/strain ratios:
𝐹(𝑠) = 4√𝑅3(1−𝜈2)
𝐸(𝑠) · 𝛿(𝑠)3 2⁄ (8)
where 𝐹(𝑠) = ∫ 𝐹(𝑡)𝑒−𝑠𝑡𝑑𝑡,∞0 𝐸(𝑠) = ∫ 𝐸(𝑡)𝑒−𝑠𝑡𝑑𝑡,∞
0 and 𝛿(𝑠)3 2⁄ = ∫ [𝛿(𝑡)]3 2⁄ 𝑒−𝑠𝑡∞0 𝑑𝑡
Substitution of Eq. (8) with Eq. (7) yields:
𝐹(𝑠) = 4√𝑅𝑣3 2⁄
3(1−𝜈2)𝐸(𝑠) · 𝛤(5 2⁄ )
𝑠5 2⁄ (9)
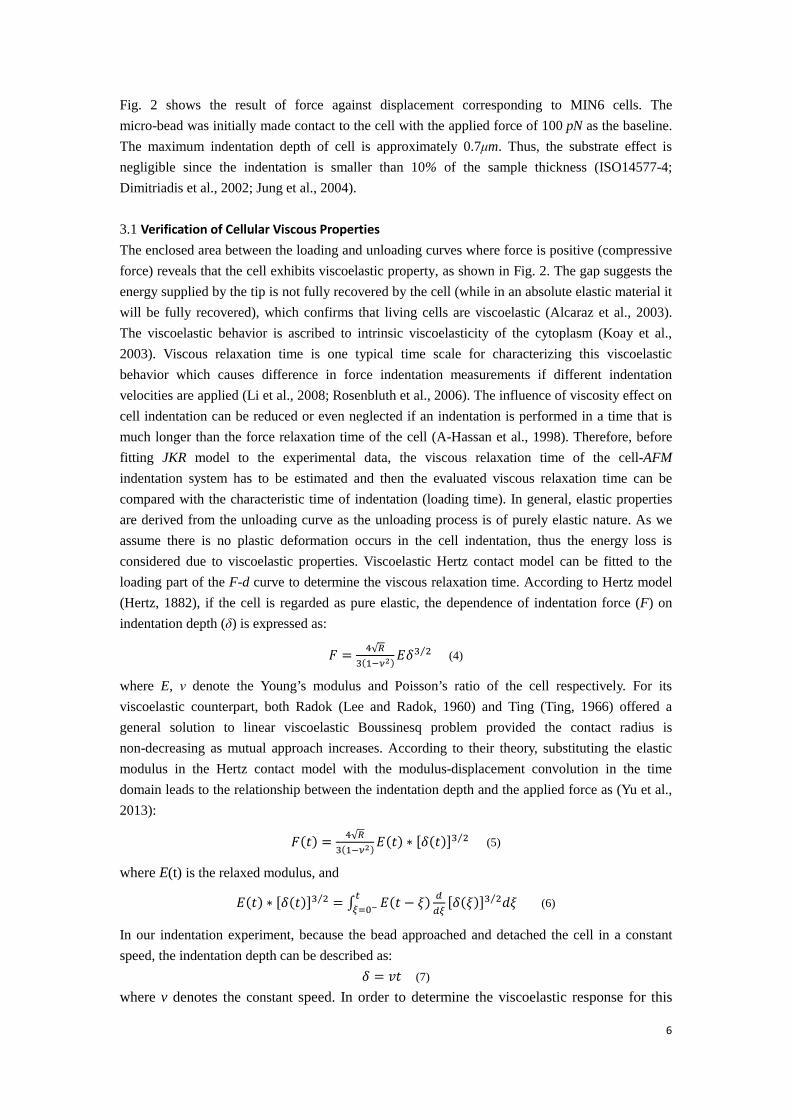
Where Γ(•) is gamma function. In this study we applied a Kelvin model to describe the viscoelasticity of MIN6 cells shown in Fig. 3. Here E denotes the Young’s modulus and η is the viscosity coefficient.
Fig. 3 Schematic diagram of Kelvin model where a dashpot is in parallel with a spring undergoing the same
deformation.
Thus, the constitutive relationship for the cell is:
𝜎 = 𝐸𝐸 + 𝜂 𝑏𝑏𝑡𝐸 (10)
where σ and ε denote stress and strain for any point within the cell. Transforming Eq. (10) into its Laplace domain yields:
𝜎(𝑠)𝜀(𝑠)
= (𝐸 + 𝜂𝑠) (11)
where 𝜎(𝑠) = ∫ 𝜎(𝑡)𝑒−𝑠𝑡𝑑𝑡∞0 , 𝐸(𝑠) = ∫ 𝐸(𝑡)𝑒−𝑠𝑡𝑑𝑡∞
0 .
According to the correspondence principle (Lee and Radok, 1960), the general elastic and viscoelastic solutions can be combined in the Laplace domain to obtain an equation describing the modulus of Young’s modulus:
𝐸(𝑠)������ = 𝜎(𝑠)𝜀(𝑠)
= (𝐸 + 𝜂𝑠) (12)
Substituting of Eq. (9) with Eq. (12), and transforming the Laplace form back into its time domain, yielding:
𝐹(𝑡) = 4√𝑅𝐸𝑣3 2⁄
3(1−𝜈) �𝑡3 2⁄ + 32𝜏𝑡1 2⁄ � (13)
where τ = η/E is the relaxation time. It should be born in mind that Kelvin model is just one special circumstance of three-element
solid and the estimated viscous relaxation time should coincide in order with its Kelvin counterpart if the loading curve is fitted by a more universal three-element model. However, since
8
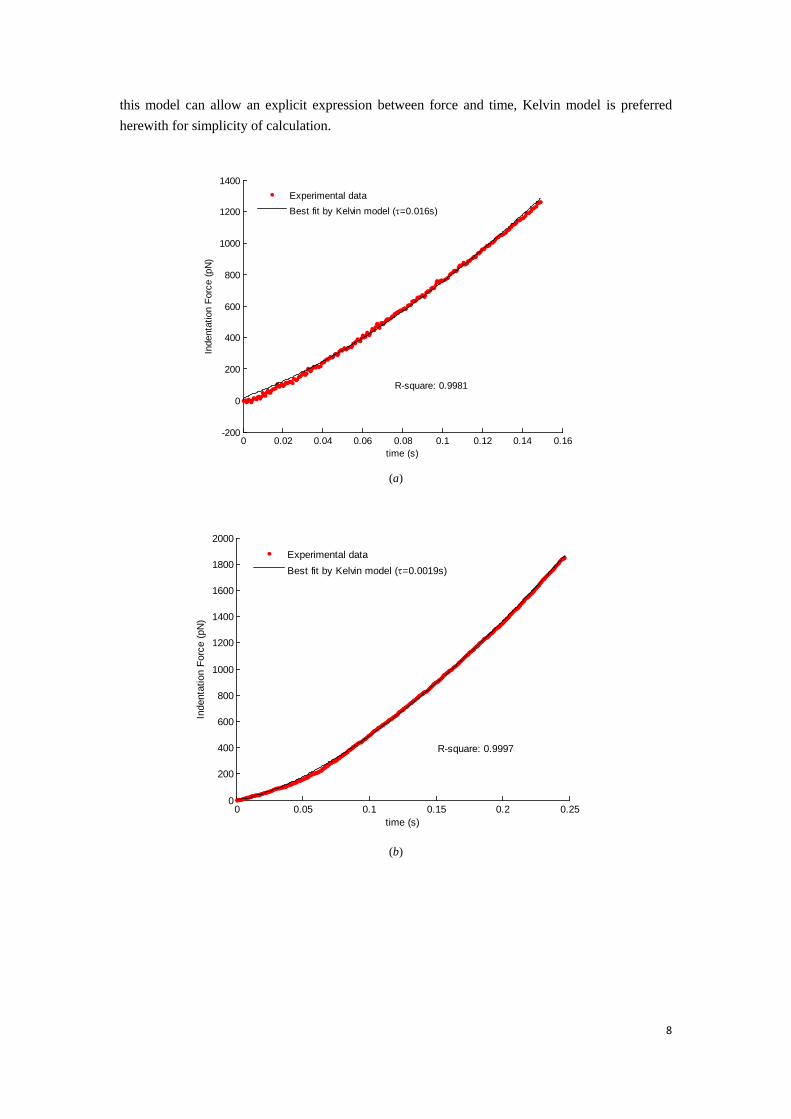
this model can allow an explicit expression between force and time, Kelvin model is preferred herewith for simplicity of calculation.
(a)
(b)
0 0.02 0.04 0.06 0.08 0.1 0.12 0.14 0.16-200
0
200
400
600
800
1000
1200
1400
time (s)
Inde
ntat
ion
Forc
e (p
N)
Experimental dataBest fit by Kelvin model (τ=0.016s)
R-square: 0.9981
0 0.05 0.1 0.15 0.2 0.250
200
400
600
800
1000
1200
1400
1600
1800
2000
time (s)
Inde
ntat
ion
Forc
e (p
N)
Experimental dataBest fit by Kelvin model (τ=0.0019s)
R-square: 0.9997

9
(c)
Fig. 4 Typical force-versus-time curves during loading part and the best fitting curves by using Kelvin model for (a)
sample A and (b) sample B. (c) Viscous relaxation time of the two type cells. The data are presented as average
values with standard deviations.
Fig. 4(a) and (b) show the force-time curves obtained from the loading part and their best fitting curves by Kelvin model corresponding to MIN6 cells. The determined viscous relaxation time of MIN6 cells is shown in Fig. 4(c). The average value of viscous relaxation time of sample A is 0.0125 sec which is less than one tenth of loading time as seen in Fig. 4(a), and for sample B, the value is 0.0043 sec which is almost 1/60 of the loading time as shown in Fig. 4(b). As a result, the influence of viscoelasticity can be excluded if the MIN6 cell is treated as pure elastic.
3.2 Fitting results by using JKR model of bead on spherical cell Fig 5 (a, b) present typical results of the force-displacement curves obtained by AFM indentation and the best fitting curves by using JKR model for the retraction part of MIN6 cells. During the loading stage (as illustrated in blue lines in Fig. 5), the sensed reaction force is dominated initially by the stiffness of the AFM cantilever and then by the stiffness of the measured cell. For the unloading process, as show in red lines in Fig. 5, the indentation force decreases to a negative region which represents adhesive forces between the cell and the indenter. The adhesion force is characterized as a short-range force and will not significantly affect the force-displacement curve during the loading stage. Before the contact breaks, the short-range adhesion force start to show the effect, and thus the adhesion force is characterized as pull-force (the negative force region in Fig. 5(a, b)) which is needed to overcome the adhesion force during indenter retraction. Consequently, only the retraction stage, as shown in red lines in Fig. 5(a, b), can be used to
Sample A Sample B0
0.002
0.004
0.006
0.008
0.01
0.012
0.014
0.016
0.018
0.02
Cell Type
visc
ous
rela
xatio
n tim
e (S
ec)
10
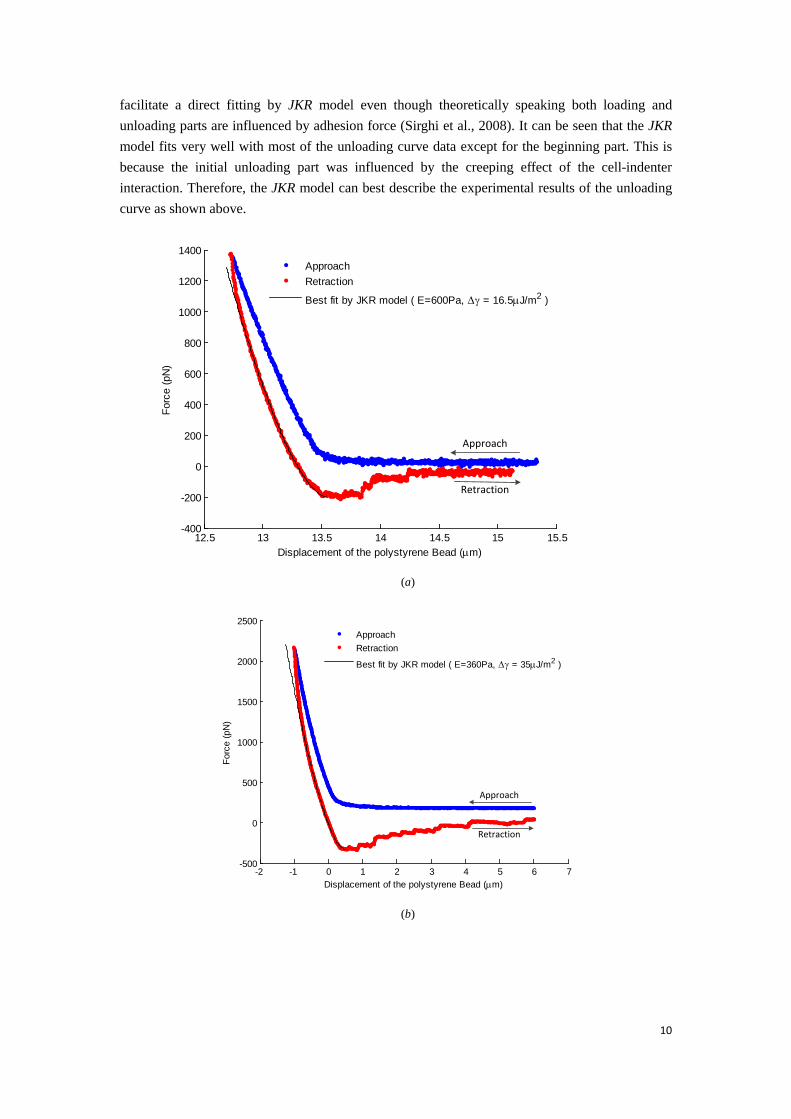
facilitate a direct fitting by JKR model even though theoretically speaking both loading and unloading parts are influenced by adhesion force (Sirghi et al., 2008). It can be seen that the JKR model fits very well with most of the unloading curve data except for the beginning part. This is because the initial unloading part was influenced by the creeping effect of the cell-indenter interaction. Therefore, the JKR model can best describe the experimental results of the unloading curve as shown above.
12.5 13 13.5 14 14.5 15 15.5-400
-200
0
200
400
600
800
1000
1200
1400
Displacement of the polystyrene Bead (mm)
Forc
e (p
N)
ApproachRetraction
Best fit by JKR model ( E=600Pa, Dγ = 16.5mJ/m2 )
Approach
Retraction
(a)
-2 -1 0 1 2 3 4 5 6 7-500
0
500
1000
1500
2000
2500
Displacement of the polystyrene Bead (mm)
Forc
e (p
N)
ApproachRetraction
Best fit by JKR model ( E=360Pa, Dγ = 35mJ/m2 )
Approach
Retraction
(b)
11
(c)
(d)
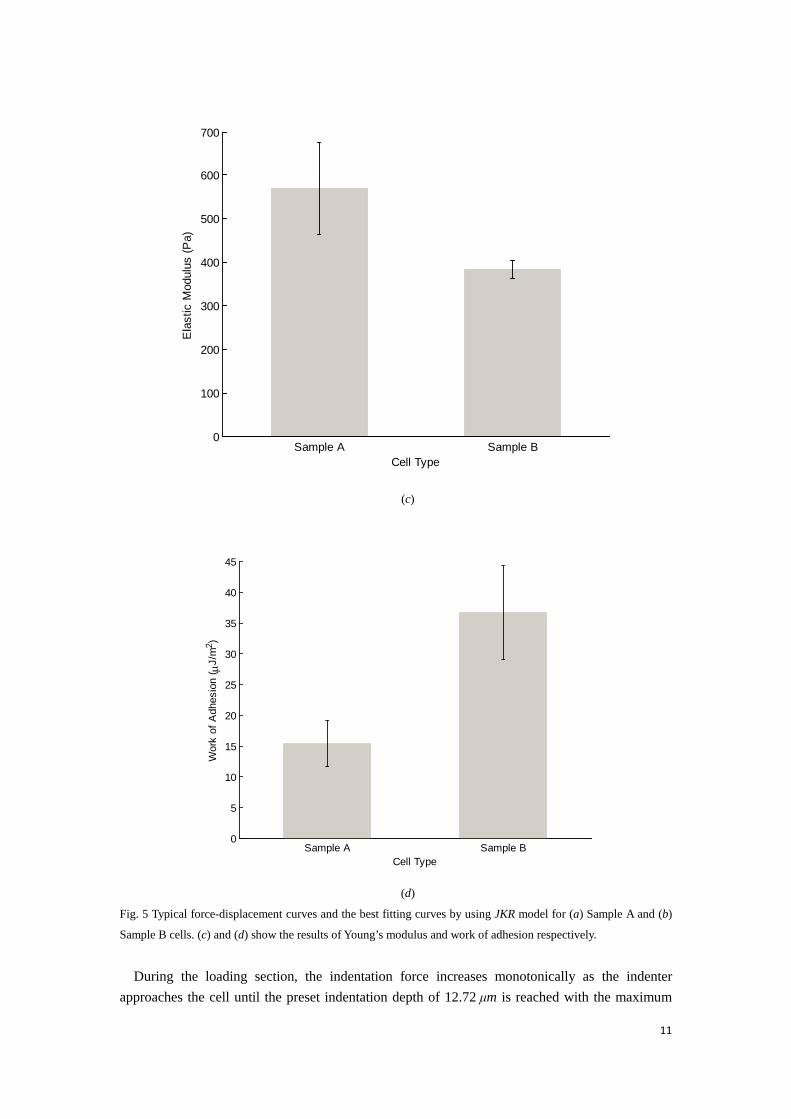
Fig. 5 Typical force-displacement curves and the best fitting curves by using JKR model for (a) Sample A and (b)
Sample B cells. (c) and (d) show the results of Young’s modulus and work of adhesion respectively.
During the loading section, the indentation force increases monotonically as the indenter approaches the cell until the preset indentation depth of 12.72 μm is reached with the maximum
Sample A Sample B0
100
200
300
400
500
600
700
Cell Type
Ela
stic
Mod
ulus
(Pa)
Sample A Sample B0
5
10
15
20
25
30
35
40
45
Cell Type
Wor
k of
Adh
esio
n ( m
J/m
2 )
12
force of 1357 pN. Afterwards, the force decreases monotonically to zero and then becomes negative as the indenter retracts. The force decreases and then bottoms at its minimum value implying the bead begins to detach the cell. A further retraction of the probe suggests the indentation force begins to yield accompanying with some sudden abrupt decrease of adhesion force as shown in Fig. 5(a, b). This jump-off phenomenon is very commonly observed in some cell AFM indentation experiments. In practice this part of the retraction curve is difficult to model and many efforts have been made previously. Pethica (Pethica and Sutton, 1988) simulated the instability in the process of contact between probe and substrate by using molecular dynamics (Lennard-Jones potential) and concluded the jump-off instability is universally ascribed to the fact that both the probe and substrate materials are prone to maintain their respective cohesive force and optimize their respective embedded energy. Sirghi (Sirghi et al., 2008) observed this jump-off instability in their mouse fibroblast AFM indentation experiments and attributed this sudden decrease of adhesion force to discontinuous decrease of tip-cell membrane contact area. Fitting JKR model to this abrupt force variation will cause errors in determination of the work of adhesion and thus this abrupt discontinuous part after maximum adhesion force has been discarded during fitting. Fig. 5(c, d) show the fitting results of extracted Young’s modulus and work of adhesion from 24 of sample A and 3 of sample B force-displacement curves by using JKR model of bead on spherical cell. Fig. 5(c) shows the average elastic modulus for sample A cells is 380Pa, and sample B is 570Pa, whilst the average work of adhesion is 36.7μJ/m2for sample A and 15.4μJ/m2 for sample B, as shown in Fig. 5(d). It is worth noting that the determined work of adhesion coincides with the previously reported values (Sirghi et al., 2008) in the same order of magnitude.
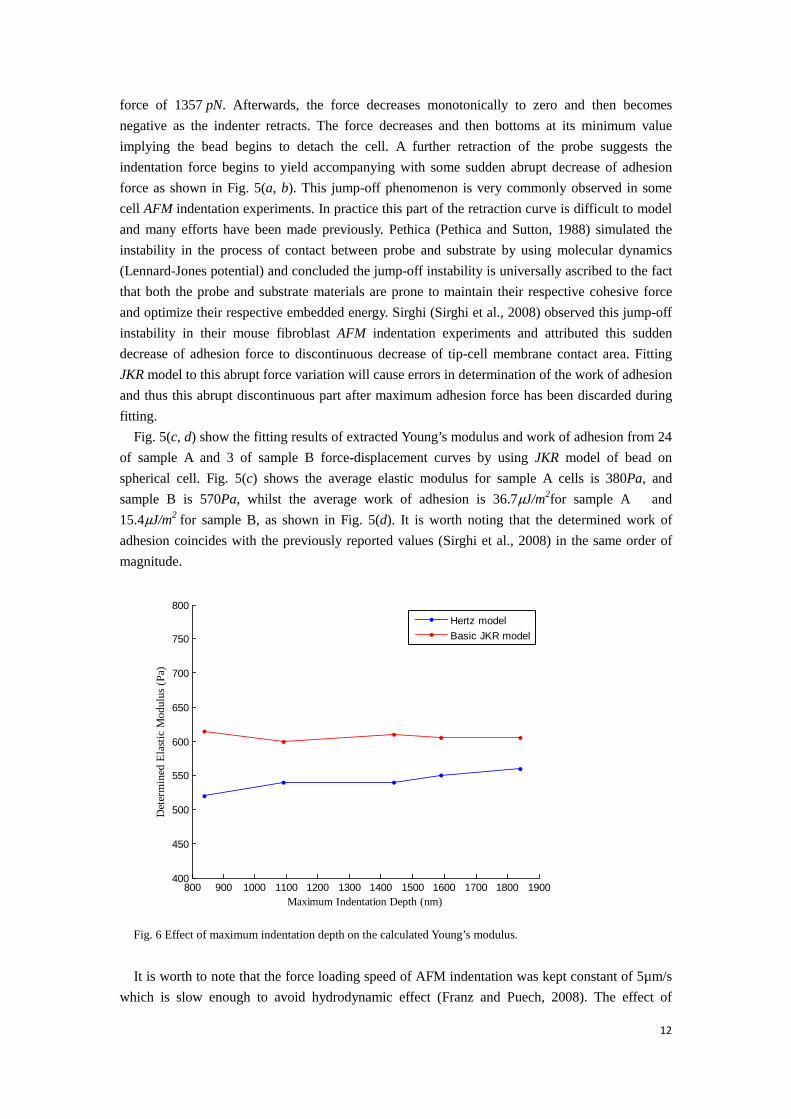
Fig. 6 Effect of maximum indentation depth on the calculated Young’s modulus.
It is worth to note that the force loading speed of AFM indentation was kept constant of 5µm/s
which is slow enough to avoid hydrodynamic effect (Franz and Puech, 2008). The effect of
800 900 1000 1100 1200 1300 1400 1500 1600 1700 1800 1900400
450
500
550
600
650
700
750
800
Maximum Indentation Depth (nm)
Det
erm
ined
Ela
stic
Mod
ulus
(Pa)
Hertz modelBasic JKR model
13
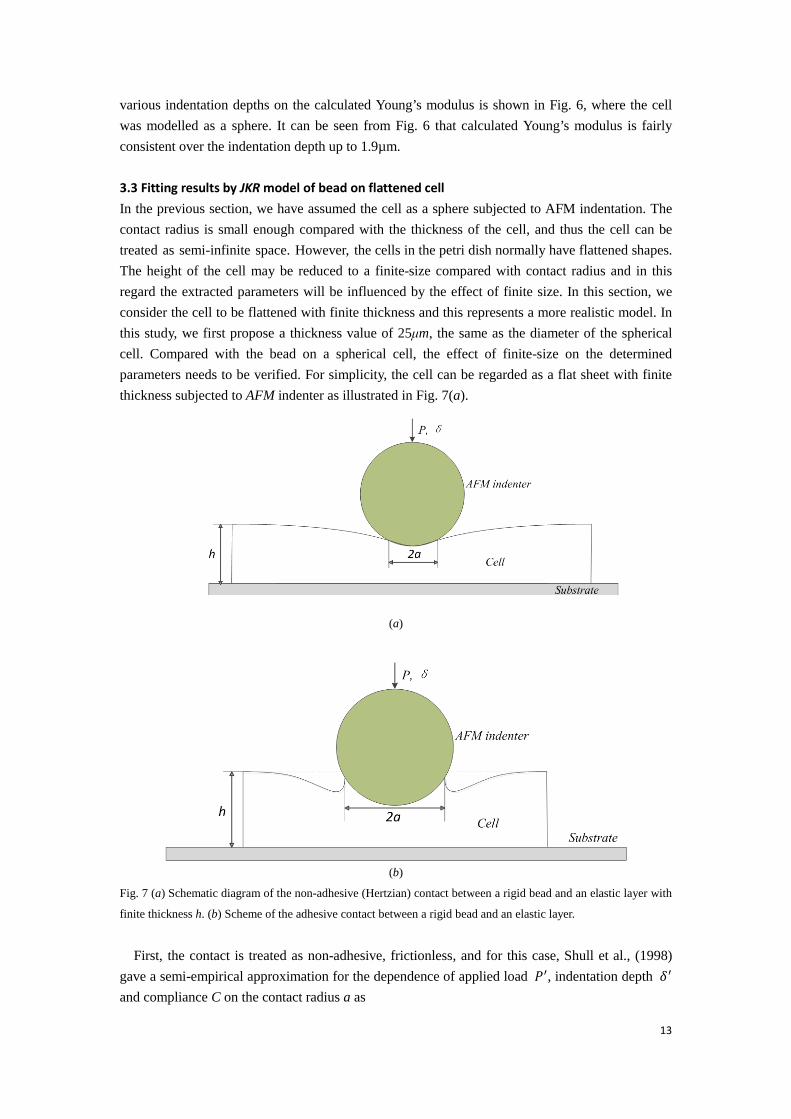
various indentation depths on the calculated Young’s modulus is shown in Fig. 6, where the cell was modelled as a sphere. It can be seen from Fig. 6 that calculated Young’s modulus is fairly consistent over the indentation depth up to 1.9µm. 3.3 Fitting results by JKR model of bead on flattened cell In the previous section, we have assumed the cell as a sphere subjected to AFM indentation. The contact radius is small enough compared with the thickness of the cell, and thus the cell can be treated as semi-infinite space. However, the cells in the petri dish normally have flattened shapes. The height of the cell may be reduced to a finite-size compared with contact radius and in this regard the extracted parameters will be influenced by the effect of finite size. In this section, we consider the cell to be flattened with finite thickness and this represents a more realistic model. In this study, we first propose a thickness value of 25μm, the same as the diameter of the spherical cell. Compared with the bead on a spherical cell, the effect of finite-size on the determined parameters needs to be verified. For simplicity, the cell can be regarded as a flat sheet with finite thickness subjected to AFM indenter as illustrated in Fig. 7(a).
(a)
(b)
Fig. 7 (a) Schematic diagram of the non-adhesive (Hertzian) contact between a rigid bead and an elastic layer with
finite thickness h. (b) Scheme of the adhesive contact between a rigid bead and an elastic layer.
First, the contact is treated as non-adhesive, frictionless, and for this case, Shull et al., (1998) gave a semi-empirical approximation for the dependence of applied load 𝑃′, indentation depth 𝛿′ and compliance C on the contact radius a as
14
𝑃′ = 𝑃ℎ(𝑎)𝑓𝑝 �𝑎ℎ� , 𝑓𝑝 �
𝑎ℎ� = 1 + 𝛽(𝑎
ℎ)3 (14)
𝛿′ = 𝛿ℎ(𝑎)𝑓𝛿 �𝑎ℎ� , 𝑓𝛿 �
𝑎ℎ� = 0.4 + 0.6𝑒(−1.8𝑎
ℎ ) (15)
𝐶 = 𝐶ℎ(𝑎)𝑓𝑐 �𝑎ℎ� , 𝑓𝑐−1 �
𝑎ℎ� = 1 + [ 0.75
(𝑎 ℎ⁄ )+(𝑎 ℎ⁄ )3+ 2.8(1−2𝜈)
(𝑎 ℎ⁄ )]−1 (16)
where 𝑃ℎ and 𝛿ℎ are the externally applied load and indentation depth respectively corresponding to a contact radius a in Hertzian contact model. 𝐶ℎ is the compliance of Hertz contact model with a contact radius a.
𝑃ℎ(𝑎) = 4𝐸𝑎3
3(1−𝜈2)𝑅 (17)
𝛿ℎ(𝑎) = 𝑎2 𝑅⁄ (18)
𝐶ℎ(𝑎) = 12𝑎𝐸∗
(19)
where β = 0.15 for the frictionless case, and β = 0.33 for the full-friction case. 𝑓𝑝(⋅) and 𝑓𝛿(⋅) are geometric factors which mediate the effect of thickness. From Eq. (14) and (15), it is shown that 𝑃′ and 𝛿′ will reduce to 𝑃ℎ and 𝛿ℎ when h˃˃a. Second, by analogy to the derivation of JKR model, Shull (Shull, 2002) developed the “generalized” JKR model to describe the adhesive contact between a rigid indenter and a flat sheet with finite thickness as shown in Fig. 7(b). In this “generalized” model, the expressions for the energy release rate ℊ is extended to the adhesion of relatively thin layers by using the approximation of compliance given by Eq. (16). Simple expressions are only available for incompressible materials with ν = 0.5 as
ℊ = (𝑃′−𝑃)2
8𝜋𝐸∗𝑎3𝑓𝐺𝑝 �
𝑎ℎ� , 𝑓𝐺𝑝 �
𝑎ℎ� = 0.56+1.5(𝑎 ℎ⁄ )+3(𝑎 ℎ⁄ )3
[0.75+(𝑎 ℎ⁄ )+(𝑎 ℎ⁄ )3]2 (20)
ℊ = 𝐸∗(𝛿′−𝛿)2
2𝜋𝑎𝑓𝐺𝛿 �
𝑎ℎ� ,𝑓𝐺𝛿 �
𝑎ℎ� = 1 + 2.67 �𝑎
ℎ� + 5.33 �𝑎
ℎ�3 (21)
where 𝑃′ and 𝛿′ are the applied load and indentation depth corresponding to contact radius a as given by Eq. (14) and (15) when adhesion is absent. 𝑓𝐺𝑝(∙) and 𝑓𝐺𝛿(∙) are also geometric correction factors. By letting ℊ = ∆γ, equilibrium is reached and thus the externally applied load P and indentation depth δ are related by the contact radius a by transforming Eq. (20) and (21) into
𝑃 = 𝑃′ − �8𝜋𝐸∗𝑎3∆𝛾𝑓𝐺𝑝−1(𝑎ℎ
) (22)
𝛿 = 𝛿′ − �2𝜋𝑎∆𝛾𝐸∗
𝑓𝐺𝛿−1(𝑎ℎ
) (23)
where P and δ are the indentation force and depth respectively in flattened cell indentation.
15
-7 -6.8 -6.6 -6.4 -6.2 -6 -5.8 -5.6 -5.4 -5.2 -5-400
-200
0
200
400
600
800
1000
1200
1400
Displacement of the polystyrene Bead (mm)
Forc
e (p
N)
ApproachRetraction
Best fit by generalized JKR model (E = 350Pa, Dγ = 8.5mJ/m2)
Approach
Retraction
(a)
-1 0 1 2 3 4 5 6 7
-500
0
500
1000
1500
2000
2500
Displacement of the polystyrene Bead (mm)
Forc
e (p
N)
ApproachRetraction
Best fit by generalized JKR model (E = 275Pa, Dγ = 24.65mJ/m2)
Approach
Retraction
(b)
16
(c)
(d)
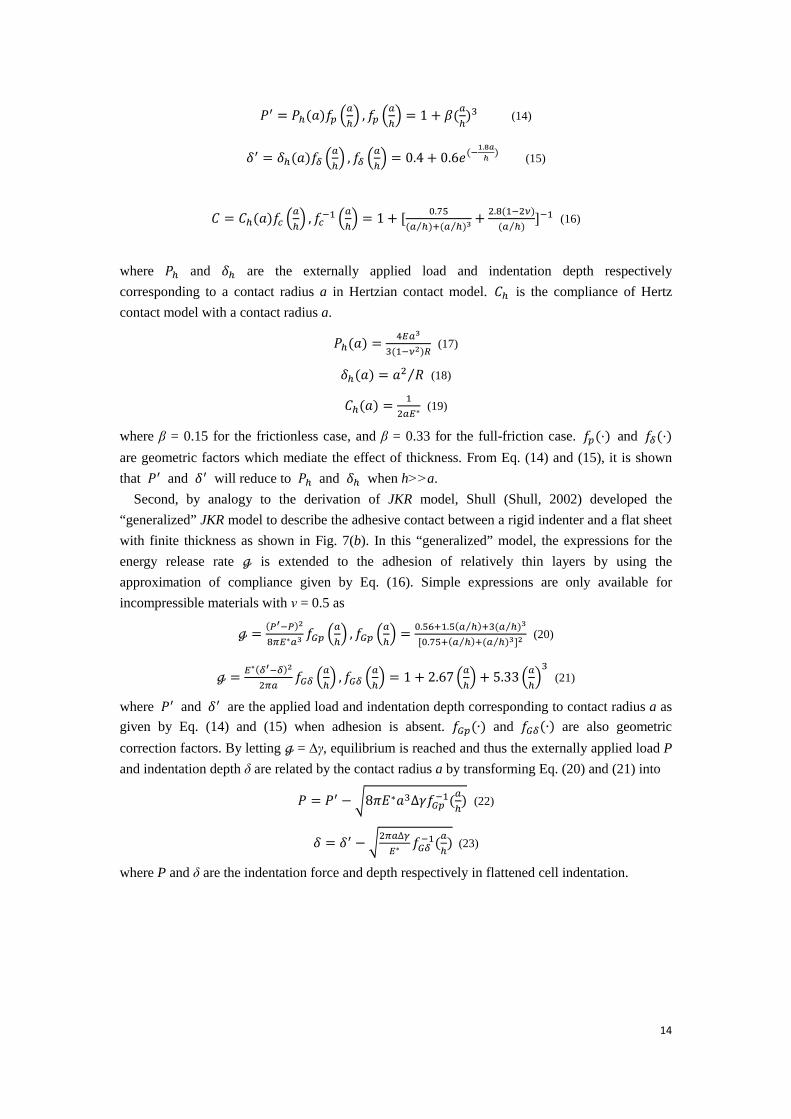
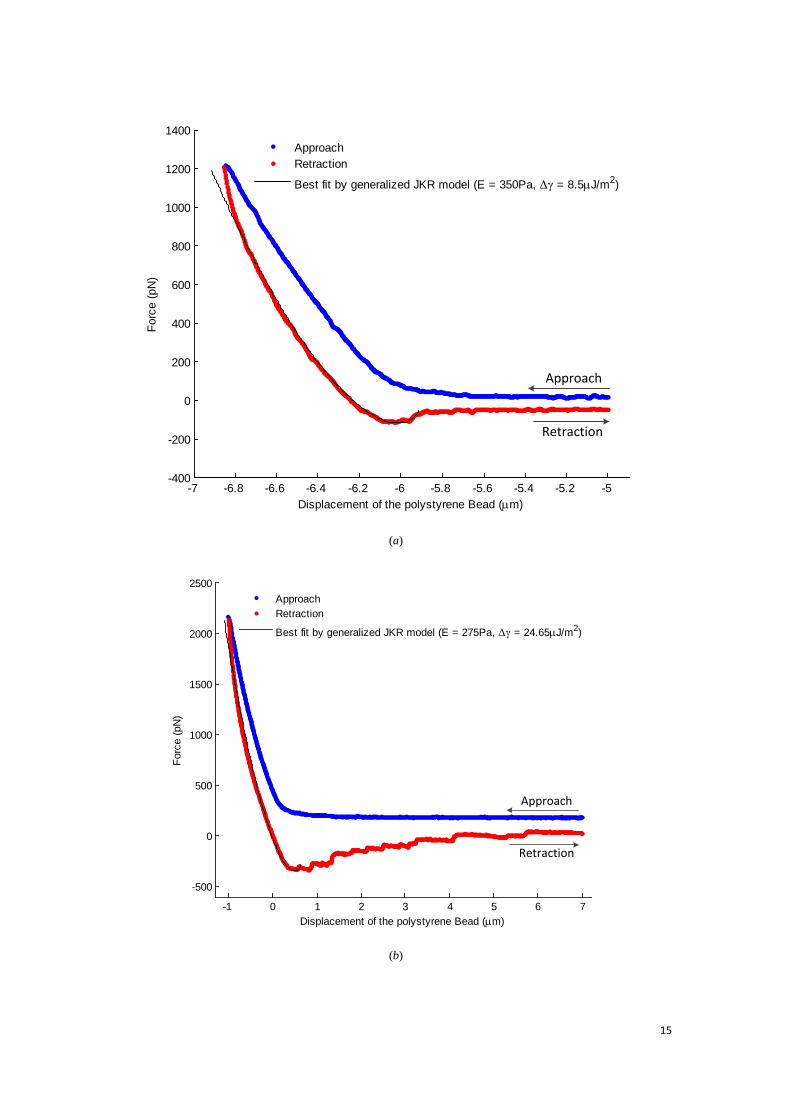
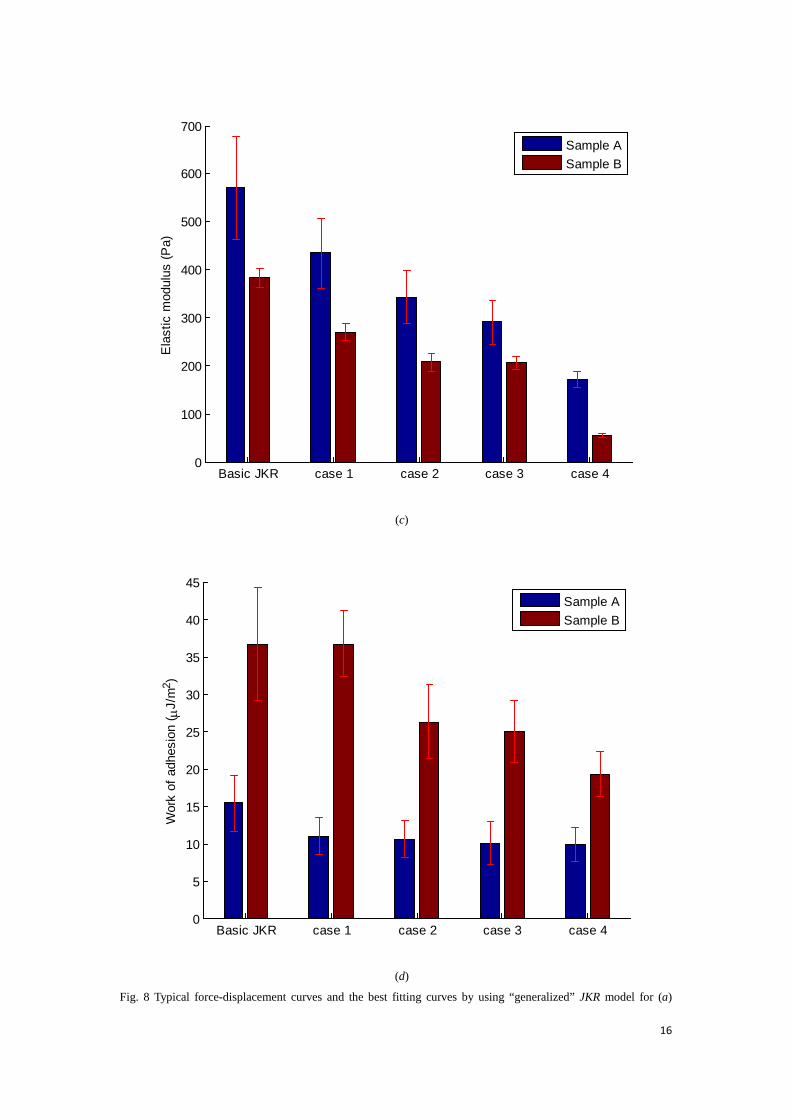
Fig. 8 Typical force-displacement curves and the best fitting curves by using “generalized” JKR model for (a)
Basic JKR case 1 case 2 case 3 case 40
100
200
300
400
500
600
700
Ela
stic
mod
ulus
(Pa)
Sample ASample B
Basic JKR case 1 case 2 case 3 case 40
5
10
15
20
25
30
35
40
45
Wor
k of
adh
esio
n ( m
J/m
2 )
Sample ASample B
17
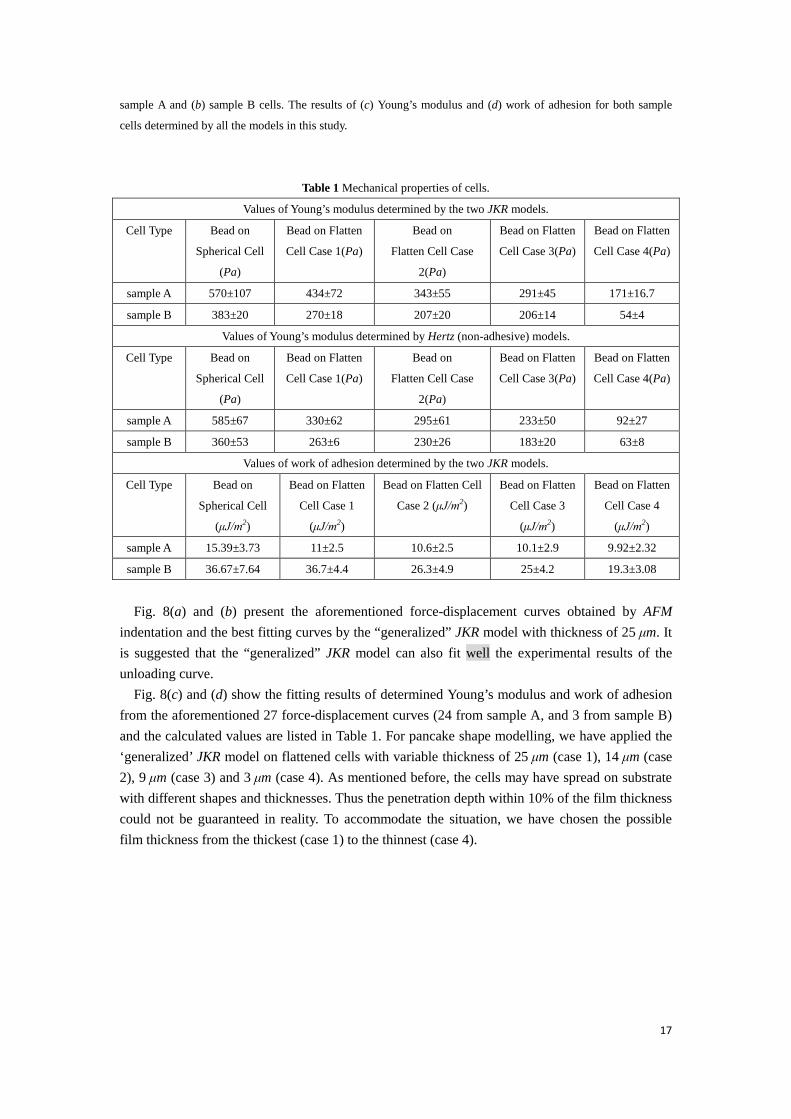
sample A and (b) sample B cells. The results of (c) Young’s modulus and (d) work of adhesion for both sample
cells determined by all the models in this study.
Table 1 Mechanical properties of cells.
Values of Young’s modulus determined by the two JKR models.
Cell Type Bead on
Spherical Cell
(Pa)
Bead on Flatten
Cell Case 1(Pa)
Bead on
Flatten Cell Case
2(Pa)
Bead on Flatten
Cell Case 3(Pa)
Bead on Flatten
Cell Case 4(Pa)
sample A 570±107 434±72 343±55 291±45 171±16.7
sample B 383±20 270±18 207±20 206±14 54±4
Values of Young’s modulus determined by Hertz (non-adhesive) models.
Cell Type Bead on
Spherical Cell
(Pa)
Bead on Flatten
Cell Case 1(Pa)
Bead on
Flatten Cell Case
2(Pa)
Bead on Flatten
Cell Case 3(Pa)
Bead on Flatten
Cell Case 4(Pa)
sample A 585±67 330±62 295±61 233±50 92±27
sample B 360±53 263±6 230±26 183±20 63±8
Values of work of adhesion determined by the two JKR models.
Cell Type Bead on
Spherical Cell
(μJ/m2)
Bead on Flatten
Cell Case 1
(μJ/m2)
Bead on Flatten Cell
Case 2 (μJ/m2)
Bead on Flatten
Cell Case 3
(μJ/m2)
Bead on Flatten
Cell Case 4
(μJ/m2)
sample A 15.39±3.73 11±2.5 10.6±2.5 10.1±2.9 9.92±2.32
sample B 36.67±7.64 36.7±4.4 26.3±4.9 25±4.2 19.3±3.08
Fig. 8(a) and (b) present the aforementioned force-displacement curves obtained by AFM
indentation and the best fitting curves by the “generalized” JKR model with thickness of 25 μm. It is suggested that the “generalized” JKR model can also fit well the experimental results of the unloading curve.
Fig. 8(c) and (d) show the fitting results of determined Young’s modulus and work of adhesion from the aforementioned 27 force-displacement curves (24 from sample A, and 3 from sample B) and the calculated values are listed in Table 1. For pancake shape modelling, we have applied the ‘generalized’ JKR model on flattened cells with variable thickness of 25 μm (case 1), 14 μm (case 2), 9 μm (case 3) and 3 μm (case 4). As mentioned before, the cells may have spread on substrate with different shapes and thicknesses. Thus the penetration depth within 10% of the film thickness could not be guaranteed in reality. To accommodate the situation, we have chosen the possible film thickness from the thickest (case 1) to the thinnest (case 4).
18
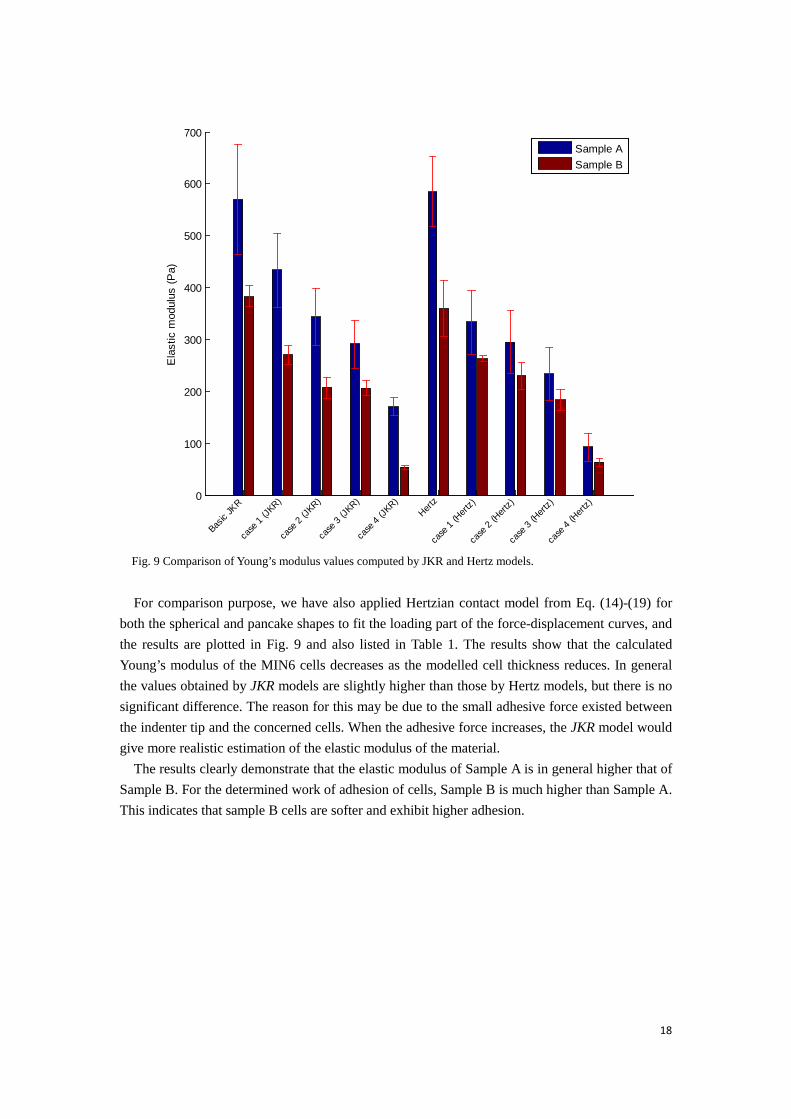
Fig. 9 Comparison of Young’s modulus values computed by JKR and Hertz models.
For comparison purpose, we have also applied Hertzian contact model from Eq. (14)-(19) for
both the spherical and pancake shapes to fit the loading part of the force-displacement curves, and the results are plotted in Fig. 9 and also listed in Table 1. The results show that the calculated Young’s modulus of the MIN6 cells decreases as the modelled cell thickness reduces. In general the values obtained by JKR models are slightly higher than those by Hertz models, but there is no significant difference. The reason for this may be due to the small adhesive force existed between the indenter tip and the concerned cells. When the adhesive force increases, the JKR model would give more realistic estimation of the elastic modulus of the material.
The results clearly demonstrate that the elastic modulus of Sample A is in general higher that of Sample B. For the determined work of adhesion of cells, Sample B is much higher than Sample A. This indicates that sample B cells are softer and exhibit higher adhesion.
0
100
200
300
400
500
600
700
Ela
stic
mod
ulus
(Pa)
Basic
JKR
case
1 (JK
R)
case
2 (JK
R)
case
3 (JK
R)
case
4 (JK
R)
Hertz
case
1 (H
ertz)
case
2 (H
ertz)
case
3 (H
ertz)
case
4 (H
ertz)
Sample ASample B
19
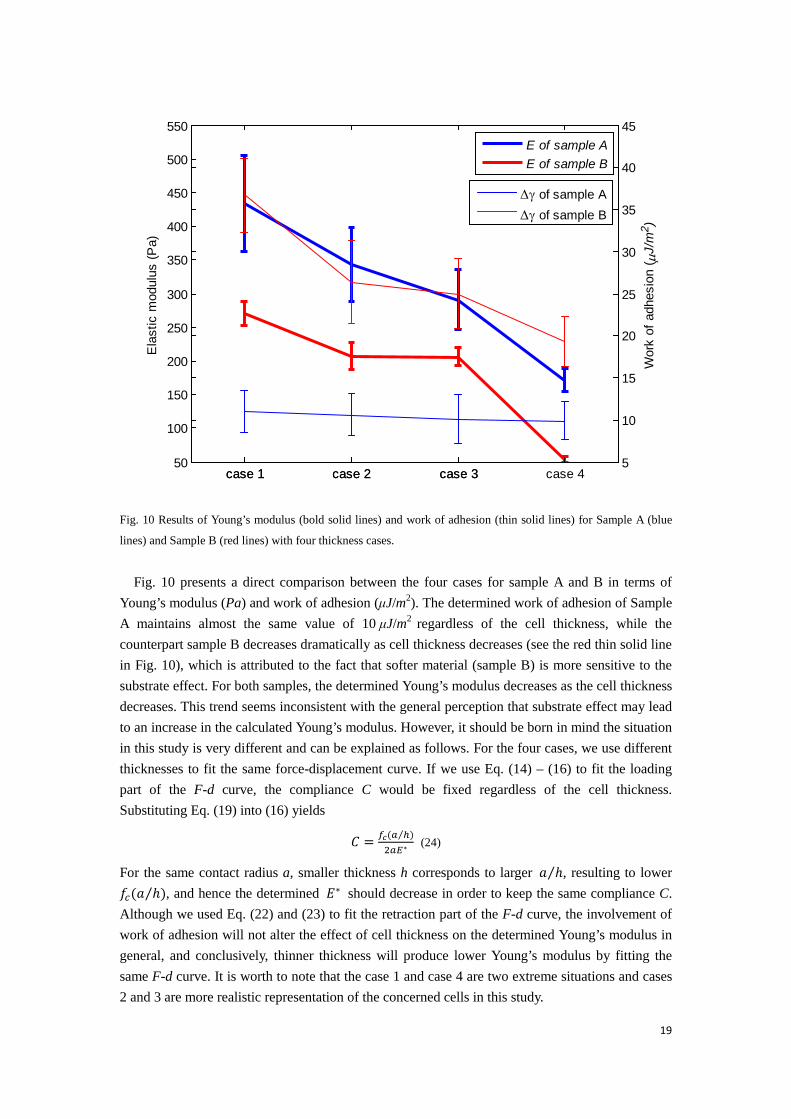
Fig. 10 Results of Young’s modulus (bold solid lines) and work of adhesion (thin solid lines) for Sample A (blue
lines) and Sample B (red lines) with four thickness cases.
Fig. 10 presents a direct comparison between the four cases for sample A and B in terms of Young’s modulus (Pa) and work of adhesion (μJ/m2). The determined work of adhesion of Sample A maintains almost the same value of 10 μJ/m2 regardless of the cell thickness, while the counterpart sample B decreases dramatically as cell thickness decreases (see the red thin solid line in Fig. 10), which is attributed to the fact that softer material (sample B) is more sensitive to the substrate effect. For both samples, the determined Young’s modulus decreases as the cell thickness decreases. This trend seems inconsistent with the general perception that substrate effect may lead to an increase in the calculated Young’s modulus. However, it should be born in mind the situation in this study is very different and can be explained as follows. For the four cases, we use different thicknesses to fit the same force-displacement curve. If we use Eq. (14) – (16) to fit the loading part of the F-d curve, the compliance C would be fixed regardless of the cell thickness. Substituting Eq. (19) into (16) yields
𝐶 = 𝑓𝑐(𝑎 ℎ⁄ )2𝑎𝐸∗
(24)
For the same contact radius a, smaller thickness h corresponds to larger 𝑎 ℎ⁄ , resulting to lower 𝑓𝑐(𝑎 ℎ⁄ ), and hence the determined 𝐸∗ should decrease in order to keep the same compliance C. Although we used Eq. (22) and (23) to fit the retraction part of the F-d curve, the involvement of work of adhesion will not alter the effect of cell thickness on the determined Young’s modulus in general, and conclusively, thinner thickness will produce lower Young’s modulus by fitting the same F-d curve. It is worth to note that the case 1 and case 4 are two extreme situations and cases 2 and 3 are more realistic representation of the concerned cells in this study.
case 1 case 2 case 350
100
150
200
250
300
350
400
450
500
550
Ela
stic
mod
ulus
(Pa)
E of sample AE of sample B
case 1 case 2 case 3 case 45
10
15
20
25
30
35
40
45
Wor
k of
adh
esio
n ( m
J/m
2 )
Dγ of sample ADγ of sample B
20
4. Conclusions
In this paper, the adhesion between the surface of polystyrene micro-bead and cyto-membrane of biological cells has been investigated. The adhesion at the contact between AFM tip and the cell, Johnson-Kendall-Roberts (JKR) model has been used to fit the force-displacement curves obtained. The effect of viscoelasticity of cell under the AFM indentation can be neglected since the extracted viscous relaxation time is very small compared with the loading time period. The MIN6 cell has been modeled as first a sphere and then a flattened cell with different thicknesses. Firstly, the cell and the indenter are modeled as two spheres, and the JKR model has been applied to fit the experimental data of the retraction part of the force-displacement curves. Secondly, the indented cell is treated as a layer with four different finite thicknesses, and “generalized” JKR model is used to fit the same force-displacement curves. The results have shown that both the basic JKR and “generalized” JKR models can describe very well the behavior of the unloading force-deformation curves. The “generalized” JKR model can be used for more realistic cell modelling with various cell thicknesses and both models can identify the property variations of the two types of cells. Unequivocally, work of adhesion determined by both the JKR models demonstrates a moderate adhesion existing between the AFM tip and the cell. Such a result may be explained by a twofold reason: the AFM tips were not functionalized and the indentation experiments were conducted in liquid medium. The former resulted in insignificant specific adhesion, while the latter gave rise to low non-specific adhesion. Overall, the JKR models (basic and generalized) are preferred than Hertz model, if there exists significant adhesion at the interface. JKR models provide a valuable insight in the potential influence of the adhesion between AFM tip and cell on the determination of cell elasticity. Acknowledgements The authors are grateful for the technical supports the Laboratory of Precision Engineering and Surfaces of the University of Warwick. This project has been partially funded by the European Union’s Horizon 2020 research and innovation programme under the Marie Skłodowska-Curie grant agreement No 644971.
Reference A-Hassan, E., Heinz, W.F., Antonik, M.D., D’Costa, N.P., Nageswaran, S., Schoenenberger, C.A., Hoh, J.H., 1998. Relative microelastic mapping of living cells by atomic force microscopy. Biophys J. 74, 1564-1578. Alcaraz, J., Buscemi, L., Grabulosa, M., Trepat, X., Fabry, B., Farree, R., Navajas, D., 2003. Microrheology of human lung epithelial cells measured by atomic force microscopy. Biophys J. 84, 2071-2079. Alessandrini, A., Facci, P., 2005. AFM: a versatile tool in biophysics. Meas. Sci.Technol. 16, R65–R92.
21
Cho, S.S., Park, S., 2004. Finite element modeling of adhesive contact using molecular potential. Tribol.Int.37, 763–769. Demichelis, A., Divieto, C., Mortati,L., Pavarelli,S., Sassi, G., Sassi, M.P., 2015. Toward the realization of reproducible AFM measurements of elastic modulus in biological samples. J. Biomech. In press. Derjaguin, B.V., Muller, V.M., Toporov, Y.P., 1975. Effect of contact deformations on the adhesion of particles. J. Colloid Interface Sci. 53, 314–326. Dimitriadis, E.K., Horkay, F., Maresca, J., Kachar, B., Chadwick, R.S., 2002. Determination of elastic moduli of thin layers of soft material using the atomic force microscope. Biophys. J. 82, 2798–2810. Dulińskaa, I., Targosza, M., Strojnyc, W., Lekkab, M., Czubaa, P., Balwierzc, W., Szymońskia, M., 2006. Stiffness of normal and pathological erythrocytes studied by means of atomic force microscopy. J. Biochem. Bioph. Methods. 66, 1-11. Franz, C.M., Puech, P.H., 2008. Atomic Force Microscopy: A Versatile Tool for Studying Cell Morphology, Adhesion and Mechanics. Cell Mol Bioeng. 1(4), 289-300. Hertz, H., 1882. On the contact of elastic solids. J.Reine und Angewandte Mathematik. 92, 156-171. Hills, C.E., Younis, M.Y., Bennett, J., Siamantouras, E., Liu, K.K., 2012. Squires PE. Calcium-sensing receptor activation increases cell-cell adhesion and β-cell function. Cell Physiol Biochem. 30, 575-786. Ikai, A., Xu, X.M., Mitsui, K., 1997. Measurements of mechanical parameters of biological structures with atomic force microscope. Scanning Microsc. 12, 585-596.
ISO/CD 14577-4 2007 Metallic materials -- Instrumented indentation test for hardness and materials parameters -- Part 4: Test method for metallic and non-metallic coatings
Johnson, K.L., Greenwood, J.A., 1997. An adhesion map for the contact of elastic spheres. J. Colloid Interface Sci. 192, 326-333. Johnson, K.L., Kendall, K., Roberts, A.D., 1971. Surface energy and the contact of elastic solids. Proc. R. Soc. Lond. A 324, 301–313. Jung, Y.G., Lawn, B.R., Martyniuk, M., Huang, H., Hu, X.Z., 2004. Evaluation of elastic modulus and hardness of thin films by nanoindentation. J Mater Res. 19, 3076-3080.
22
Koay, E.J., Shieh, A.C., Athanasiou, K.A., 2003. Creep Indentation of Single Cells. J Biomech Eng. 125(3), 334-341. Ladjal, H., Hanus, J.L., Pillarisetti, A., Keefer, C., Ferreira, A., Desai, J.P., 2009. Atomic force microscopy-based single-cell indentation: Experimentation and finite element simulation. IEEE/RSJ International Conference on Intelligent Robots and Systems. 1326-1332. Lee, E.H., Radok, J.R.M., 1960. The contact problem for viscoelastic bodies. J. Appl. Mech. 27(3), 438-444. Lekka, M., Laidler, P., Ignacak, J., xabe˛dz, M., Lekki, J., Struszczyk, H., Stachuraa, Z., Hrynkiewicza, A.Z., 2001. The effect of chitosan on stiffness and glycolytic activity of human bladder cells. Biochim Biophys Acta. 1540(2): 127-136. Li, Q.S., Lee, G.Y.H., Ong, C.N., Lim, C.T., 2008. AFM indentation study of breast cancer cells. Biochem. Biophys. Res. Commun. 374, 609-613. Maciaszek, J.L., Partola, K., Zhang, J., Andemariam, B., Lykotrafitis, G., 2014. Single-cell force spectroscopy as a technique to quantify human red blood cell adhesion to subendothelial laminin. J. Biomech. 47, 3855–3861. Nowakowski, R., Luckham, P., Winlove, P., 2001. Imaging erythrocytes under physiological conditions by atomic force microscopy. Biochim Biophys Acta. 1514, 170-176. Pethica1, J.B., Sutton1, A.P., 1988. On the stability of a tip and flat at very small separations. J. Vac. Sci. Technol. A6, 2490-2494. Rosenbluth, M.J., Lam, W.A., Fletcher, D.A., 2006. Force microscopy of nonadherent cells: a comparison of leukemia cell deformability. Biophys J. 90, 2994–3003. Siamantouras E, Hills CE, Younis MYG, Squires PE, Liu KK. 2014a. Quantitative investigation of
calcimimetic R568 on beta cell adhesion and mechanics using AFM single-cell force spectroscopy.
FEBSLetters ; 58:1178-1183. Siamantouras E, Hills CE, Liu K-K, Squires PE., 2014b. Nanomechanical Investigation of Soft Biological Cell Adhesion using Atomic Force Microscopy. Cellular & Molecular Bioengineering. 8(1): 22-3. Shull, K.R., Ahn, D., Chen, W.L., Flanigan, C.M., Crosby, A.J., 1998. Axisymmetric adhesion tests of soft materials. Chem.Phys.199, 2769-2784.
23
Shull, K.R., 2002. Contact mechanics and the adhesion of soft solids. Mater. Sci. Eng. Rep.36 (1), 1-45. Sirghi, L., Ponti, J., Broggi, F., Rossi, F., 2008. Probing elasticity and adhesion of live cells by atomic force microscopy indentation. Eur. Biophys. J. 37, 935–945. Song, Z., Komvopoulos, K., 2011. Adhesion-induced instabilities in elastic and elastic–plastic contacts during single and repetitive normal loading. J. Mech.Phys. Solids. 59, 884-897. Tabor, D., 1977. Surface forces and surface interactions. J. Colloid Interface Sci. 58, 2-13. Ting, T.C.T., 1966. The Contact Stresses Between a Rigid Indenter and a Viscoelastic Half-Space. J. Appl. Mech. 33(4), 845-854. Yu, H.L., Li, Z., Wang, Q.J., 2013. Viscoelastic-adhesive contact modeling: Application to the characterization of the viscoelastic behavior of materials. Mech Mater. 60, 55-65. Zachee, P., Boogaerts, M.A., Hellemans, L., Snauwaert, J., 1992. Adverse role of the spleen in hereditary spherocytosis-evidence by the use of the atomic force microscope. Br J Haematol. 80, 264-265. Zhang, C.Y., Zhang, Y.W., 2008. Computational analysis of adhesion force in the indentation of cells using atomic force microscopy. Physical Review E. 77, 021912.