Embed Size (px)
Citation preview

�
� Joachim Ohser and Katja Schladitz: 3D Images of Materials Structures —Chap. ohser2030c01 — 2009/8/18 — 12:42 — page 1 — le-tex
�
�
�
�
�
�
1
1Introduction
A variety of imaging techniques, first of all computed tomography, yield spatial(3D) images of micro-structures of materials on various scales as well as biologicalstructures, food, snow and ice. This book is dedicated to methods for the quanti-tative analysis of the resulting 3D image data. Most of the described methods arerooted in discrete, differential, integral, and stochastic geometry, and mathematicalmorphology. The application examples focus attention on characterizing materialstructures, while the algorithms are of course of a general nature. A short and byno means complete overview of imaging techniques yielding spatial information isgiven below.
The number of methods for creating 3D image data as well as the number, qual-ity, and content of the images is growing fast. While 5123 pixels with 8 bit greyvalues were a large data set a couple of years ago, 20483 pixels with 16 bit grey val-ues are the rule rather than the exception nowadays. Microcomputed tomography(μCT), as the most affordable 3D imaging technique, found its way into laborato-ries not only in research institutions but also in industry. The resulting wealth of3D image data increases the need for efficient and objective analysis. The meresize of the images demands particularly fast algorithms and very careful memorymanagement.
Contrary to classical materialography based on 2D images, using the full spa-tial information contained in 3D images allows, for example detailed direction-al analyses, estimation of particle-size distributions without shape assumptions,and judgement of the 3D connectivity of a structure, to name but a few. Moreover,macroscopic material properties can be simulated in the 3D images or in geomet-ric models fit to the microstructure. The other side of the coin is the difficulty invisualizing and visually evaluating the results of processing or analysis steps. Spe-cial techniques for visualization – rendering, slicing, animation – are needed andvisual assessment has generally to be distrusted.
We felt that this book was needed because a variety of image processing and anal-ysis algorithms are a magnitude more complex than in 2D although in principlethe algorithm works the same way. Perhaps the most striking example is the la-belling of connected components. At first sight, this algorithm does not even seemto depend on dimension at all: a foreground pixel is given a label, all pixels connect-ed to it are searched, found, and also labelled, then the next unlabelled foreground
3D Images of Materials Structures. Joachim Ohser and Katja SchladitzCopyright ©2009 WILEY-VCH Verlag GmbH & Co. KGaA, WeinheimISBN: 978-3-527-31203-0

�
� Joachim Ohser and Katja Schladitz: 3D Images of Materials Structures —Chap. ohser2030c01 — 2009/8/18 — 12:42 — page 2 — le-tex
�
�
�
�
�
�
2 1 Introduction
pixel is taken and so on. Looking closer one detects that even the deeper basis ofthis algorithm becomes unsafe when moving to dimensions 3 and higher. Classi-cal concepts of discrete geometry like neighbourhood and complementarity do nottransfer easily. Therefore, a significant part of this book is dedicated to buildinga sound basis for lattices, adjacency systems, complementarity, and connectivity.
In medical applications, 3D images have been processed and analyzed for muchlonger. However, the emphasis in medicine is often on making structures visiblein the true sense of the word. The object of interest is known; manual interferenceis desired. Thus many problems discussed here, such as the equal treatment ofdifferent components or skeletonization exactly preserving the connectivity, playa minor role in medical image processing. On the other hand, we omit highlyimportant issues such as registration and matching which certainly also play a rolein materials science applications.
Time is not yet ripe for a standard reference on the analysis of 3D or multi-dimensional images of materials structures and this book does not intend to coverthe topic comprehensively. The intention is rather to thoroughly explore some as-pects of particular relevance for multi-dimensional image analysis, such as integral-geometric or spectral methods yielding efficient analysis algorithms. These pene-trating, mathematically detailed key aspects are complemented by image process-ing and segmentation as well as simulation of macroscopic materials propertiesbased on 3D image data from a practical applications point of view. More precise-ly, in Chapter 2, we introduce the notation and summarize the basics of imageprocessing and analysis, which are used in the subsequent chapters. These are, inparticular, the intrinsic volumes as basic characteristics, definition and characteri-zation of random closed sets used for modelling components of microstructures,and some formulae from Fourier analysis helpful for definition and estimationof second-order properties. Image data are usually given on homogeneous latticescovered by Chapter 3. Connectivity of the lattice points is a crucial property, e. g.for surface rendering, labelling, watershed transform or skeletonization. We defineconnectivity using the concept of an adjacency system thus avoiding ambiguities inhigher dimensions and we give an easy-to-check criterion for adjacency systems tobe complementary. Chapter 3 also comprises a choice of segmentation and image-processing methods which, in our opinion, are particularly suited for the purposeof characterizing structures, more precisely microstructures, of materials: filters,morphological and distance transforms, labelling, and skeletonization.
The core of the book is Chapter 5 focusing on efficient measurement of charac-teristics by integrating the local information contained in 2n pixel configurations,where n is the space dimension. Our method, based on integral geometry, takes upideas from André Haas, Jean Serra, and Georges Matheron [109, 110, 323] and gen-eralizes along essential lines to arbitrary dimensions. The resulting algorithms arefast and memory-saving and yield an amazing amount of structural information.The spectral analysis presented in Chapter 6 is closely related to diffraction experi-ments, well-established in material characterization. Diffraction by image process-ing is based on the Fourier transform, leading via the fast Fourier transform, tofast algorithms. Auto- and cross-covariance functions and their counterparts in the

�
� Joachim Ohser and Katja Schladitz: 3D Images of Materials Structures —Chap. ohser2030c01 — 2009/8/18 — 12:42 — page 3 — le-tex
�
�
�
�
�
�
1 Introduction 3
inverse space (so-called Bartlett spectra) which are computed using the fast Fouriertransform, are the natural quantities characterizing microstructural fluctuations.Moreover, spectral analysis does not rely on prior segmentation and therefore haspotential for the analysis of low-contrast images. Stochastic geometric models formacroscopically homogeneous microstructures are covered in Chapter 7. Modelfitting is illustrated for fibre and cellular structures on a few examples. Finally,Chapter 8 builds the bridge to the vivid and, in modern materials research, centraltopic of investigating the relations between microstructure and material properties.Here, this important issue can only be touched on. However, it is natural to use 3Dimage data as a starting point for finite-element methods. In particular, combinedwith the stochastic models from Chapter 7, this opens new opportunities in mate-rials design and optimization. We clarify the simulation of macroscopic propertiesusing the example of computation of mechanical properties of porous media basedon 3D images obtained by microcomputed tomography.
This book incorporates ideas from many sources, first the various fields of geom-etry mentioned above, but also computer science, materials science, and physics aswell as the list of reference documents. A small number of books which are partic-ularly important to us will be listed here. Jean Serra’s book [323] is a treasure trovefor both mathematical morphology and stochastic geometry. Methods from integraland stochastic geometry play a central role in our understanding of image analysis.The standard reference is still the book [343] by Dietrich Stoyan, Wilfried Kendall,and Joseph Mecke which sets an example in uniting theory and application. Soundtheoretical background on convex, integral, and stochastic geometry are providedby Rolf Schneider’s and Rolf Schneider’s and Wolfgang Weil’s books [315, 317].Not least, we have learned a lot from Gabriele Lohmann’s pioneering book on 3Dimage processing [207].
While finalizing this book we came to know the recent book on 3D image pro-cessing by Junichiro Toriwaki and Hiroyuki Yoshida [360]. There are some strikingparallel developments, however, in general the focus is rather on those subjectswhich are kept short in our book. This is not the least due to their motivation stem-ming from medical applications.
Image Sources
The term tomography summarizes imaging methods which deliver 3D data setsconsisting of cross-sectional slices from the investigated sample. John Banhart [24]classifies tomographic techniques as
� non-destructive, using projections only like μCT,� non-destructive, using information beyond projection images such as 3D
X-ray diffraction [24, Chapter 9], and� destructive such as position-sensitive ion microscopy – 3D atom probe [40].
Tomography in the strict sense denotes non-destructive methods reconstructingthe 3D image data from projection images using tomographic reconstruction, only,

�
� Joachim Ohser and Katja Schladitz: 3D Images of Materials Structures —Chap. ohser2030c01 — 2009/8/18 — 12:42 — page 4 — le-tex
�
�
�
�
�
�
4 1 Introduction
see [24, Chapter 2] for an overview and further references. Most data sets used inthis book are acquired by X-ray computed tomography, which nowadays certainlyaccounts for the vast majority of 3D images of materials structures. Neverthelessthere are several other 3D imaging techniques with particular potential for ma-terials science applications briefly mentioned below, e. g. electron tomography orscanning electron microscopy combined with focused ion-beam thinning.The idea of computed X-ray tomography dating back to [61] is to combine radio-graphic projection images of the linear X-ray attenuation coefficient from a setof different projection angles in order to reconstruct the mass distribution withina sample. Godfrey Hounsfield [139] transfered this idea into a device which im-aged, non-destructively, parts of a body in three dimensions – the first tomograph.Computed tomography had a strong impact on medicine [140] and was quicklyintroduced into material science as well [281], where the resolutions reached themicrometer-scale (microtomography [91]).
Synchrotron radiation delivers images with low noise level and high contrast, dueto the high available flux allowing short exposure times and mono-chromatization,as well as the nearly parallel beam eliminating cone-beam and fan-beam recon-struction artifacts. For the reconstruction of the tomographic images the filteredback-projection algorithm is commonly used [157]. Synchrotron radiation also al-lows one to use contrast mechanisms other than the classical X-ray attenuation:
� local electron density (phase contrast, holotomography) [59],� chemical species distribution (fluorescence tomography) [329],� inner surfaces and interfaces (refraction-enhanced tomography) [235],� or local crystalline lattice quality (topo-tomography) [210].
For a comprehensive and recent overview of tomographic imaging techniques, seethe compilation [24] edited by John Banhart. Examples of μCT images from bothsynchrotron and laboratory sources are abundant throughout the book. Sourcesof sample and image are usually given in the respective captions, except for thefollowing frequent image sources which are given here in full, in order to keep thecaptions short.
� Fraunhofer Institut für Zerstörungsfreie Prüfung, (IZFP), Saarbrücken,Germany.� Alexander Rack, now affiliated to the European Synchrotron Radiation Fa-
cility (ESRF, beamline ID22), Grenoble, France; formerly at Helmholtz-Zentrum Berlin, images taken at BAMline of Bessy (Berliner Elektro-nenspeicherring – Gesellschaft für Synchrotronstrahlung m.b.H.), ANKA(Forschungszentrum Karlsruhe, Institute for Synchrotron Radiation), andbeamline ID22 at ESRF.� Bernhard Heneka, RJL Micro&Analytic GmbH, Karlsdorf, Germany, images
taken with various μCT-devices by SkyScan, Kontich Belgium.� Lukas Helfen, affiliated to ANKA, imaging at beamline ID19 of ESRF.

�
� Joachim Ohser and Katja Schladitz: 3D Images of Materials Structures —Chap. ohser2030c01 — 2009/8/18 — 12:42 — page 5 — le-tex
�
�
�
�
�
�
1 Introduction 5
Fig. 1.1 The mineralized exoskeleton of the common woodlouse Porcellio scaber. The image wastaken by µCT using synchrotron radiation (SRµCT scan, pixel spacing 11.35 µm) by F. Neues,Momentive Performance Materials GmbH, Leverkusen. The cuticle consists of calcium carbon-ate and chitin. A virtual cut was performed to create this picture. Sample provided by M. Epple,Universität Duisburg-Essen, Institut für Anorganische Chemie. Specimen by A. Ziegler, Univer-sität Ulm. Total length of the animal is 8 mm. Visualization by VG Studio MAX.
Fig. 1.2 SRµCT scan by F. Neues, Momentive Performance Materials GmbH, Leverkusen,of a branchial bone with the pharyngeal teeth of Danio rerio (pixel spacing 6.88 µm, length ofa tooth approximately 0.2 mm). The teeth in D. rerio are replaced during the whole lifespan ofthe fish. Sample by W. Arnold, Universität Witten/Herdecke, image provided by M. Epple, Uni-versität Duisburg-Essen, Institut für Anorganische Chemie. Visualization by VG Studio MAX.

�
� Joachim Ohser and Katja Schladitz: 3D Images of Materials Structures —Chap. ohser2030c01 — 2009/8/18 — 12:42 — page 6 — le-tex
�
�
�
�
�
�
6 1 Introduction
(a)
(b)
Fig. 1.3 Electron tomographic image of a catalyst produced by Haldor Topsoe for oil refining.Alumina support structure (4–5 nm thick) and 10-nm gold markers used for alignment, pixelspacing 0.69 nm. Images taken by C. Kübel, FEI Company, Eindhoven [181]. Visualizations madeusing Amira. (a) Volume rendering of 700 � 700 � 150 nm3. (b) Surface rendering of a sub-volume of approx. 100 nm edge length revealing the sheet-like structure of the support material.

�
� Joachim Ohser and Katja Schladitz: 3D Images of Materials Structures —Chap. ohser2030c01 — 2009/8/18 — 12:42 — page 7 — le-tex
�
�
�
�
�
�
1 Introduction 7
Images of biological objects scanned at Hamburger Synchrotronstrahlungsla-bor (HASYLAB) of Deutsches Elektronen-Synchrotron (DESY) are shown in Fig-ures 1.1 and 1.2. For details about the aims of the investigation see [242, 243].Another tomographic technique is electron tomography. Here a series of 2D projec-tion images obtained by (scanning) transmission electron microscopy ((S)TEM) ofthe tilted sample at angles in the range [�75ı, 75ı] or [�65ı, 65ı] are reconstructedinto a 3D image. The projection images are taken either in bright field TEM modeor high-angle angular dark field STEM mode where the latter also allows imagingof crystalline structures. Resolution depends strongly on the nature and thicknessof the sample as well as the maximal tilt angle, but can reach 1 nm. An example isshown in Figure 1.3. The book [24] also includes a chapter on electron tomography.
There are various further 3D imaging techniques. One of these is scanning elec-tron microscopy (SEM) combined with focused ion beam (FIB) thinning. Depend-ing on the lateral resolution of SEM and the thinning rate of FIB, a pixel spacingdown to 10 nm can be achieved [134, 367]. As an example we show the lamellarstructure of cast iron with flake graphite, see Figure 1.4. SEM with FIB is in princi-
Fig. 1.4 Flake graphite in cast iron. The image was taken by scanning electron microscopy(SEM) combined with focused ion beam (FIB) thinning of the corresponding cast iron speci-men. Sample by Halberg Guss GmbH, imaging by A. Velichko, Universität des Saarlandes, Insti-tut für Funktionswerkstoffe. Visualization using Amira. Visualized are 460�275�200 which cor-respond at pixel spacings of 0.185 µm� 0.235 µm � 0.5 µm to 85.1 µm � 64.6 µm� 100 µm [367].
�
� Joachim Ohser and Katja Schladitz: 3D Images of Materials Structures —Chap. ohser2030c01 — 2009/8/18 — 12:42 — page 8 — le-tex
�
�
�
�
�
�
8 1 Introduction
(a) (b)
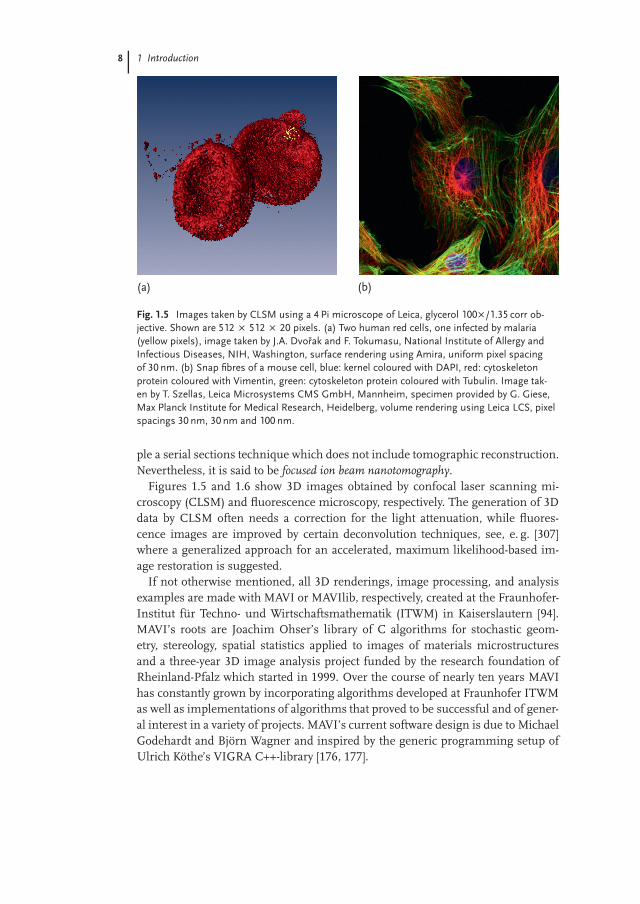
Fig. 1.5 Images taken by CLSM using a 4 Pi microscope of Leica, glycerol 100�/1.35 corr ob-jective. Shown are 512 � 512 � 20 pixels. (a) Two human red cells, one infected by malaria(yellow pixels), image taken by J.A. Dvorak and F. Tokumasu, National Institute of Allergy andInfectious Diseases, NIH, Washington, surface rendering using Amira, uniform pixel spacingof 30 nm. (b) Snap fibres of a mouse cell, blue: kernel coloured with DAPI, red: cytoskeletonprotein coloured with Vimentin, green: cytoskeleton protein coloured with Tubulin. Image tak-en by T. Szellas, Leica Microsystems CMS GmbH, Mannheim, specimen provided by G. Giese,Max Planck Institute for Medical Research, Heidelberg, volume rendering using Leica LCS, pixelspacings 30 nm, 30 nm and 100 nm.
ple a serial sections technique which does not include tomographic reconstruction.Nevertheless, it is said to be focused ion beam nanotomography.
Figures 1.5 and 1.6 show 3D images obtained by confocal laser scanning mi-croscopy (CLSM) and fluorescence microscopy, respectively. The generation of 3Ddata by CLSM often needs a correction for the light attenuation, while fluores-cence images are improved by certain deconvolution techniques, see, e. g. [307]where a generalized approach for an accelerated, maximum likelihood-based im-age restoration is suggested.
If not otherwise mentioned, all 3D renderings, image processing, and analysisexamples are made with MAVI or MAVIlib, respectively, created at the Fraunhofer-Institut für Techno- und Wirtschaftsmathematik (ITWM) in Kaiserslautern [94].MAVI’s roots are Joachim Ohser’s library of C algorithms for stochastic geom-etry, stereology, spatial statistics applied to images of materials microstructuresand a three-year 3D image analysis project funded by the research foundation ofRheinland-Pfalz which started in 1999. Over the course of nearly ten years MAVIhas constantly grown by incorporating algorithms developed at Fraunhofer ITWMas well as implementations of algorithms that proved to be successful and of gener-al interest in a variety of projects. MAVI’s current software design is due to MichaelGodehardt and Björn Wagner and inspired by the generic programming setup ofUlrich Köthe’s VIGRA C++-library [176, 177].

�
� Joachim Ohser and Katja Schladitz: 3D Images of Materials Structures —Chap. ohser2030c01 — 2009/8/18 — 12:42 — page 9 — le-tex
�
�
�
�
�
�
1 Introduction 9
(a) (b)
Fig. 1.6 Fluorescent 3 channel 3D image of a Zymosan treated mouse macrophage cell linetaken with a Carl Zeiss fluorescence research microscope Axiovert 200 M equipped with a PlanAPOCHROMAT 63�/1.4 NA objective and an AxioCam HRm cooled CCD camera. Image pro-vided by B. Kraus, Pharmazeutische Biologie, Universität Regensburg. Red: f-actrin colouredwith phalloidine rhodamine. Blue: kernels, coloured with Hoechst 33342. Green: Zymosan yeastcell walls, coloured with Bodipy-FL, 432 � 504 � 111 pixels, pixel spacings (106, 106, 280) nm.Because of an oversampling in the x y -plane by a factor of about 2.5, it is possible to deconvolvethe original image using an iterative, regularized and accelerated maximum-likelihood algorithmresulting in a considerably improved resolution and contrast in the widefield image. (a) Originalimage. (b) Widefield image.
We do not intend to give a complete overview of 3D image processing softwarein the following. However, we give a short and subjective choice of tools which wefind useful at least for some tasks. There is a wide range of high-quality visual-ization tools also offering 3D processing algorithms, some of which are very so-phisticated and, to a more limited extent, characterization. Examples are the widelyused commercial software systems VGStudio MAX by Volume Graphics and Ami-ra/Avizo by Mercury Systems. Visualizations made with these two systems are alsofeatured in this book. Advanced Visual Systems offers with AVS/Express a pow-erful tool box for visualization. For research purposes vtk/itk (www.itk.org, C++)and ImageJ (rsb.info.nih.gov/ij, Java) offer open source libraries focused on med-ical image segmentation and processing and microscopy data, respectively. DIPlib(www.diplib.org, C, MATLAB interface) can be used non-commercially under a freelicence. IDL (Interactive Data Language) by ITT Visual Information Solutions isa commercial high-level programming language offering a wide variety of imageprocessing algorithms and thus allowing fast creation of user-defined applications.

�
� Joachim Ohser and Katja Schladitz: 3D Images of Materials Structures —Chap. ohser2030c02 — 2009/8/18 — 12:42 — page 10 — le-tex
�
�
�
�
�
�


![Electrodynamics and energy characteristics of aurora...118 zenith, careful modeling or assumptions must be introduced. Tuttle et al. [2014] recently 119 demonstrated a powerful method](https://img.pdfslide.us/doc/110x75/5fde9e534680d51ac159389a/electrodynamics-and-energy-characteristics-of-aurora-118-zenith-careful-modeling.jpg)