Embed Size (px)
Citation preview
COMMISSION INTERNATIONALE DES GRANDS BARRAGES
VINGT CINQUIÉME CONGRÉS
DES GRANDS BARRAGES STAVANGER, JUIN, 2015
USE OF RISK ANALYSIS FOR TAILINGS STORAGE FACILITY UPGRADE*
* utilisation d’ une l'analyse des risques pour l’ amélioration du stockage des résidus miniers
Malcolm BARKER
Principal Engineer Dams, GHD Brisbane
Alex BLACK Engineer Dams, GHD Brisbane
AUSTRALIA
1. INTRODUCTION
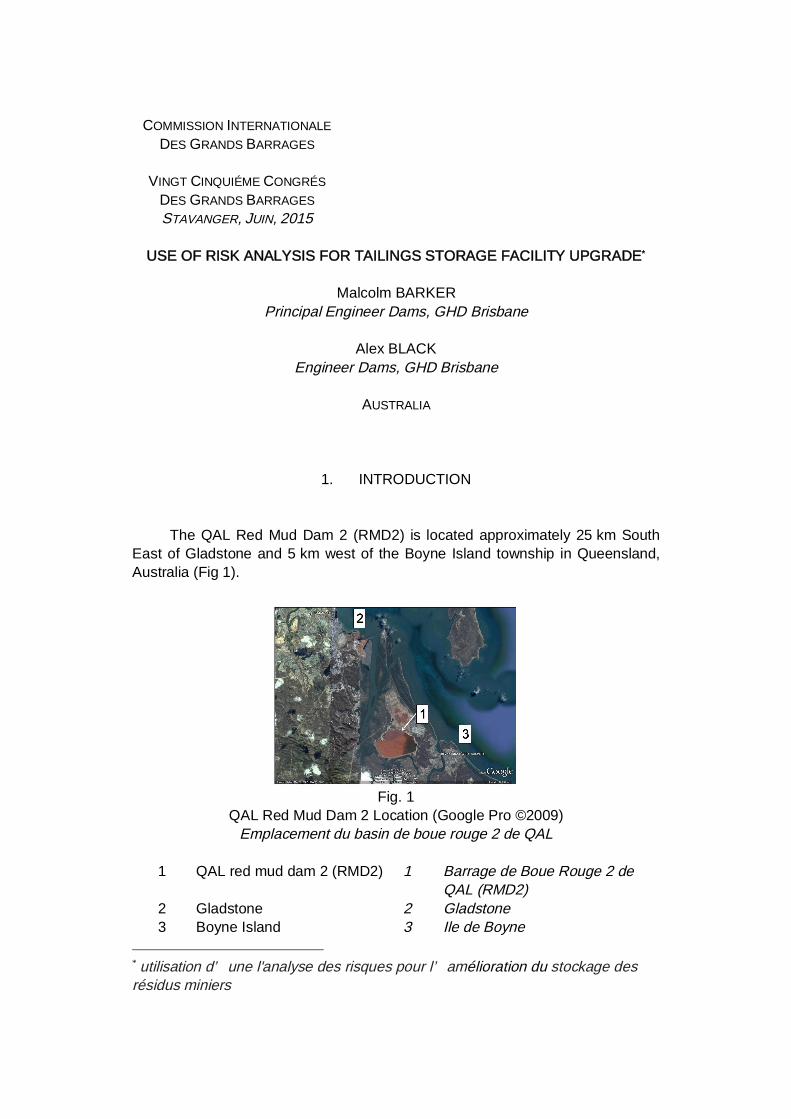
The QAL Red Mud Dam 2 (RMD2) is located approximately 25 km South East of Gladstone and 5 km west of the Boyne Island township in Queensland, Australia (Fig 1).
Fig. 1
QAL Red Mud Dam 2 Location (Google Pro ©2009) Emplacement du basin de boue rouge 2 de QAL
1 QAL red mud dam 2 (RMD2) 2 Gladstone 3 Boyne Island
1 Barrage de Boue Rouge 2 de QAL (RMD2)
2 Gladstone 3 Ile de Boyne

The components of RMD2 are shown on Fig 2. The dam embankments, which generally comprise Zone 1 clay core with Zone 3 outer shells constructed over rock foundation. Geofabric was provided between Zone 1 and 3 on the upstream side and a downstream filter for piping protection was provided on the lower section for all embankments and to the crest for Dam A/C and part of Dam D.
Fig. 2
Schematic layout of RMD2 Shéma du RMD2
1 Red Mud Dam 2 2 Discharge Point 3 Dam D 4 Dam A/C 5 Dam E 6 Spillway & Outlet Works 7 Overflow and Labyrinth 8 Water and power easement 9 Red Mud Dam 1 10 Scale before reduction
1 Barrage de boue rouge 2 (RMD 2) 2 point de rejet 3 Barrage D 4 Barrage A et C 5 Barrage E 6 Deversoir et point de sortie 7 trops-plein et labyrinthe 8 accés en eau et energie 9 Barrage de boue rouge 1 10 échelle avant reduction
Geosynthetic Clay Liner (GCL) was provided upstream in some
embankments for seepage and piping control. Typical embankment zones are shown on the failure modes (Fig 3). In addition to the internal zoning, cement stabilised tailings was constructed upstream of Dam D for about 25 m with a depth of about 3.5 m for the upstream raise construction. This cement stabilised fill is expected to preclude the piping failure modes through the upper part of the embankment.

Dam A/C and Dam E will be raised to RL 22.7 m and include a 0.5 m high safety bund on the upstream and downstream edge of the crest. Dam D will be raised to RL 24.0 m using a general fill section placed onto the cement treated red mud (Fig 4). The labyrinth spillway will be raised from RL 20.65 m to RL 21.65 m.
2. RISK ANALYSIS
The risk analysis was undertaken in a workshop format using the following process: Define the purpose of the risk assessment;
The purpose of the risk assessment was to update the previous analyses completed between 2004 and 2010 accounting for the use of the safety bunds for preventing overtopping failure and the concerns over the seepage noted at Dam E.
Determine the scope of the risk assessment;
The scope of the risk assessment included the piping, overtopping of the embankments and erosion of the spillway.
Develop the risk assessment acceptance criteria;
The risk was evaluated in terms of acceptance criteria for societal and individual risk [1].
Define the system to be analysed including the embankments, spillway and
outlet works and evaluate the likely failure modes for the components and initiating events;
Evaluate the flood frequency data;
Evaluate available data for the components to understand the performance and behaviour under the loads to be applied when estimating the failure probabilities;
Use simplified event trees (failure pathways) to calculate the risk. These were evaluated during the workshop with QAL personnel, reviewers and GHD personnel.
2.1. FAILURE MODES ANALYSIS

Failure of a dam or reservoir is defined to be the uncontrolled release of the stored water resulting from a breach of the dam or failure of an ancillary feature. A failure mode is the mechanism of failure. The Failure Mode Analysis (FMA) was completed using the following process.
Screening of Initiating Events
A list of potential failure initiating events was developed and screened to remove those events that were considered to be unlikely to affect the safety of the tailings dams.
Component Definition
The RMD2 was considered to be the main system with sub-components comprising the spillway and outlet works and Dams A/C, D and E.
The primary and auxiliary function of each component was defined.
Failure Modes Analysis (FMA)
A FMA was performed to determine the causes or mechanisms of failure from which the failure modes for further analysis were determined using the knowledge of the various components and their behaviour under each hazard or initiating event. All failure modes were screened for acceptance or rejection for further analysis. Typical piping failure pathways are shown on Fig 3.
Fig. 3
Dam A/C and part Dam E typical failure pathways Model de rupture classique de digue A,C et partiellement E
1 1 m raise 2 Failure Pathways 3 Red Mud 4 Dam A Chg 260 m to 1370 m
and Dam E 5 Dam A 1370 m to 2207 m and
Dam C
1 rehausse de 1 m 2 direction des ruptures 3 boue rouge 4 Barrage A de 260 m á 1370 m, et
barrage E 5 Barrage A de 1370 m á 2207 m et
barrage C

Table 1 shows the initiating events, failure modes and causes or mechanisms of failure for the embankment under hydrological loading that were considered in the risk analysis.
Table 1 QAL RMD2 Failure Modes Analysis (part table)
Tableau 1 QAL RMD2 Analyse du mode de ruptures (Partie de tableau)
Dam Failure Mode
Cause/mechanism of Dam Failure
Comments
Over-topping
Wave erosion of crest Wind and wave analysis Overfilling with tailings - redirects flood flow to outer edge.
Event has occurred and analysis is to be based on current design.
Piping Cracks in upper core and reservoir filling
Evaluated using assessment of cracks, seepage evaluation and construction practices
Construction defects
2.2. FLOOD HYDROLOGY
The rating curve for the labyrinth spillway was used for floodrouting the inflow floods from the 1 in 50 AEP event to the Probable Maximum Design Flood (PMP-DF) (Fig 4).
The data confirms that the embankment crest will be overtopped by 120 mm with the PMP-DF but that there will be a freeboard of 380 mm at the upstream safety bund. This presented a significant threat to the safety of the dam and the wave overtopping was evaluated for storm events up to the PMP-DF to ensure that the risk of overtopping erosion was acceptable.
The hydrological data was used to derive intervals for the risk analysis, as shown on Table 6. 2.3. RISK CALCULATION
The event trees/failure pathways and failure data were derived for the following areas. Piping
- Embankment Upper levels of the embankment above the GCL Lower levels of the embankment below the GCL

Original embankment - Foundation
Old river channel Normal cut-off sections
- Spillway Walls and outlet pipe
Erosion - Spillway Floor and stilling basin
Overtopping - Dam E - Dam A/C
Fig. 4
QAL RMD2 Stage 6 to 8 Water Level versus Annual Exceedance Probability AEP
QAL barrage de boue rouge 2, phase 6 á 8 , niveau d’ eau et probabilitée d’ occurence annuelle
1 Safety Bund Level 2 Dam Crest Level 3 2013 Stage 8 Data 4 2010 Stage 7 Data 5 2004 Stage 6 Data 6 Reservoir Level (m) 7 Annual Exceedance
Probability
1 niveau de securité de la digue 2 niveu de la crête du barrage 3 2013-donnée de la phase 8 4 2010 donnée de la phase 7 5 2004 donnée de la phase 6 6 niveau d’ eau dans le reservoir 7 probabilitée d’ occurence
annuelle

2.4. FAILURE SEQUENCE
The event trees or failure pathways were developed using the following general equation, which provides the probability of failure, conditional on the water level in RMD2 for which the annual water level probability for each water level interval (Tab 7) was applied to determine the annual failure probability. P(failure) = Probability of Initiation (Pi) * Probability of Continuation (Pc) * Probability of Progression (Pp) * (1 - Probability of Intervention (Pi)) * Probability of Breach (Pb) 2.4.1. Initiation Piping
Piping initiation was based on evaluation of known weaknesses in the core zone or foundation. The Piping Toolbox [2] assisted in the assignment of the initiating probabilities for piping, which relies on the probability of a crack being present and then the probability of piping initiating through the crack for each water level. Wind and wave overtopping
The wave heights and run up were calculated for a number of wind and wave scenarios using the Coastal Engineering Manual [3]. The resulting potential overtopping discharge was estimated using the experimental and theoretical investigations for flow on sea dikes [4] for which the wave run up for the 2% exceedance was used. The results showed that the overtopping flow for Dam A/C would be 13 l/s/m for the Flood Range 3 and 110 l/s/m for the PMP-DF.
The potential for initiation of erosion was assessed using the allowable overtopping discharges for embankment seawalls and grass dykes [5]. The downstream slopes of the embankments at RMD2 are generally gravelly fill, which has a high resistance to erosion, from which it was assessed that overtopping erosion would initiate for flows in excess of 10 l/s/m. Initiation of erosion was, therefore, expected for the PMP-DF event where the overtopping flows are well in excess of the initiation flow. 2.4.2. Continuation Piping
Where filters are present, the following pathways were considered. - Seals with little or No Erosion (PNE) - Partial or no seal with Large Erosion (PLE) – evaluated to be 0.05 - Continuing Erosion (PCE) - Evaluated to be 0.01 based on the filter
gradings

Where filters are not present, the effectiveness of the geofabric between Zone 1 clay and 3 general fill or the GCL was used to evaluate the continuation process of piping (Table 2).
Table 2 Continuation of Piping for Dam C, D and E >RL 15m with No Filters
Poursuite de l’ érosion interne pour barrage C, D et E> RL 15m sans couche filtrante
Dam C, Dam D Dam E
0.3 0.1 0.95 Due to excessive differential settlement, the geofabric layer is more likely to be damaged
Upstream GCL and cement treated red mud. Main failure scenario is a poorly compacted layer, and the potential for the water to flow up and above the filter layer
No Filter and seepage is free flowing from embankment
Spillway erosion and piping
The continuation of erosion at the spillway was determined by the flow characteristics of the spillway discharge (velocity, depth expected turbulence etc) and varied from 0.02 for Flood Range 1 to 0.5 for the PMP-DF.
The continuation of piping along the side wall and the outlet was based on the provision of the geofabric and granular filter layer placed during the Stage 6 works for which the probability was 0.02. Dam Overtopping
The continuation of overtopping of Dam A/C and Dam E caused by wind and waves was determined using the likelihood of the safety bund being breached, which for the PMP-DF was certain and Flood Range 3 was assessed to be between 0.5 to 1.0. 2.4.3. Progression Piping
The progression of piping was assessed to be 0.95 given the initiation and continuation stages of the process based on evaluation of the following factors:
- The embankment material is expected to be plastic and capable of holding a roof.
- Only dam D has a flow limiter with the cement treated red mud. - The majority of the embankment material is expected to be fine
grained and erodible.

Spillway Erosion The progression of erosion was determined by the duration of the flood and
varied from 0.01 for Flood Range 1 to 0.5 for the PMP-DF. Dam Overtopping
The progression of overtopping of Dam A/C and Dam E caused by wind and waves was determined using the likelihood of the flows back cutting into the pond, which was evaluated using the total overtopping discharge compared with breach flow discharges. 2.4.4. Intervention
It was assessed that there would be virtually no possibility of intervening in the failure process during the flood events. 2.4.5. Breach Piping
Likelihood of breach formation at the end of the piping sequence was assessed to be 0.95 based on the following failure modes
- Gross enlargement - Sinkhole formation - Slope failure and overtopping
Erosion
The erosion failure mode for the spillway was based on the flow back cutting into the reservoir and cutting down to the foundation level. Overtopping
Likelihood of breach formation at the end of the erosion overtopping sequence was assessed to be 0.95 based on (a) the depth of overtopping and (b) the duration of overtopping for the safety bund. 2.5. COMPARISON OF PROBABILITIES
The failure probabilities in the event trees were assessed using the Piping Toolbox [1] together with verbal descriptors and failure probabilities [7] (Tab 3). The table also provides in column 3 the equivalent for the QAL likelihoods.
When comparing the two probabilities, it must be borne in mind that the QAL events beyond the 1 in 100 (1%) are considered to be very unlikely given the duration of operation of the systems being evaluated. This raises the issue that the use of risk assessments when dealing with extreme events can present

difficulties for management to evaluate the risks given that other project risks have frequencies of more than 1%, whereas the TSF failure events are often controlled by significantly larger less frequent events.
Table 3
Mapping Scheme for Probability Estimates [7] catégorie cartographique des estimations de probabilité [7]
Qualitative Description Order of
Magnitude Probability
Equivalent QAL
Likelihood
Occurrence is virtually Certain 1 > 25% >0.25
Occurrence of the condition or event are observed in the available database
1 x 10⁻¹ (0.1)
10% to 25% 0.1 to 0.25
The occurrence of the condition or event is not observed or is observed in one isolated instance in the available database: Several potential failure scenarios can be identified
1 x 10⁻² (0.01)
1% to 10% 0.01 to 0.1
The occurrence of the condition or event is not observed in the available database. It is difficult to think about any plausible failure scenario, however, a single scenario could be identified after considerable effort.
1 x 10⁻³ (0.001)
<1% <0.01
The condition or event has not been observed and no plausible scenario could be identified even after considerable effort.
1 x 10⁻⁴ (0.0001)
The application of risk assessment for evaluating tailings dams and fresh
water dams is being accepted by many Dam Safety Regulators as an appropriate means for design and safety evaluation of the dams. There is a need, therefore, for decision makers within organisations where quantified risk assessments are being used for evaluating structures to familiarise themselves with the application and appropriateness of the various guidelines and risk acceptance criteria for their structures. 2.6. CONSEQUENCE ASSESSMENT
The potential Population at Risk (PAR) and life loss was made for breaching of the Dam E towards the north and Dams A/C and D to the South. Breach analyses were completed for the Sunny Day failure and PMP-DF from which the remaining events were evaluated for the risk estimation. The Inundation mapping for the PMP-DF breach of Dam A/C is shown on Fig 7 where

the 1 in 100 AEP flood extent is shown in blue and the PMP-DF is shown in brown.
The population at risk varied from 0 for the low decant level breach events up to 68 for the PMP-DF breach of the southern embankments. The loss of life was evaluated using the approach given by USBR DSO-99-06 [8] and was found to be less than 1 potential fatality owing to the shallow depths of about 500 mm and relatively low velocities.
Fig. 7
PMP-DF breach failure for Dam A/C Précipitation Probable Maximal, Rupture par fissure du barrage A et C
1 RMD2 2 Spillway 3 Downstream Boundary 4 Upstream Boundary 5 Population at Risk
1 Barrage de boue rouge 2 2 déversoire 3 condition limite á l’ aval 4 condition limite á l’ amont 5 Population á risque
2.7. RISK ANALYSIS RESULTS
The individual risk was calculated to be 6E-6 using a fatality rate of 0.15, which is below the ANCOLD tolerable limit of 1E-4 for an existing dam. The overall risk analysis results for each Dam are shown on Table 6.

Table 6 QAL RMD2 risk data for Stage 8 operation
Données sur les risques QAL RMD2 lors de la phase 8
Embankment Section
Annual Failure Probability
Percent of Total
Risk (lives/yr)
% Total
Dam A 2.54E-06 4.8% 6.15E-07 4.1% Dam C 2.06E-06 3.9% 2.07E-07 1.4% Dam D 8.28E-07 1.6% 8.37E-08 0.6% Dam E 4.67E-05 88.8% 1.40E-05 92.7%
Spillway 4.41E-07 0.8% 1.94E-07 1.3% Total 5.26E-05 100.0% 1.51E-05 100.0% The annual failure probabilities and risk for each reservoir level range are
shown on Table 7.
Table 7 QAL RMD2 annual failure probabilities and risk for Stage 8 operation QAL RMD2 probabilités de rupture annuelle et risque lors la phase 8
Flood Range Annual Failure
Probability Percentage
of Total Risk
(lives/yr) Percentage of Total Risk
2 to 3m below Spillway Crest Level 1.79E-05 34.0% 4.48E-06 29.7% SCL to 2m below SCL 1.34E-05 25.5% 3.92E-06 25.9% Flood Range 1 1.44E-05 27.3% 4.37E-06 28.9% Flood Range 2 5.05E-06 9.6% 1.61E-06 10.7% Flood Range 3 (10,000 to PMP-DF) 1.79E-06 3.4% 6.83E-07 4.5% PMP-DF 1.00E-07 0.191% 4.59E-08 0.3% Totals 5.26E-05 100.0% 1.51E-05 100.0%
The risk for the piping through the embankments above RL 15 m is shown
on Table 8, which confirms that the majority of the risk is associated with piping above RL 15 m for Dam E, which contributes 87% of the total risk.
Table 8 QAL RMD2 Summary data for piping through the embankment above RL 15 m QAL RMD2 Sommaire des données de l’ erosion interne à travers le remblai
avec un niveau superieur á 15 m
Dam Risk (lives/annum)
Percent of Total Risk (%)
A/C 2.72E-7 2.5% D 6.62E-8 0.5% E 1.31E-5 87%

2.8. CONCLUSIONS FROM THE RISK ANALYSIS
The Societal and individual risks were found to be below the ANCOLD tolerable limits for existing dams.
The use of the risk approach enabled the design for the labyrinth spillway and the use of the safety bunds to be evaluated and approved for the Stage 8 construction, despite the concerns over the seepage noted at Dam E and the potential for high reservoir levels during the PMP design flood.
The potential for overtopping failure during the extreme floods was evaluated using current wind and wave analysis methods to determine the overtopping discharges and compare this with trigger flows for onset and continuation of erosion. The analyses clearly showed that the extreme floods (PMP-DF), while having a relatively high probability of breach were small contributors (0.3%) to the total risk.
Dam E was found to contribute 92.7% of the total risk of dam failure with 87% being attributed to the seepage observed above RL 15 m. While the overall risk was below the limit of tolerability, the significant contribution to risk of this seepage area confirmed the requirement for ongoing visual observations for signs of potential increased seepage and onset of piping on this dam during the operation of the TSF.
REFERENCES [1] AUSTRALIAN NATIONAL COMMITTEE ON LARGE DAMS (ANCOLD),
2003, Guidelines on Risk Assessment, ANCOLD, Sydney. [2] USBR, USACE, UNSW and URS, 2008, Risk Analysis for dam Safety, A
unified method for Estimating Probabilities of failure of Embankment dams by Internal Erosion and Piping, August 2008
[3] UNITED STATES ARMY CORPS OF ENGINEERS (USACE), 2002, Coastal Engineering Manual, Engineer Manual EM-1110-2-1100, USACE, Washington, D.C (in 6 volumes).
[4] SCHUTTRUMPF, H., 2003, Wave overtopping flow on seadikes - experimental and theoretical investigations, PIANC Bulletin No 114-2003.
[5] HEWLETT 1987, HEWLETT, H.W.M., BOORMAN, L.A & BRAMLEY, M.E., Design of Reinforced Grass Waterways (CIRIA REPORT 116), Construction Industry Research and Information Association, London.
[6] DEWEY & OAKS, 1990, The Determination of Failure of an Embankment Dam by Overtopping, Technical Memorandum No MISC-3620-1, USBR
[7] BARNEICH J., MAJORS D., MORIWAKI Y., KULKAMI R. and DAVIDSON R., Application of reliability analysis in the environmental

impact report (EIR) and design of a major dam project, Proceedings of Uncertainty 1996, Geotechnical Engineering Division, ASCE, August 1996
[8] UNITED STATES DEPARTMENT OF THE INTERIOR BUREAU OF RECLAMATION (USBR), 1999, A Procedure for Estimating Loss of Life Caused by Dam Failure, USBR Dam Safety Office, Denver, Colorado.
SUMMARY
The Queensland Alumina Limited (QAL) tailings storage facility (TSF) comprises four embankments up to about 20 m high storing a total of 13.5 million m3 of water at the spillway level. The original spillway was raised in 2010 using a labyrinth spillway to increase the discharge capacity while maintaining the existing embankment crest level.
The current capacity increase by raising the labyrinth level 1 m incorporated a minimalist approach for raising two of the embankments including the use of the safety bunds for wave overtopping protection. Flood routing found that the main embankment crest for these embankments would be overtopped by 120 mm and the freeboard at the safety bund would be 280 mm when passing the probable maximum design flood (PMP-DF). The potential for overtopping failure during the extreme floods was evaluated using current wind and wave analysis techniques to determine the overtopping discharges and compare this with trigger flows for onset and continuation of erosion. The analyses clearly showed that the extreme floods (PMP-DF), while having a relatively high probability of breach were small contributors (0.3%) to the total risk.
Significant seepage was noted on one of the four dam walls forming the TSF where the internal filter layer was curtailed to accommodate future development. This was also the location where the construction process resulted in a relatively pervious layer through the embankment. There are also significant variations in cross section for the four dam walls for which the risk analysis was the only means of evaluating the piping performance of each wall under the increased flood loading.
The use of the risk approach enabled the design for the labyrinth spillway and the use of the safety bunds for wave overtopping protection to be evaluated and approved for the Stage 8 construction, despite the concerns over the seepage and the potential for high reservoir levels during the PMP-DF.
Keywords: Risk Analysis, failure modes analysis, piping, overtopping failure, safety bunds

RÉSUMÉ
Les barrage de stockage de boue rouge de la companie Queensland Alumina ( QAL) comprennent 4 digues qui peuvent atteindre une hauteur de 20 m et contenir jusqu’ á 13.5 million m³ d’ eau au niveau de la crête du déversoire.
Le deversoire original a ete réhaussé en 2010 par un déversoire en labyrinth pour augmenter sa capacitée tout en maintenant constant le niveau de la digue.
L’ augmentation de la capacité par le rehaussement du niveau du déverrsoire labyrinth a inclut une approche minimal pour le réhaussment de 2 des digues. En particulier cette appproche a adoptee l’ utitilsation de digue de securitées pour protéger du debordement lié aux vagues.
Une analyse du bilan hydrique a demontré que la créte de la digue principale est dépassé par 120 mm et la revanche de la digue de securité est á 280 mm durant la crue probable maximal. La possibilitée d’ une rupture liée a un débordement durant un crue extreme a été évalue par l’ analyse du debit de débordement associé avec une analyse du vent et des vagues. Ce debit a été comparé avec le debit necessaire a la formation de l’ érosion de la digue.
Cette analyse a clairement montrée que bien que les crues éxtrémes est une chance relativement elever de developer une rupture de la digue elles ne forment qu’ une petite contribution (0.3 %) du risqué total.
Un important probléme d’ infiltration a été observe sur l’ un des quatres barrage de stockage de boue rouge oú la couche filtrante interne a été raccourcis pour s’ adapter aux project future. C’ etait aussi a ce meme endroit que durant la construction une couche relativement permeable a été installée a travers la digue. On trouve aussi des variations considerables dans la coupe transversale des 4 murs du barrages. Une analyse des risques etait la seule method capable d’ evaluer le risque d’ erosion interne sous la force d’ une crue.
Lors la phase 8 de la construction, la conception du déversoire labyrinth ainsi que de la digue de sécuritée a été evalué et autorisé par une métode basée sur une analyse des risques bien qu’ il y ait eut des inquiétudes sur l’ infiltration et le haut niveau d’ eau durant la crue maximal probable.
Mots-clés: analyse des risques, l'analyse des modes de rupture, de l erosion interne, rupture par débordement, digue de sécurité