Embed Size (px)
Citation preview

Introduction11.1 What is pinch analysis?
Figure 1.1(a) shows an outline flowsheet representing a traditional design for thefront end of a specialty chemicals process. Six heat transfer “units” (i.e. heaters, cool-ers and exchangers) are used and the energy requirements are 1,722kW for heatingand 654kW for cooling. Figure 1.1(b) shows an alternative design which was gener-ated by Linnhoff et al. (1979) using pinch analysis techniques (then newly devel-oped) for energy targeting and network integration. The alternative flowsheet usesonly four heat transfer “units” and the utility heating load is reduced by about 40%
Reactor
Reactor
Steam
Steam
70
1
1652
6543 2
Coolingwater
Feed
H
C
MM
(a) Design as usual
� 1722
� 6546 units
H
C
MM
(b) Design with targets
� 1068
� 04 units
Product
Recycle
Feed Product
3
2
1
RecycleSteam
1068
Figure 1.1 Outline flowsheets for the front end of a specialty chemicals process
Ch001.qxd 09/10/2006 11:50 Page 1

Pinch Analysis and Process Integration2
with cooling no longer required. The design is as safe and as operable as the tradi-tional one. It is simply better.
Results like this made pinch analysis a “hot topic” soon after it was introduced. Benefitswere found from improving the integration of processes, often developing simpler, moreelegant heat recovery networks, without requiring advanced unit operation technology.
There are two engineering design problems in chemical processes. The first is theproblem of unit operation design and the second is the problem of designing totalsystems. This book addresses the system problem, in particular design of the processflowsheet to minimise energy consumption.
The first key concept of pinch analysis is setting energy targets. “Targets” forenergy reduction have been a key part of energy monitoring schemes for many years.Typically, a reduction in plant energy consumption of 10% per year is demanded.However, like “productivity targets” in industry and management, this is an arbitraryfigure. A 10% reduction may be very easy on a badly designed and operated plantwhere there are many opportunities for energy saving, and a much higher targetwould be appropriate. However, on a “good” plant, where continuous improvementhas taken place over the years, a further 10% may be impossible to achieve. Ironically,however, it is the manager of the efficient plant rather than the inefficient one whocould face censure for not meeting improvement targets!
Targets obtained by pinch analysis are different. They are absolute thermodynamictargets, showing what the process is inherently capable of achieving if the heatrecovery, heating and cooling systems are correctly designed. In the case of the flow-sheet in Figure 1.1, the targeting process shows that only 1,068kW of external heat-ing should be needed, and no external cooling at all. This gives the incentive tofind a heat exchanger network which achieves these targets.
1.2 History and industrial experience
The next question is, are these targets achievable in real industrial practice, or arethey confined to paper theoretical studies?
Pinch analysis techniques for integrated network design presented in this guide wereoriginally developed from the 1970s onwards at the ETH Zurich and Leeds University(Linnhoff and Flower 1978; Linnhoff 1979). ICI plc took note of these promising tech-niques and set up research and applications teams to explore and develop them.
At the time, ICI faced a challenge on the crude distillation unit of an oil refinery. Anexpansion of 20% was required, but this gave a corresponding increase in energydemand. An extra heating furnace seemed the only answer, but not only was this verycostly, there was no room for it on the plant. It would have to be sited on the otherside of a busy main road and linked by pipe runs – an obvious operability problemand safety hazard. Literally at the 11th hour, the process integration teams were calledin to see if they could provide an improved solution.
Within a short time, the team had calculated targets showing that the processcould use much less energy – even with the expansion, the targets were lower thanthe current energy use! Moreover, they quickly produced practical designs for a heat
Ch001.qxd 09/10/2006 11:50 Page 2

3Introduction
exchanger network which would achieve this. As a result, a saving of over a millionpounds per year was achieved on energy, and the capital cost of the new furnace withits associated problems was avoided. Although new heat exchangers were required,the capital expenditure was actually lower than for the original design, so that bothcapital and operating costs had been slashed! Full details of the project are given asthe first of the case studies in Chapter 9 (Section 9.2).
It is hardly surprising that after this, ICI expanded the use of pinch analysis through-out the company, identifying many new projects on a wide variety of processes, fromlarge-scale bulk chemical plants to modestly sized specialty units. Energy savingsaveraging 30% were identified on processes previously thought to be optimised(Linnhoff and Turner 1981). The close co-operation between research and applicationteams led to rapid development; new research findings were quickly tried out in prac-tice, while new challenges encountered on real plant required novel analysis methodsto be developed. Within a few years, further seminal papers describing many of thekey techniques had been published (Linnhoff and Hindmarsh 1983; Linnhoff et al.1983; Townsend and Linnhoff 1983). From this sprang further research, notably theestablishment of first a Centre and then the world’s first dedicated Department ofProcess Integration at UMIST, Manchester (now part of the new School of ChemicalEngineering and Analytical Science at Manchester University).
The techniques were disseminated through various publications, including thefirst edition of this user guide (Linnhoff et al. 1982) and three ESDU Data Items(1987–1990), and through training courses at UMIST. Applications in industry alsoforged ahead; Union Carbide, USA, reported even better results than ICI, mainly due to progress in the understanding of how to effect process changes (Linnhoffand Vredeveld 1984). BASF, Germany, reported completing over 150 projects andachieving site-wide energy savings of over 25% in retrofits in their main factory inLudwigshafen (Korner 1988). They also reported significant environmental improve-ments. There have been many papers over the years from both operating companiesand contractors reporting on the breadth of the technology, on applications, and onresults achieved. In all, projects have been reported in over 30 countries. Studies par-tially funded by the UK Government demonstrated that the techniques could beapplied effectively in a wide range of industries on many different types of processes(Brown 1989); these are described further in Chapter 8. Pinch-type analysis has alsobeen extended to situations beyond energy usage, notably to wastewater minimisa-tion (Wang and Smith 1994, 1995; Smith 2005) and the “hydrogen pinch” (Alves 1999;Hallale and Liu 2001); these are extensive subjects in their own right and are not cov-ered in this book.
Pinch analysis was somewhat controversial in its early years. Its use of simple con-cepts rather than complex mathematical methods, and the energy savings and designimprovements reported from early studies, caused some incredulity. Moreover, pinchanalysis was commercialised early in its development when there was little know-how from practical application, leading to several commercial failures. Divided opin-ions resulted; Morgan (1992) reported that pinch analysis significantly improves boththe “process design and the design process”, whereas Steinmeyer (1992) was con-cerned that pinch analysis might miss out on major opportunities for improvement.Nevertheless, the techniques have now been generally accepted (though more
Ch001.qxd 09/10/2006 11:50 Page 3

widely adopted in some countries than others), with widespread inclusion in under-graduate lecture courses, extensive academic research and practical application inindustry. Pinch analysis has become a mature technology.
1.3 Why does pinch analysis work?
The sceptic may well ask; why should these methods have shown a step change overthe many years of careful design and learning by generations of highly competentengineers? The reason is that, to achieve optimality in most cases, particular insightsare needed which are neither intuitively obvious nor provided by common sense.
Let us simplify the question initially to producing a heat recovery arrangementwhich recovers as much heat as possible and minimises external heating and cooling(utilities). At first sight, in a problem comprising only four process streams, this mayseem an easy task. The reader might therefore like to try solving a simplified exampleproblem comprising four process streams (two hot and two cold) similar to theprocess example of Figure 1.1, the data for which are given in Table 1.1. Interchangersmay not have a temperature difference between the hot and cold streams (∆ Tmin) ofless than 10°C. Steam which is sufficiently hot and cooling water which is sufficientlycold for any required heating and cooling duty is available. After trying this example,the reader will probably agree that it is not a trivial task. Admittedly it is relatively easyto produce some form of basic heat recovery system, but how do you know whetherit is even remotely optimal? Do you continue looking for better solutions, and if so,how? However, if you know before starting what the energy targets are for this prob-lem, and the expected minimum number of heat exchangers required, this providesa big stimulus to improving on first attempts. If you are then given key informationon the most constrained point in the network, where you must start the design, thisshows you how to achieve these targets. We will be returning to this example datasetin Chapter 2 and throughout the guide. The value of the pinch-based approach isshown by the fact that a plausible “common-sense” heat recovery system, developedin Chapter 2, falls more than 10% short of the feasible heat exchange and uses no lessthan two-and-a-half times the calculated hot utility target!
How does this relate to practical real-life situations? Imagine a large and complexprocess plant. Over the years, new ideas are thought of for ways to reduce energy.
Pinch Analysis and Process Integration4
Table 1.1 Data for four-stream example
Process stream Heat capacity Initial (supply) Final (target) Stream heat number and flowrate temperature temperature load (kW) (positive type (kW/°C) (°C) (°C) for heat release)
(1) cold 2.0 20 135 2.0 � (20–135) � �230(2) hot 3.0 170 60 3.0 � (170–60 ) � 330(3) cold 4.0 80 140 4.0 � (80–140) � �240(4) hot 1.5 150 30 1.5 � (150–30 ) � 180
∆Tmin � 10°C
Ch001.qxd 09/10/2006 11:50 Page 4

However, as “retrofitting” – changes to an existing plant – is more difficult and expen-sive than altering the design of a new plant; many of these ideas have to wait forimplementation until a “second generation” plant is designed. Further experience thenleads to further ideas, and over many years or decades, the successive designs are(hopefully!) each more energy-efficient than the last.
Boland and Linnhoff (1979) gave an example of this from one of the earliest pinchstudies. Figure 1.2 shows the improvement in energy consumption which wasachieved by successive designs for a given product. The successive designs lie on a“learning curve”. However, calculation of energy targets as described later revealedsuddenly that the ultimate performance, given correct integration, would lie quite abit further down the “learning curve”. This information acted as an enormous stimu-lus to the design team. Within a short period they produced a flowsheet virtually “hit-ting” the ultimate practical target.
Obviously, if a completely new process is being designed, pinch analysis allows oneto hit the target with the first-generation plant, avoiding the learning curve completely.
Although improvement targets can be stated based on learning curves (e.g. aim for a 10% reduction in the next generation plant), we see that these are merely basedon an extrapolation of the past, while pinch analysis sets targets based on an object-ive analysis.
1.4 The concept of process synthesis
“But pinch analysis is just about heat exchanger networks, isn’t it?” That’s a commonresponse from people who’ve heard about the techniques in the past. Implicit in thisis the question; isn’t it only applicable to oil refineries and large bulk chemical plants,and maybe not to my process?
Introduction 5
New designs bytraditional methods
Modified flowsheetbased on systematic
techniques forthermal integrationMinimum
Energy consumptionConsistent units
Successive plants
Newdesign
Exitingprocess
Lastprocess
0
1.0
2.0
3.0
4.0
5.0
6.0
Figure 1.2 Beating the learning curve
Ch001.qxd 09/10/2006 11:50 Page 5

In fact, experience has showed that pinch analysis can bring benefits in a huge rangeof plants and processes, large and small, both within and outside the “traditional” processindustries. This is borne out by the applications and case studies described in Chapters 8and 9. Improvements come not only from heat recovery projects, but also from changingprocess conditions, improved operability and more effective interfacing with utility sys-tems, all underpinned by better process understanding. Pinch analysis has broadeneda long way beyond the original studies. It is now an integral part of the overall strat-egy for process development and design, often known as process synthesis, and theoptimisation of existing plants.
The overall design process is effectively represented by the onion diagram,Figure 1.3. Process synthesis is hierarchical in nature (Douglas 1988). The core of theprocess is the chemical reaction step, and the reactor product composition and feedrequirements dictate the separation tasks (including recycles). Then, and only then,can the designer determine the various heating and cooling duties for the streams,the heat exchanger network and the requirements for heating and cooling. Thedesign basically proceeds from the inside to the outside of the “onion”.
Figure 1.4 shows a more detailed flowsheet for the front end of the specialty chem-icals process which was shown in Figure 1.1. The four tasks in the layers of the onionare all being performed, namely reaction, separation, heat exchange and externalheating/cooling.
The design of the reactor is dictated by yield and conversion considerations, andthat of the separator by the need to flash off as much unreacted feed as possible. Ifthe operating conditions of these units are accepted, then the design problem thatremains is to get the optimum economic performance out of the system of heatexchangers, heaters and coolers. The design of the heat exchange system or “net-work” as it stands in Figure 1.4 may not be the best and so it is necessary to go backto the underlying data that define the problem.
The basic elements of the heat recovery problem are shown in Figure 1.5. All theexchangers, heaters and coolers have been stripped out of the flowsheet and whatremains therefore is the definition of the various heating and cooling tasks. Thus
Pinch Analysis and Process Integration6
Reaction
Chemical synthesis
Separation
Process development
Heat exchanger network
Heat recovery
Utility heating/cooling, pumps and compressors
Site heat and power systems
Design process
Figure 1.3 The onion diagram for process synthesis
Ch001.qxd 09/10/2006 11:50 Page 6

one stream, the reactor product, requires cooling from reactor exit temperature to separator temperature. Three streams require heating, these being reactor feed(from fresh feed storage temperature to reactor inlet temperature), recycle (fromrecycle temperature to reactor inlet temperature) and the “front end” product (fromseparator temperature to the temperature needed for downstream processing).Therefore the problem data comprise a set of four streams, one requiring coolingand three requiring heating, whose endpoint temperatures are known and whosetotal enthalpy changes are known (from the flowsheet mass balance and physicalproperties). The design task is to find the best network of exchangers, heaters andcoolers, that handles these four streams at minimum operating and annualised cap-ital cost, consistent with other design objectives such as operability. This was the
Introduction 7
5
3
1
4
2
9.634200°C
200°C
190°C
153°C
141°C
115.5°C
Feed5°C
19.5 bar
128°C 17.6 bar 17.3 bar
16.7 bar
114°C
35°C
126°C
16 barRecycle
To column
35°C
CW
Purge
0.1791.614
7.841
1.089
40°C2.703
6.931
18.2 bar
D 201
Figure 1.4 Flowsheet for specialty chemicals process
Ch001.qxd 09/10/2006 11:50 Page 7

scope of pinch analysis in its first applications, exemplified by the network designtechniques in Chapter 4.
However, the process can be optimised by going beyond the “one-way street”described above. For example, the configuration and operating conditions of the sep-aration system (and, more rarely, the reactor) can be altered to fit better with the restof the heating and cooling tasks in the process, as explained in Chapter 6. The pres-sures, temperatures and phase equilibria in the process determine the need forpumps, compressors and expanders, but this is also affected by the network config-uration, especially pressure drops through exchangers and long pipe runs. The over-all heat and power needs of the site are evaluated, and a combined heat and power(CHP) system can be considered to fulfil these (Chapter 5). This may alter the relativecosts of different utility levels, and thus change the incentive for heat recovery. Totalsite analysis becomes important, and a wider range of targeting techniques (Chapter3) helps us to understand the complex interactions. Batch processes require refine-ments to the analysis, and these can also be applied to other time-dependent situ-ations, such as start-up and shutdown, as described in Chapter 7. Thus, pinch analysisand process integration have grown from a methodology for the heat recoveryproblem alone to a holistic analysis of the total process. The practical outworkingof this is described in Chapter 8 and in the range of case studies in Chapter 9.
Pinch Analysis and Process Integration8
200°C
200°C
35°C
35°C
126°C
5°C
Reactor Product
Product
∆H � 2570
∆H � 413
Recycle
Feed
Purge� Tops
For each stream: TInitial, TFinal, H � f(T)
∆H � 2233 ∆H � 992
Reactor
Figure 1.5 Heat exchange duties for specialty chemicals process
Ch001.qxd 09/10/2006 11:50 Page 8

1.5 The role of thermodynamics in process design
1.5.1 How can we apply thermodynamics practically?
Most of us involved in engineering design have somewhat unhappy memories think-ing back to thermodynamics in college days. Either we did not understand, gave uphope that we ever would, and remember with dread the horror that struck on exam-ination day. Alternatively, we were amongst the chosen few whose photographicmemory would allow us to reiterate the definitions of entropy, Gibbs free energyand all those differential equations faultlessly, but without real understanding. After-wards, we could never help asking ourselves: what is it all for? What do I do with it?In the best of cases, thermodynamics seemed to be a fascinating science without areal application.
Pinch analysis is based on straightforward thermodynamics, and uses it in a prac-tical way. However, the approach is largely non-mathematical. Although (classical)thermodynamics itself may be a thoroughly developed subject, we need to apply itthe context of practical design and operation. This is the aim of the following chap-ters. We distinguish between “inevitable” and “avoidable” thermodynamic losses, and“practical” or “ideal” performance targets, to achieve both energy savings and otherprocess benefits.
1.5.2 Capital and energy costs
Sometimes, it is believed that energy recovery is only important if energy costs arehigh and capital costs are low. Consider, for example, Figure 1.6, which shows a heatexchanger network that would seem appropriate to most when energy is cheap andcapital expensive. There is no process heat recovery – only utility usage. Conversely,Figure 1.7 shows a network which might seem appropriate when energy is expen-sive. There is as much process heat recovery as is possible in preference to utilityusage. The implicit assumption is that heat recovery (instead of utility use) savesenergy but costs capital.
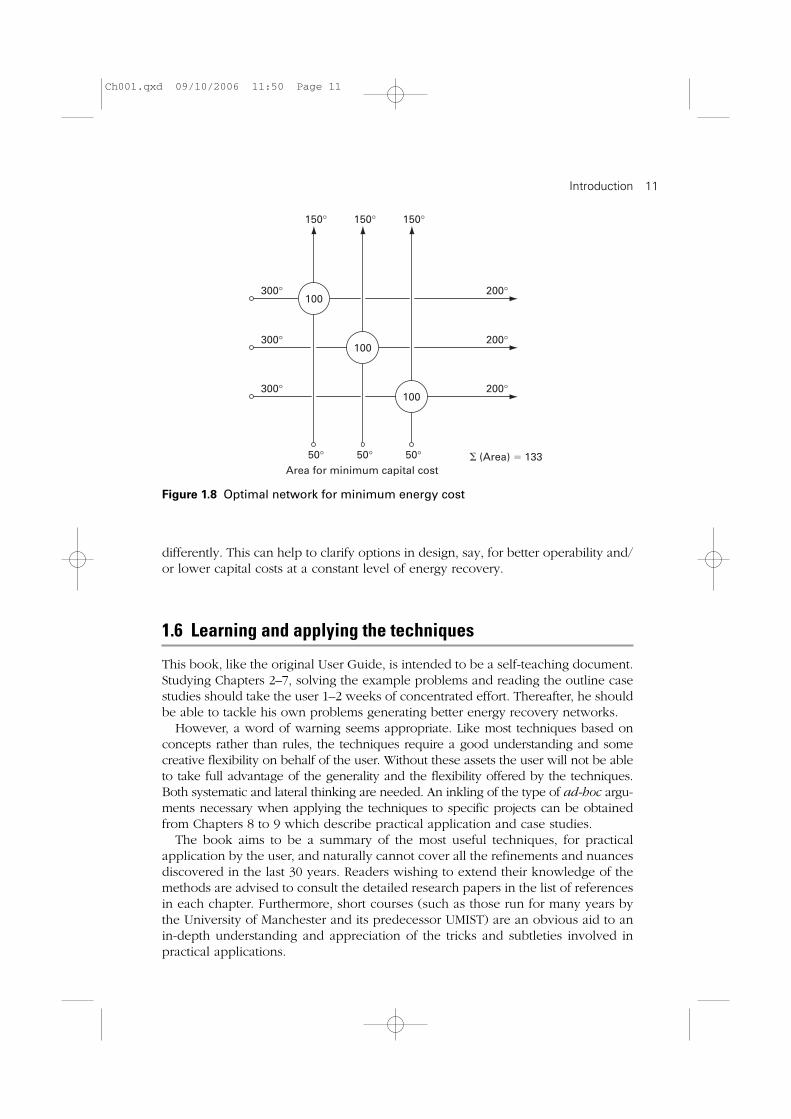
Consider now Figure 1.8. This shows a simpler network which still achieves max-imum energy recovery. Based on a uniform heat transfer coefficient and sensiblesteam and cooling water temperatures, the total surface area for both designs hasbeen evaluated. To our surprise, the “network for minimum capital cost” turns out tohave the higher total surface area, and is more expensive in capital cost as well asoperating (energy) cost!
From this example we realise that in networks there are two basic thermodynamiceffects influencing capital costs. One is the effect of driving forces and the other isthe effect of heat loads. Evidently, as we go to tighter designs (i.e. to reduce driv-ing forces) we need less utility and the overall heat load decreases. Capital cost thenincreases with reduced driving forces (we all know that) but decreases with reducedheat load (we rarely consider this point). The design without process heat recov-ery in Figure 1.6 handles twice as much heat as is necessary. As a result, capital costsare increased even though the driving forces are large!
Introduction 9
Ch001.qxd 09/10/2006 11:50 Page 9

Although this is obviously a contrived example, it helps to shows that there isnot necessarily a trade-off between energy and capital cost, and helps to explainthe frequent capital savings (as well as energy) observed in practical case studies.
Thermodynamics-based techniques can help in many other ways. For example,the analysis of driving forces may be used not to reduce them but to distribute them
Pinch Analysis and Process Integration10
CP � 1.0
CP � 1.0
CP � 1.0
CP � 1.0 CP � 1.0CP � 1.0
300°
300°
300° 200°
200°
200°
150° 150° 150°
50° 50° 50°
Area for minimum capital cost
Steam (400°F)
Cooling water(90°–110°F)
� (Area) � 204
100
100
100
100100100
Figure 1.6 Outline heat exchanger network for “minimum capital cost”
300°
300°
300°
150° 150° 150°
200°
200°
200°
50° 50° 50°
Steam
Cooling water
Figure 1.7 Outline network for “minimum energy cost”
Ch001.qxd 09/10/2006 11:50 Page 10
differently. This can help to clarify options in design, say, for better operability and/or lower capital costs at a constant level of energy recovery.
1.6 Learning and applying the techniques
This book, like the original User Guide, is intended to be a self-teaching document.Studying Chapters 2–7, solving the example problems and reading the outline casestudies should take the user 1–2 weeks of concentrated effort. Thereafter, he shouldbe able to tackle his own problems generating better energy recovery networks.
However, a word of warning seems appropriate. Like most techniques based onconcepts rather than rules, the techniques require a good understanding and somecreative flexibility on behalf of the user. Without these assets the user will not be ableto take full advantage of the generality and the flexibility offered by the techniques.Both systematic and lateral thinking are needed. An inkling of the type of ad-hoc argu-ments necessary when applying the techniques to specific projects can be obtainedfrom Chapters 8 to 9 which describe practical application and case studies.
The book aims to be a summary of the most useful techniques, for practicalapplication by the user, and naturally cannot cover all the refinements and nuancesdiscovered in the last 30 years. Readers wishing to extend their knowledge of themethods are advised to consult the detailed research papers in the list of referencesin each chapter. Furthermore, short courses (such as those run for many years bythe University of Manchester and its predecessor UMIST) are an obvious aid to anin-depth understanding and appreciation of the tricks and subtleties involved inpractical applications.
Introduction 11
300°
300°
300° 200°
200°
200°
150° 150° 150°
50° 50° 50°Area for minimum capital cost
� (Area) � 133
100
100
100
Figure 1.8 Optimal network for minimum energy cost
Ch001.qxd 09/10/2006 11:50 Page 11

References
Alves, J. (1999). Design and Analysis of Refinery Hydrogen Distribution Systems,PhD Thesis, UMIST, Manchester, UK.
Boland, D. and Linnhoff, B. (1979). The preliminary design of networks for heatexchange by systematic methods, Chem Eng, 9–15, April.
Brown, K. J. (1989). Process Integration Initiative. A Review of the Process IntegrationInitiatives Funded under the Energy Efficiency R&D Programme. (EnergyTechnology Support Unit (ETSU), Harwell Laboratory, Oxfordshire, UK.)
Douglas, J. M. (1988). Conceptual Design of Chemical Processes. McGraw-Hill, New York.
ESDU Data Item 87001 (1987). Process Integration. Available by subscription fromESDU International Ltd, London. (Engineering Sciences Data Unit.)
ESDU Data Item 89030 (1989). Application of process integration to utilities, combinedheat and power and heat pumps. ESDU International.
ESDU Data Item 90017 (1987–1990). Process integration; process change and batchprocesses. ESDU International.
Hallale, N. and Liu, P. (2001). Refinery hydrogen management for clean fuel produc-tion, Adv Environ Res, 6: 81–98.
Korner, H. (1988). Optimal use of energy in the chemical industry, Chem Ing Tech,60(7): 511–518.
Linnhoff, B. (1979). Thermodynamic Analysis in the Design of Process Networks, PhDThesis, University of Leeds.
Linnhoff, B., Dunford, H. and Smith, R. (1983). Heat integration of distillation columnsinto overall processes, Chem Eng Sci, 38(8): 1175–1188.
Linnhoff, B. and Flower, J. R. (1978). Synthesis of heat exchanger networks. Part I:Systematic generation of energy optimal networks, AIChE J, 24(4): 633–642. Part II:Evolutionary generation of networks with various criteria of optimality, AIChE J,24(4): 642–654.
Linnhoff, B. and Hindmarsh, E. (1983). The pinch design method of heat exchangernetworks, Chem Eng Sci, 38(5): 745–763.
Linnhoff, B., Mason, D. R. and Wardle, I. (1979). Understanding heat exchanger net-works, Comp Chem Eng, 3: 295.
Linnhoff, B., Townsend, D. W., Boland, D., Hewitt, G. F., Thomas, B. E. A., Guy, A. R.and Marsland, R. H. (1982). User Guide on Process Integration for the Efficient Useof Energy, 1st edition. IChemE, Rugby, UK. Revised 1st edition 1994.
Linnhoff, B. and Turner, J. A. (1981). Heat-recovery networks: new insights yield bigsavings, Chem Eng, 56–70, November 2.
Linnhoff, B. and Vredeveld, D. R. (1984). Pinch technology has come of age, ChemEng Prog, 33–40, July.
Morgan, S. (1992). Use process integration to improve process designs and the designprocess, Chem Eng Prog, 62–68, September.
Polley, G. T. and Heggs, P. J. (1999). Don’t Let the “Pinch” Pinch You, ChemicalEngineering Progress, AIChE, Vol. 95, No. 12, pp 27–36, December.
Smith, R. (2005). Chemical Process Design and Integration. John Wiley, Chichesterand New York.
Pinch Analysis and Process Integration12
Ch001.qxd 09/10/2006 11:50 Page 12

Steinmeyer, D. (1992). Save energy, without entropy, HydroCarb Process, 71: 55–95,October.
Townsend, D. W. and Linnhoff, B. (1983). Heat and power networks in process design.Part 1: Criteria for placement of heat engines and heat pumps in process net-works, AIChE J, 29(5): 742–748. Part II: Design procedure for equipment selectionand process matching, AIChE J, 29(5): 748–771.
Wang, Y. P. and Smith, R. (1994). Wastewater minimisation, Chem Eng Sci, 49: 981.Wang, Y. P. and Smith, R. (1995). Wastewater minimisation with flowrate constraints,
Trans I ChemE Part A, 79: 889–904.Linnhoff, B., Tainsh, R. and Wasilewski, M. (1999). Hydrogen network management.
A systems approach from using paper presented at: The European RefiningTechnology Conference, Paris, November.
Introduction 13
Ch001.qxd 09/10/2006 11:50 Page 13

Ch001.qxd 09/10/2006 11:50 Page 14