Embed Size (px)
Citation preview
1.1. The scope and goals of this work
This Atlas of North American English [ANAE] is a record of the regional dialects of English spoken in the urbanized areas of the United States and Canada in the years 1992 to 1999.1 It provides the first comprehensive view of the pronunciation and phonology of English across the North American continent. The Atlas builds on the work of American dialectologists from 1933 to the present, particularly the work of Hans Kurath and Raven McDavid in the Atlantic States. ANAE rep-resents new departures in American dialectology in several respects: it provides information on perception as well as production, on acoustic measurements as well as impressionistic ratings, on the realization of phonemic categories as well as phonetic forms, and on phonological systems as well as individual phonemes. Most importantly, it provides a view of the systematic sound changes in progress that are responsible for increasing diversity among the regional dialects of North America.
The design of the Atlas is a response to the fact that traditional methods of sampling the United States produced only a fragmentary view of American lin-guistic geography. The methodical procedures of traditional dialect geography – the creation of a spatial grid, the training of field workers, the selection and in-terviewing of informants – were completed for the eastern United States, but for not more than a scattering of other states and areas. Furthermore, the conservative character of these methods in both sampling and analysis inhibited recognition of the vigorous linguistic changes taking place in large cities. Recent sociolinguistic studies show that extensive changes can go to completion within two or three generations.2 It follows that a valid study of the phonology of the North Ameri-can continent would have to be completed within five or ten years. Otherwise, the differentiation of regional dialects could not be distinguished from different temporal stages of a common process.
The Atlas is based upon the Telsur telephone survey (Chapter 4), which uses the technology of telephone interviewing to create a sample sensitive to both population and geography. The basic sample represents all urbanized areas of North America with a population of over 50,000; a number of smaller cities are added to achieve a more even geographic coverage. The total number of speakers of English represented is 68 percent of the population of North America (Table 11.2). This limitation to urbanized areas means that the Atlas contains no infor-mation on rural and small town areas that are important to an understanding of the development of North American English; such enclaves as Marthaʼs Vineyard, or the Outer Banks of North Carolina, or the rural southeastern area of Ohio are not represented. The Atlas view of any one urbanized area is limited to a small number of speakers – two in most cases – so that it cannot be considered defini-tive for any one community. A sample of two or three speakers for a given city cannot reveal the social differentiation of linguistic variables, although it may show that the city is representative of a larger region. For these larger regions, the diversity of age and education in the speakers sampled will provide a limited report on social differentiation. The Atlas is designed to produce an overall view of regional patterns that will guide and stimulate local studies to provide a more detailed view of the sociolinguistic and geographic variation in a given area.3
Given the mobility and diversity of the American population, it seems un-likely that the Telsur sampling procedure would produce clear regional patterns. In 1990, 39.2 percent of the U.S. population was born in a different state from the one in which they then lived, with considerable variation by state (from Penn-sylvania, at 19.8 percent to Nevada, at 78.2 percent).4 In some areas, Atlas inter-viewers had to contact a great many individuals to find one local person (Chapter 4). Moreover, the speakers who are the targets of the Telsur survey are in frequent contact with people born in other areas, and it might seem that such interac-tion would lead to leveling and confusion of local dialect patterns. One might therefore want to limit the search to relatively isolated individuals who have had minimal contact with outsiders. Nevertheless, the Atlas design is based on the premise that the first two local residents to answer their telephones – people who were born or raised in the speech community – could be taken to represent ad-equately the linguistic pattern of that community. It was proposed to the funding agencies – NSF, NEH, and Nortel – that such a telephone inquiry would yield coherent geographic patterns, rather than a random mixture of traits derived from a variety of dialects in contact. In fact, the Atlas data does show clearly defined and relatively homogeneous patterns of regional distribution of phonological and phonetic features. This can be seen most clearly in the maps of Chapter 10, which display unselected geographic distributions of formant values for all vowels. These and other maps to follow will allow users themselves to judge whether the Atlas strategy has succeeded in locating geographic patterns of interest.
If the ANAE sampling method has in fact succeeded, it must be asked, how is such success possible? Sociolinguistic studies of large cities like New York, Detroit, Memphis, or Philadelphia have shown that a minimum of 25 speakers is needed to give a clear record of the socio-economic stratification of linguistic variables, and 80 to 100 subjects are needed if gender and ethnic differentiation are to be considered as well. ANAE, however, is not a study of social varia-tion within individual cities. The Atlas traces the geographic distribution of the dynamic patterns that define the direction of change for the regional dialect, de-fined by the larger phonological or phonetic patterns that are common across it. Regional dialects like the North, South, West, or Midland are represented by 50 to several hundred speakers. Within these larger units, ANAE can trace social dif-ferentiation by gender, social class, and age, although the sampling of most cities is not large enough to detect these effects at the city level.
The Atlas focus upon linguistic changes in progress entails that the sample cannot be insensitive to age. Chapter 4 will elaborate the sampling procedure in this respect. The telephone numbers are not selected at random, but are chosen from names that are clearly identifiable with the major ethnic groups in that ur-
1 The work as a whole will be referred to as ANAE or “the Atlas.” Earlier atlases of American English will be referred to by their abbreviations [LANE, LAMSAS, etc.].
2 As in New York City (Babbitt 1896; Labov 1966) and Philadelphia (Tucker 1944; Labov 1994).3 A number of such local studies have been completed in recent years. See for example Fridlandʼs
studies of the Southern Shift in Memphis (1998, 1999) and Gordonʼs examination of the North-ern Cities Shift in two small Michigan towns (2001).
4 U.S. Census State of Residence in 1990 by State of Birth: 1990 (90pob).
1. Introduction

Introduction4
banized area. The final sample has a common age distribution across regions and gender (Tables 2.2–3), but an excess of women between 20 and 40, a product of a selection policy to include at least one woman in the 20 to 40 age range – the group that has generally been found to be in the forefront of change. Additional subjects were often interviewed to help fulfill this criterion, and it also governs the selection of subjects for acoustic analysis (440 out of 768) in the main sample.
In the North, the Midland, and the West, the Telsur sample is centered primar-ily on the Euro-American population of North America, the chief exponents of the active sound changes that define regional dialects. Only a few of the speakers in these areas are African-American or Latino. While African-American and La-tino populations of many Northern cities are very large, and in some cases form the majority of the population, it has been consistently reported that they partici-pate to only a limited extent in local and regional dialects (see Section 4.5.2). The most striking aspect of African-American Vernacular English is its supralocal character, so that the many studies of this dialect have found parallel results in New York, Philadelphia, Washington, Chicago, San Francisco, and Los Angeles. In the South, it is a different matter, and any representative sample of regional speech must include African-Americans. In the five largest Southern cities, the Telsur sample will allow us to compare local African-Americans with the Euro-American population (Chapter 22).
Finally, it should be noted that the Atlas is primarily a study of the stressed vowels of North American English, since it is the vowel patterns that differentiate regional dialects of English on this continent. There is data on the vocalization of tautosyllabic /r/, but not the vocalization of /l/, since the telephone signal does not give us reliable information on that process. Chapter 21 contains maps of grammatical and lexical variables. But the main focus of the Atlas is on the vowel systems of each region, and the mergers, splits, and chain shifts that are taking place within those systems.
1.1.1. The separation of linguistics and dialect geography
In the nineteenth century, the results of dialect geography were of major concern to historical linguists, and the relations of diffusion in time and diffusion in space were much discussed. This was partly the consequence of the reliance of the Neo-grammarians on the evidence of dialect geography to support their view of the regularity of sound change (Osthoff and Brugmann 1878; Winteler 1976) and the use of dialect data in reactions against that view (Gilliéron 1918; Malkiel 1967; Labov 1994). But the link between dialect geography and general linguistics all but disappeared, and for the largest part of the nineteenth and twentieth centuries, dialect atlases were produced as works of reference without any immediate con-nection with the issues that concerned theoretical or descriptive linguistics. Many of the editors of dialect atlases took as their explicit goal the systematic compila-tion of data without reference to theoretical issues (e.g. Orton and Dieth 1962).
The separation of dialect geography from linguistic concerns is not unjusti-fied. It responds in part to the desire of scholars to minimize the distortion of the data by theoretical preconceptions (Kretzschmar 2000: 280) and the conviction that the primary task of dialect geography is to present the data.
The business of the linguistic atlas is to provide the evidence, not verdicts ... Those of us on the inside have a responsibility to get the data out, and this we will do, in time, as clearly, fully and objectively as possible. (McDavid et al. 1986: 404–05, cited in Kretzschmar 2000: 208)
It is now generally recognized that theory cannot be avoided so easily, and that theoretical assumptions are bound to enter into the design of the sample and the
questionnaires. To the extent that dialect geography has addressed general issues, it has acted more as a branch of cultural history than of linguistics. The major aim of most dialect geographers has been to explain dialect patterns by settle-ment history (Haag 1898; Kurath 1949, 1972). Traditional dialect geography uses spatial diffusion to reconstruct the external history of the language, rather than its internal history.
The distance from linguistic issues is evident in the design of fieldwork pro-cedures, which rarely take into account the Saussurian principle that language is not a set of forms, but a set of categorical oppositions. The interview schedules of traditional dialectology do not include questions about minimal or near-minimal pairs. One of the major changes taking place in North America is the low back merger – the unconditioned merger of the category /o/ in cot, Don, stock with the category /oh/ in caught, dawn, stalk. The Linguistic Atlas protocols, starting with LANE, do not ask subjects to give their pronunciations of any of these word pairs or their judgments on whether they were the same or different. To decide whether a given subject has the merger or not, it is necessary to make inferences from phonetic forms that were recorded for other purposes. We must therefore operate with the forms given for the words law, salt, dog and oxen in the maps of in The Pronunciation of English in the Atlantic States (Kurath and McDavid 1961 [PEAS]).
The task of interpreting these data is not an easy one, because these words are not matched as minimal pairs, and differences in the consonantal environments may be responsible for any phonetic differences recorded. The number of PEAS maps designed to represent general phonological patterns is limited. The majority represent the lexical incidence of phonemes, data that are useful in tracing settle-ment patterns but of less value for determining the larger phonological patterns of North America.
An atlas is properly a work of reference and not a theoretical tract. One would hope that a successful atlas would be followed by a stream of analytical papers. But the substantial findings of Kurath (1949) and PEAS were not followed by many papers that built on the linguistic implications of their results. While dialect geographers have never been opposed to efforts to account for their data by lin-guistic or historical principles, the tasks of collecting, processing and classifying has taken precedence over interpretation. Kretzschmar notes with acute insight that “the failure of dialectologists to provide analysis of their materials has ac-tually prevented publication of the data” (2000: 281), since reviewers of their proposals for funding did not necessarily share their priorities. He also notes that the greatest contribution of American dialectology has been through preliminary analyses published before most of the data were collected. The same can be said of the Language and Culture Atlas of Ashkenazic Jewry [LCAAJ] (Weinreich 1963).
1.1.2. The renewal of the connection Among early counter-examples to the general avoidance of theoretical matters were studies of the dialect geography of Swiss German by Moulton (1960, 1962), strongly supporting Martinetʼs functional theories of sound change (1952, 1955). In 1963, S. J. Keyser published an insightful review of PEAS, which called atten-tion to the value of data on dialect variation for theories of rule ordering.
The renewed connection between dialect geography and general linguistics was stimulated to a degree by the development of sociolinguistic research and the systematic study of variation within speech communities. The evidence of dialect geography was a major part of the program for developing an empirical founda-
5
tion for the theory of language change by Weinreich, Labov, and Herzog (1968), drawing upon LCAAJ (Weinreich 1963; Herzog 1965).
This connection has been slow in realization. Sociolinguistic studies of large urban communities in the 1960s began with close attention to the stratification of linguistic variables by age, gender, social class, ethnicity, and network density. Most of these studies were of the largest city in the country or urban regions of more than a million in population: New York (Labov 1966), Panama City (Ced-ergren 1973), Sao Paolo (Tarallo 1983), Montreal (Sankoff and Sankoff 1973), Paris (Lennig 1978), Amman (Abdel-Jawad 1981), Belfast (Milroy and Milroy 1978), Teheran (Modaressi 1978), Seoul (Hong 1991; Chae 1995), Tokyo (Hibiya 1988), Cairo (Haeri 1996). These large cities have been found to have their own characteristic patterns of social and stylistic stratification; they influence the sur-rounding territory more than they are influenced by it. The relation of the cityʼs dialect to neighboring speech communities was therefore not in focus. (An excep-tion is Modaressiʼs adjoined study of the neighboring community of Ghazvin.)
The earliest sociolinguistic studies tended to examine the social correlates of isolated linguistic variables but more recent research has focused on structurally related parallel changes and chain shifts. The formulation of general principles governing such shifts was based on a review of long-term historical cases and the close study of a small number of changes in progress (Labov, Yaeger, and Steiner 1972 [LYS]; Labov 1994). LYS reported the Northern Cities Shift to be active in Chicago, Detroit, Buffalo, Rochester, and Syracuse. But it was not possible to say if this major chain shift involved a continuous territory or how it affected the intervening cities. The Southern Shift, moving in the opposite direction, was identified by studies in Knoxville, the Outer Banks, Birmingham, Atlanta, and central Texas, but there was then no clear indication of how far it extended and where – if anywhere – it confronted the Northern Cities Shift.
One of the most important problems in the study of such chain shifts is the explication of their internal mechanism. One theoretical issue concerns the dis-tinction between a drag chain – motivated by a gap in phonological structure – and a push chain, motivated by a decrease in the margin of security between two phonemes. Studies of individual cities rely upon the evidence of age distribu-tions in apparent time and scattered evidence from earlier studies in real time, but these arguments are often uncertain. Dialect geography offers a much clearer type of evidence, since the diffusion of a change outward typically shows the ordering of successive stages as a series of concentric rings around the originating center, with the initial change diffused most widely.
Dialect geography offers insight into the larger sociolinguistic setting of a change in progress. PEAS shows that (in the 1940s) all of the major cities of the Eastern Seaboard except Philadelphia and Baltimore had adopted the r-less pronunciation that was the London standard at the end of the eighteenth century. The sociolinguistic study of New York City (Labov 1966) began with a detailed examination of the effects of a reversal of this norm in favor of a constricted /r/ in formal speech, beginning apparently at the end of World War II. Informal ob-servations indicated that similar trends could be found in Boston and Atlanta. But without a comprehensive re-study of the Eastern United States, it was impossible to say whether these events were local or national and whether they were driven everywhere by the same general forces (Chapter 7).
The Atlas results also bear upon the relative strength of internal and social factors in generating dialect patterns, the origin of regional differentiation and the relation of present-day boundaries to lines of communication. Atlas evidence is pertinent to many internal linguistic issues concerning the units of linguistic structure and their hierarchical relations. The Atlas will not attempt to explore these issues in detail, but it lays the the foundation for further studies that will strengthen the relations between dialect geography and linguistic theory.
1.2. A brief history of American dialect geography
The plan for mapping the dialects of North American English was first set in motion in the early 1920s, when the Linguistic Atlas of New England (Kurath et al. 1941, [LANE]) was initiated by a group of scholars that included some of the most prominent American linguists of the time. It was designed on the model followed by Romance dialectologists, specifically the methods of Jaberg and Jud (1928–1940). Field workers traveled to a pre-selected grid of communities, locat-ed informants who satisfied one of three demographic profiles, interviewed them with lengthy schedules that were organized loosely around semantic fields, and recorded their responses in an IPA notation modified to fit the phonetic features of the American vowel system. LANE was completed by the end of the decade, and its publications (Kurath and Bloch 1939; Kurath et al. 1941) are the most complete in the history of American dialectology. The detailed maps showed the actual phonetic form of the words and phrases representing the responses of in-formants.
LANE was followed by the Linguistic Atlas of the Middle and South Atlantic States [LAMSAS] under the direction of Hans Kurath, with a single field worker
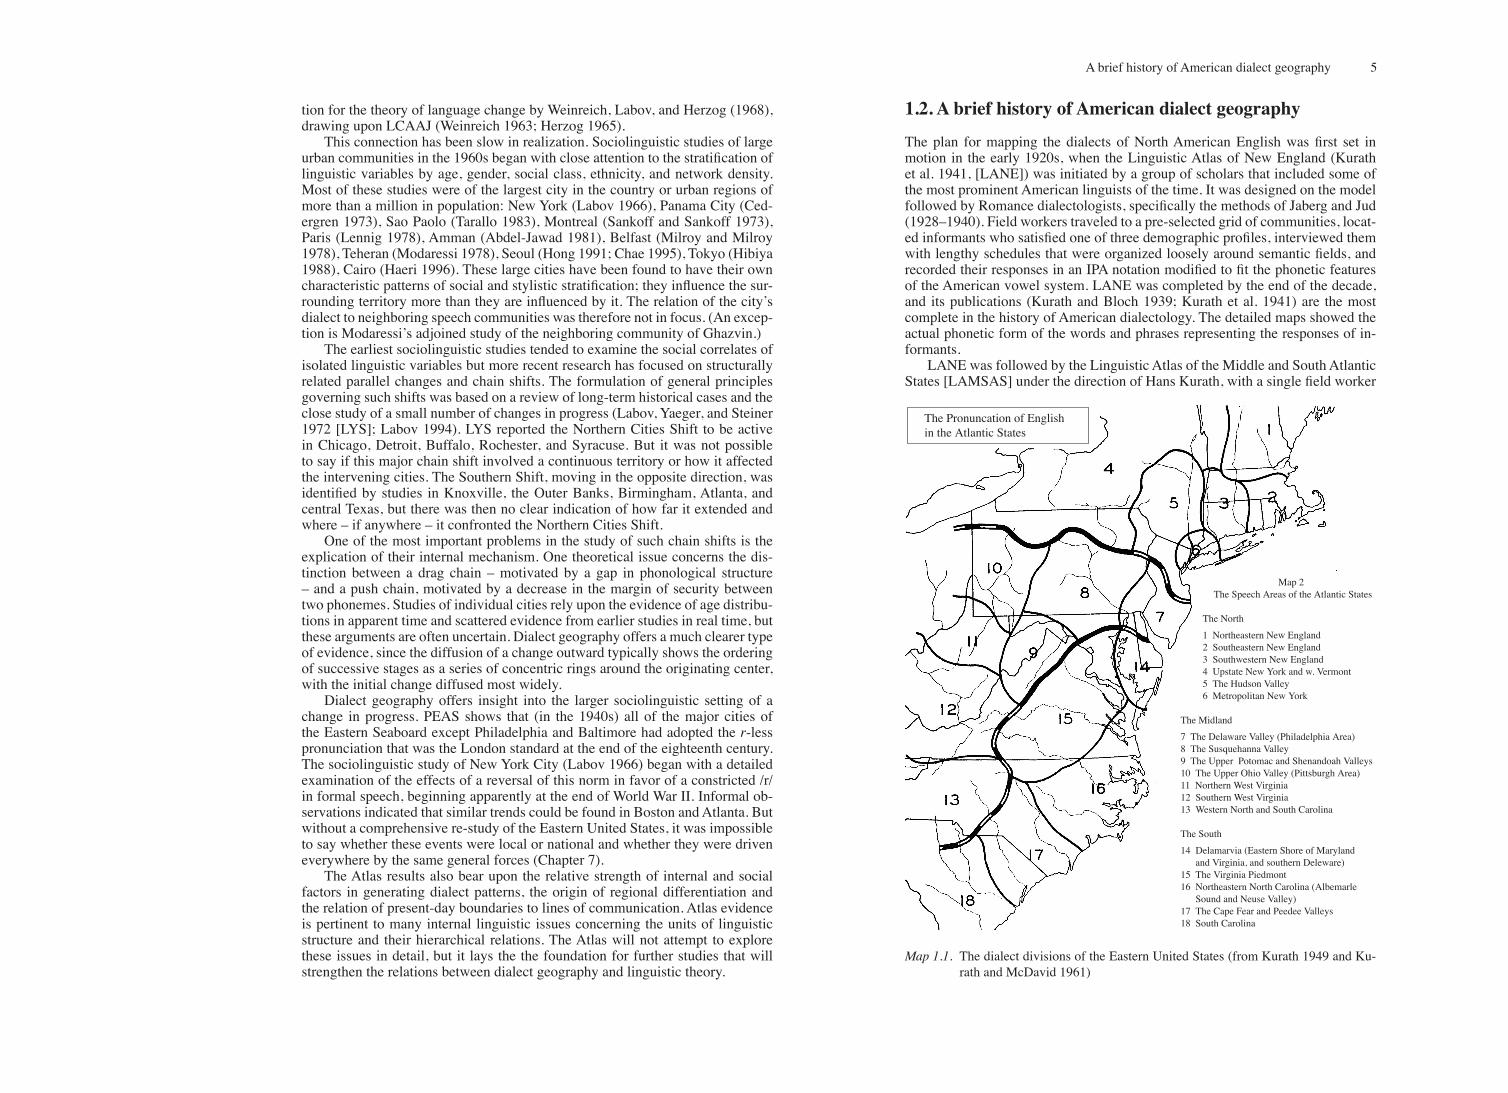
Map 1.1. The dialect divisions of the Eastern United States (from Kurath 1949 and Ku-rath and McDavid 1961)
The Pronuncation of Englishin the Atlantic States
Map 2The Speech Areas of the Atlantic States
The North
1 Northeastern New England2 Southeastern New England3 Southwestern New England4 Upstate New York and w. Vermont5 The Hudson Valley6 Metropolitan New York
The Midland
7 The Delaware Valley (Philadelphia Area)8 The Susquehanna Valley9 The Upper Potomac and Shenandoah Valleys10 The Upper Ohio Valley (Pittsburgh Area)11 Northern West Virginia12 Southern West Virginia13 Western North and South Carolina
The South
14 Delamarvia (Eastern Shore of Maryland and Virginia, and southern Deleware)15 The Virginia Piedmont16 Northeastern North Carolina (Albemarle Sound and Neuse Valley)17 The Cape Fear and Peedee Valleys18 South Carolina
A brief history of American dialect geography
Introduction6
(first Guy Lowman, then Raven McDavid). The first publication was A Word Ge-ography of the Eastern United States (Kurath 1949), which established the major and minor dialect divisions on the basis of regional vocabulary. Kurath replaced the traditional North/South/General American view of American dialects with a division of the eastern seaboard into Northern, Midland, and Southern regions.
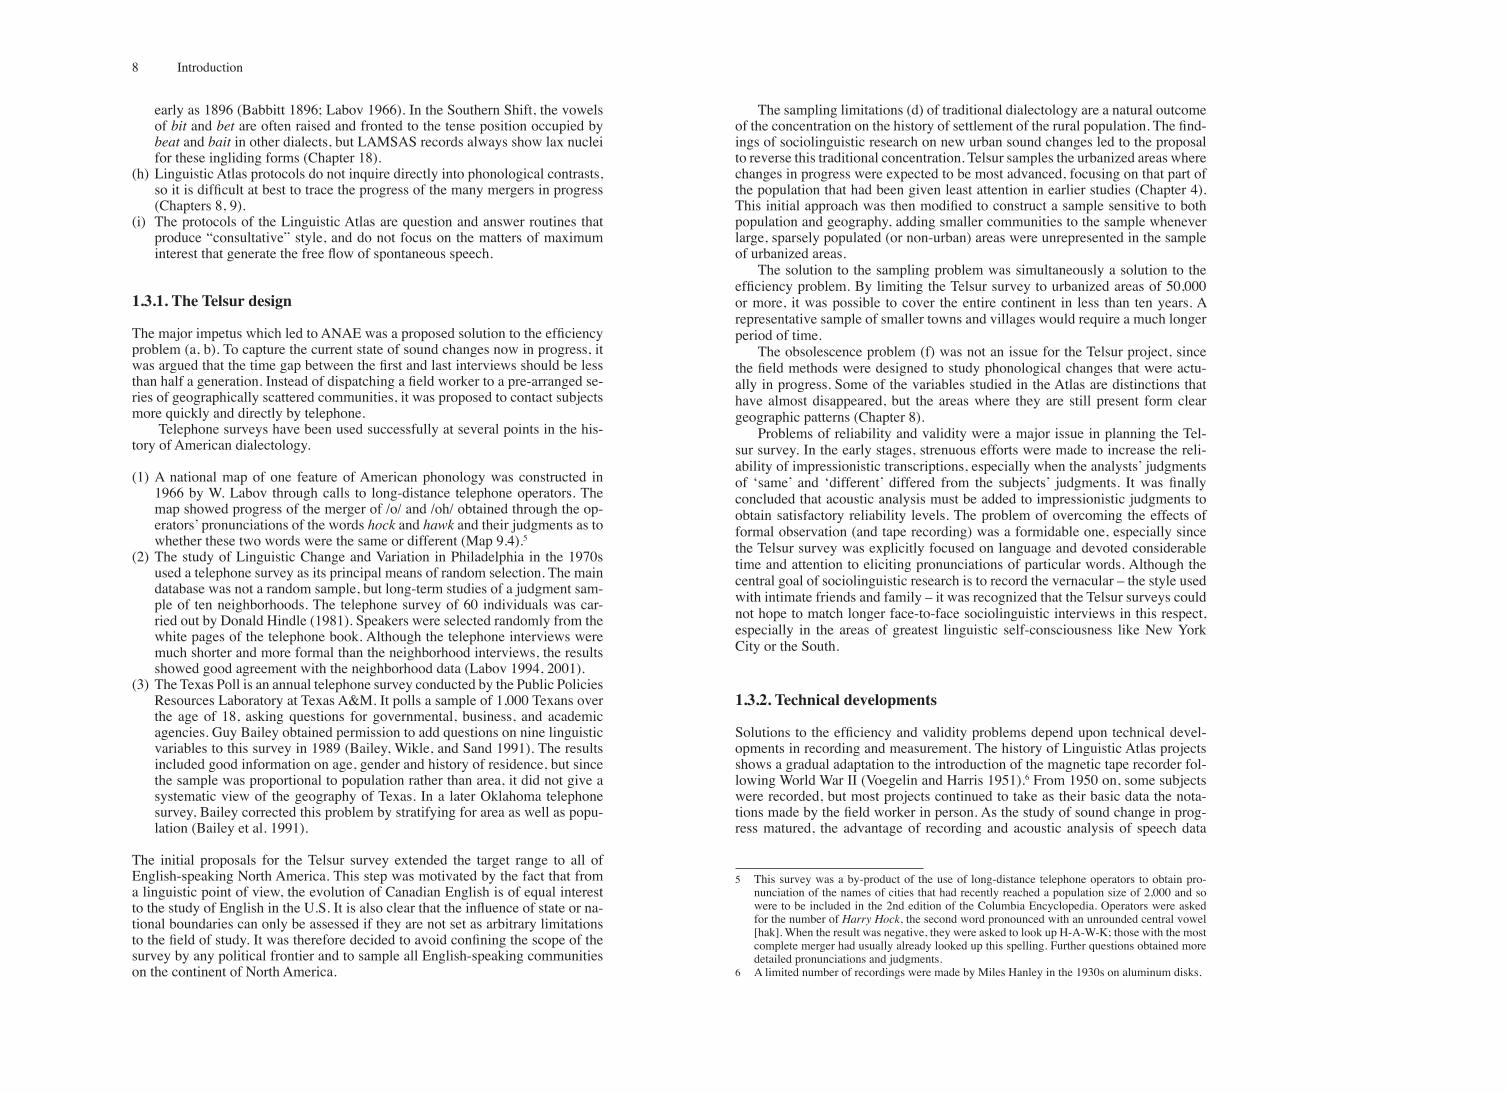
Twelve years later, Kurath and McDavid (1961) published the corresponding volume dealing with phonetic forms, The Pronunciation of English in the Atlantic States [PEAS]. The basic map of Kurath 1949 was reproduced without change (and is here shown as Map 1.1). Systematic inventories of the phonetic realiza-tion of phonemes were provided for a selection of cultivated informants, while the maps showed the distribution of major variants of key words. The initial maps report pronunciations of key words that represent major word classes. The pro-nunciation of short-o words, for example, is represented by the variants used in the word oxen in Map 15. The legend of Map 15 appears as
The open circle groups three low back to low central vowels; the barred circle identifies a backed version of the unrounded back vowel, one step backer than any of the three categories symbolized by the open circle; the solid circle indi-cates two further stages of backing, still unrounded; and the triangle identifies any back rounded vowel, from low back to lower mid. The phoneme after the “=” sign indicates the view of the analyst that any such rounding of the vowel in oxen demonstrates a merger with long open-o (since it is the unrounding of the vowel that preserves the distinction). Map 15 of PEAS shows a heavy concentration of such triangles in two areas: Western Pennsylvania and Eastern New England. Later studies have confirmed the accuracy of the PEAS data and its interpretation of a low back rounded vowel in short-o words as a sign of merger.
It is not a simple matter to use these phonetic maps to chart the present state of phonemic distinctions in the United States. The impressionistic transcriptions cannot be checked against more objective data; there is no information on the speakers ̓perceptions or judgments, and the data is now quite old. Yet current studies that include perceptual data and acoustic measurements confirm the merg-ers indicated in PEAS (Chapter 9).
The key decisions made by Kurath were based on lexicon, not phonology. It will also appear that the dialect boundaries constructed from ANAE data largely coincide with the dialect divisions established in Map 1.1 above, based on lexical evidence (Map 14.11.). The words selected by Kurath as diagnostic of the North-ern, Midland, and Southern regions became the criteria for extending the bound-aries westward, and the identification of the Northern, Midland and Southern components of the regional lexicon became the central task of dialect research. One of the most important published results of the Linguistic Atlas of the North Central States [LANCS] was a paper by Shuy on the extension of the North/Mid-land isogloss through Ohio, Indiana, and Illinois (1962). Carver (1987) re-draws this boundary with additional lexical evidence but with no important changes. (See Chapters 11 and 14 for the continuity of this work with ANAE findings.)
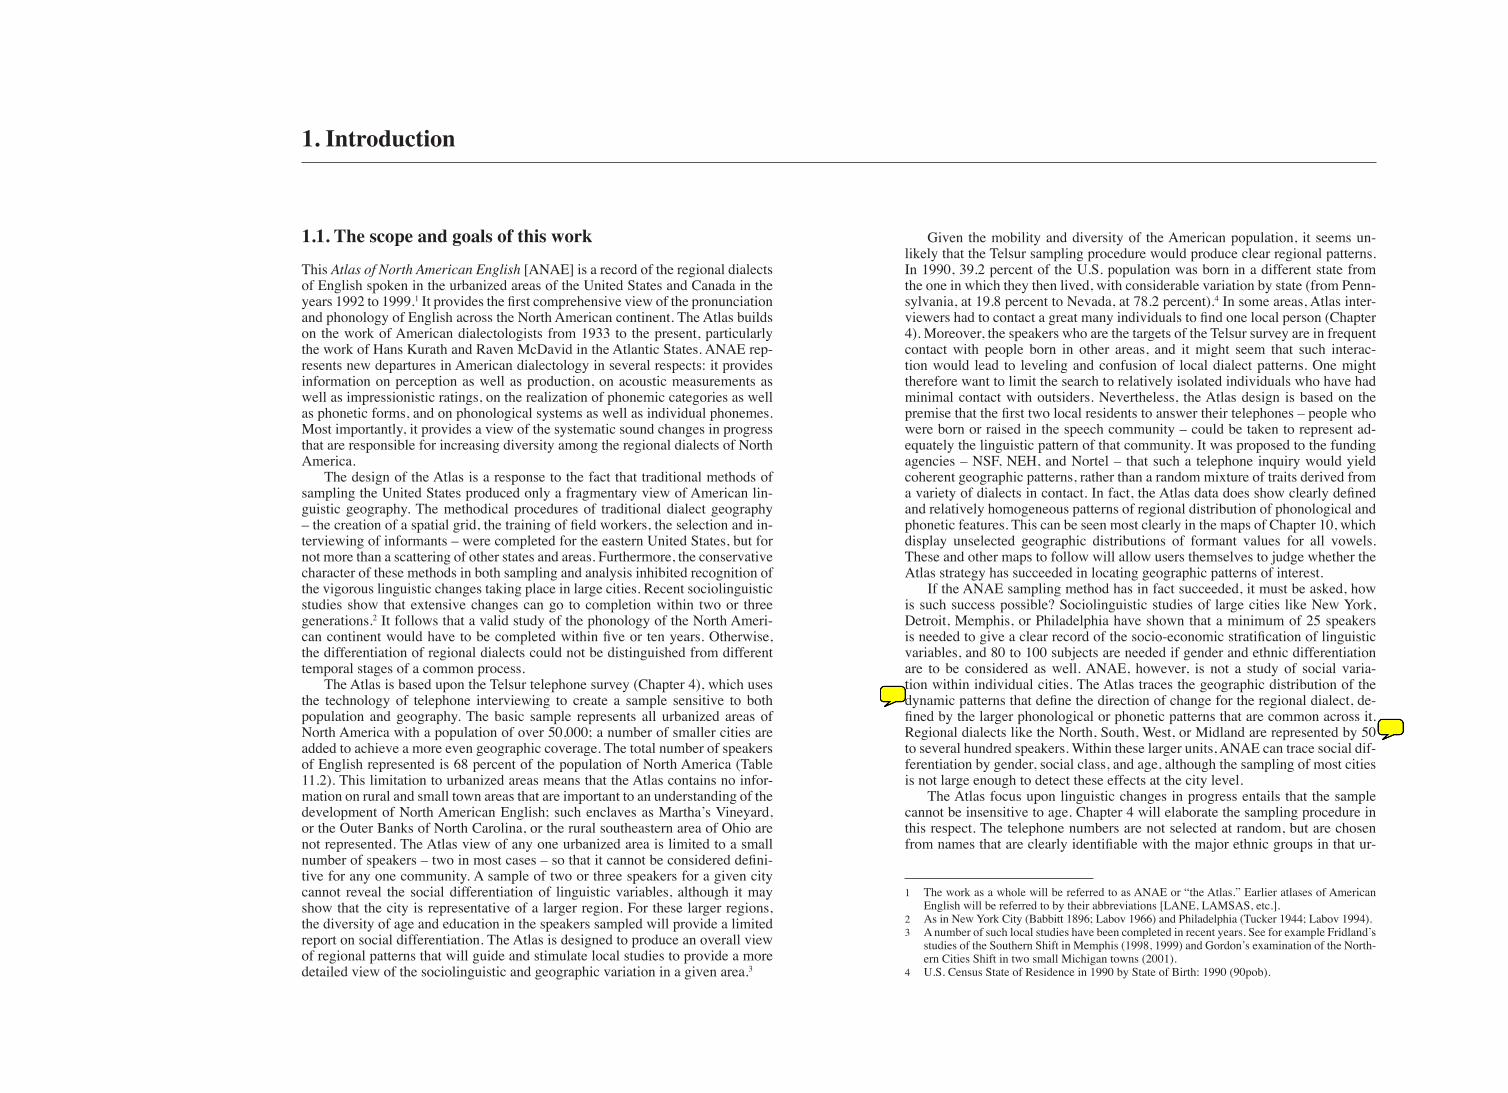
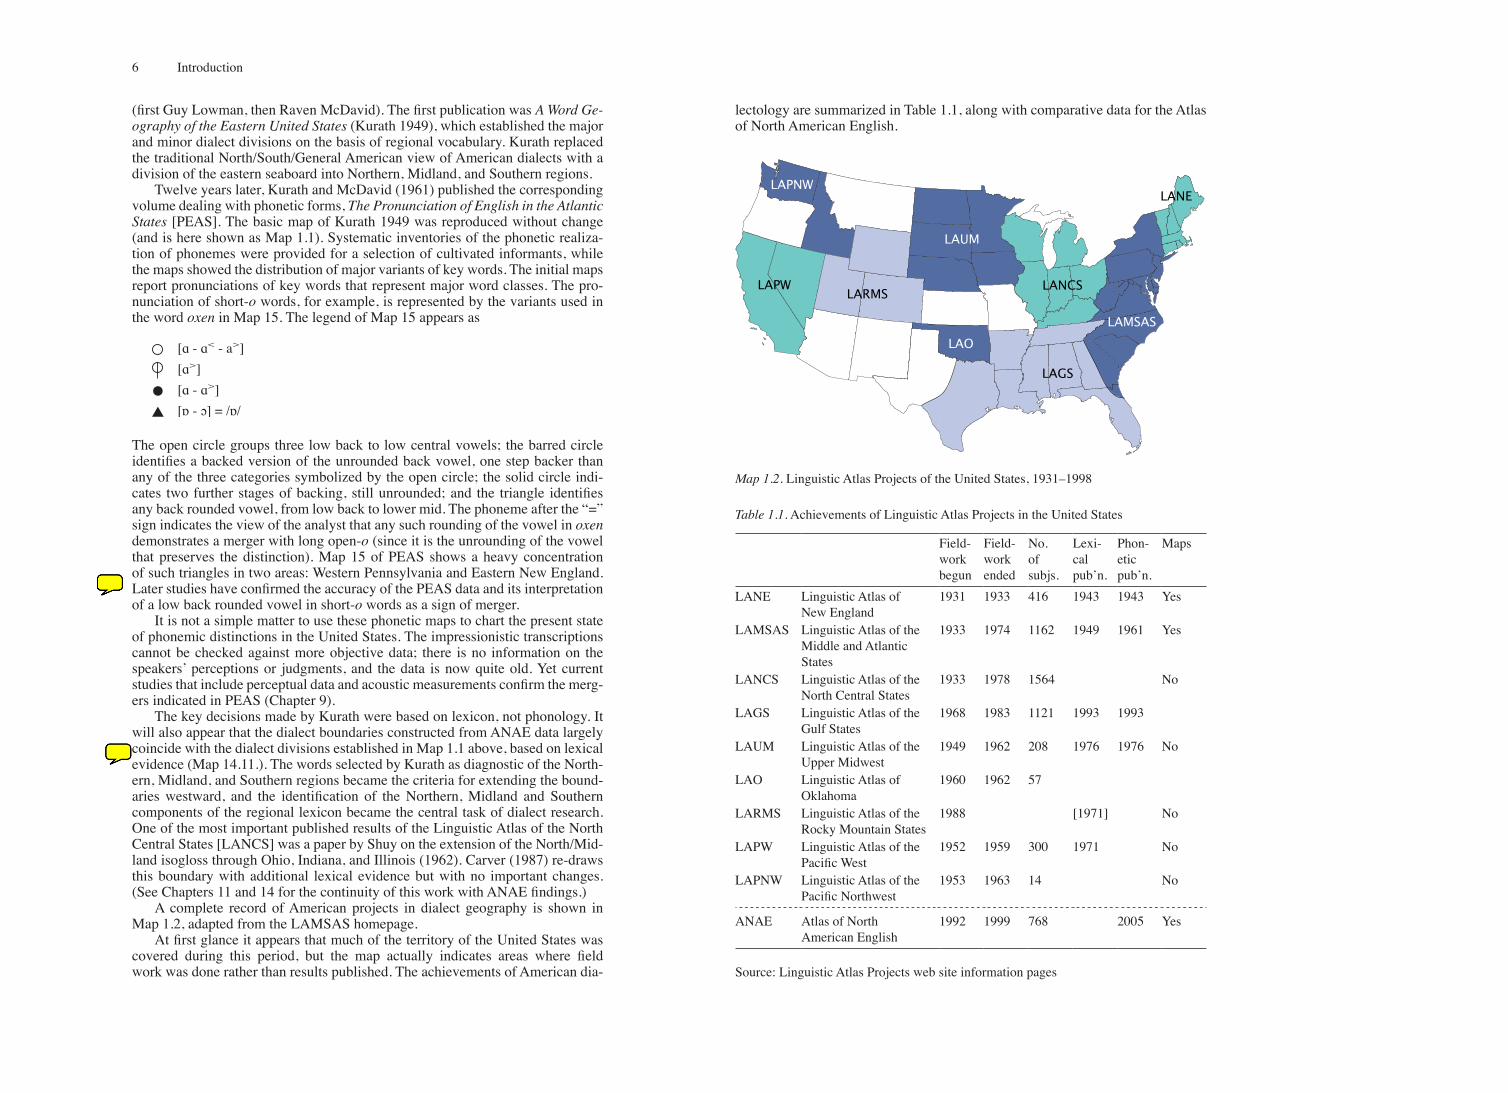
A complete record of American projects in dialect geography is shown in Map 1.2, adapted from the LAMSAS homepage.
At first glance it appears that much of the territory of the United States was covered during this period, but the map actually indicates areas where field work was done rather than results published. The achievements of American dia-
lectology are summarized in Table 1.1, along with comparative data for the Atlas of North American English.
Map 1.2. Linguistic Atlas Projects of the United States, 1931–1998
Table 1.1. Achievements of Linguistic Atlas Projects in the United States
Field-work begun
Field-work ended
No. of subjs.
Lexi-cal pubʼn.
Phon-etic pubʼn.
Maps
LANE Linguistic Atlas of New England
1931 1933 416 1943 1943 Yes
LAMSAS Linguistic Atlas of theMiddle and Atlantic States
1933 1974 1162 1949 1961 Yes
LANCS Linguistic Atlas of theNorth Central States
1933 1978 1564 No
LAGS Linguistic Atlas of theGulf States
1968 1983 1121 1993 1993
LAUM Linguistic Atlas of theUpper Midwest
1949 1962 208 1976 1976 No
LAO Linguistic Atlas ofOklahoma
1960 1962 57
LARMS Linguistic Atlas of theRocky Mountain States
1988 [1971] No
LAPW Linguistic Atlas of thePacific West
1952 1959 300 1971 No
LAPNW Linguistic Atlas of thePacific Northwest
1953 1963 14 No
ANAE Atlas of North American English
1992 1999 768 2005 Yes
Source: Linguistic Atlas Projects web site information pages
LAUM
LAO
LAPNW
LAMSAS
LARMSLAPW
LAGS
LANCS
LANE
[ɑ - ɑ˂ - a˃][ɑ˃][ɑ - ɑ˃][ɒ - ɔ] = /ɒ/
7
The Linguistic Atlas fieldwork covers a period of 52 years, from 1931 to 1983 (though the LARMS fieldwork is continuing). Most of the projects used modifi-cations of the worksheets of LANE and LAMSAS, and these records are gener-ally available (see the LAP website). The sixth and seventh columns show the year of publication. Five of the nine projects have published lexical data (the LARMS publication is Hankeyʼs Colorado Word Geography, 1960). Four of the nine have published phonetic information, but only two have published maps to interpret these data. McDavidʼs goal of complete publication of Atlas results has been realized to only a limited extent.
Nevertheless, the achievements of the Linguistic Atlas Projects provide a sub-stantial and reliable base for further investigation of American linguistic changes in progress. Bailey, Wikle, Tillery, and Sand (1991) found that the LAGS data fit in with earlier and later records to give a coherent record of linguistic change in real time. The sociolinguistic studies of New York and Philadelphia have built profitably upon prior LAMSAS records, and ANAE will refer to Linguistic Atlas data in almost every chapter. At the same time, it must be admitted that no nation-al map of the pronunciation of English was created by Linguistic Atlas projects, nor is it likely that the Linguistic Atlas materials now stored in various archives can be the basis of such a map, since the records are spread too widely across time and do not represent a view of American dialects at any one stage.
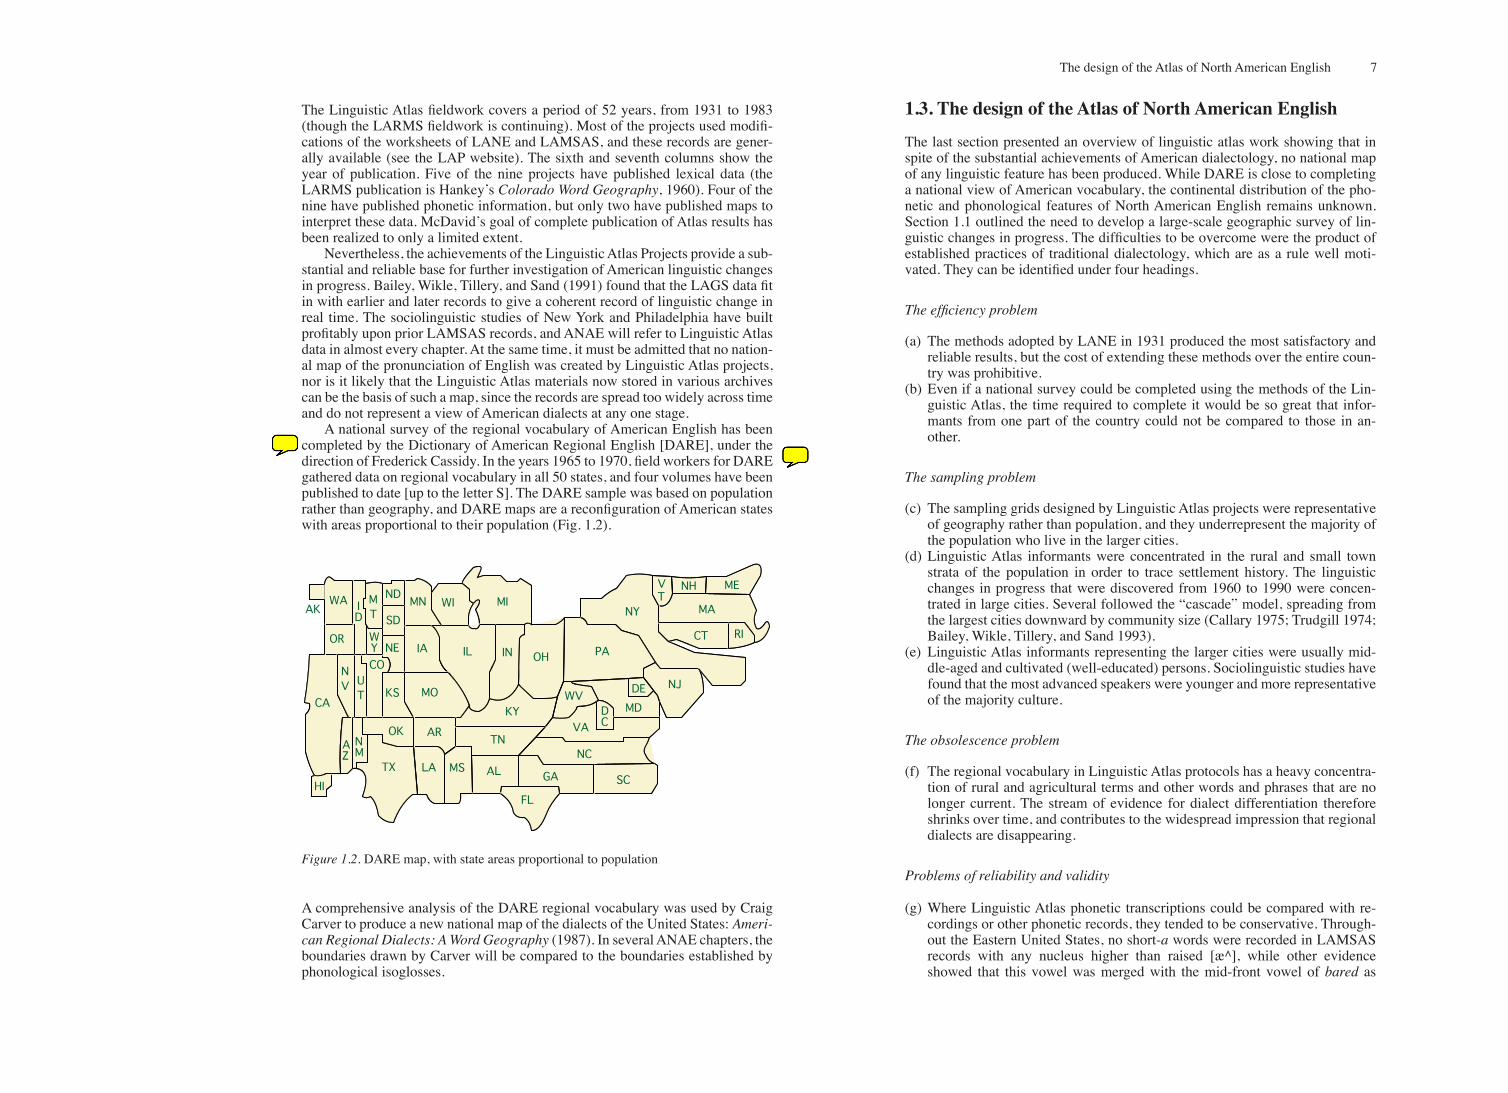
A national survey of the regional vocabulary of American English has been completed by the Dictionary of American Regional English [DARE], under the direction of Frederick Cassidy. In the years 1965 to 1970, field workers for DARE gathered data on regional vocabulary in all 50 states, and four volumes have been published to date [up to the letter S]. The DARE sample was based on population rather than geography, and DARE maps are a reconfiguration of American states with areas proportional to their population (Fig. 1.2).
Figure 1.2. DARE map, with state areas proportional to population
A comprehensive analysis of the DARE regional vocabulary was used by Craig Carver to produce a new national map of the dialects of the United States: Ameri-can Regional Dialects: A Word Geography (1987). In several ANAE chapters, the boundaries drawn by Carver will be compared to the boundaries established by phonological isoglosses.
1.3. The design of the Atlas of North American English
The last section presented an overview of linguistic atlas work showing that in spite of the substantial achievements of American dialectology, no national map of any linguistic feature has been produced. While DARE is close to completing a national view of American vocabulary, the continental distribution of the pho-netic and phonological features of North American English remains unknown. Section 1.1 outlined the need to develop a large-scale geographic survey of lin-guistic changes in progress. The difficulties to be overcome were the product of established practices of traditional dialectology, which are as a rule well moti-vated. They can be identified under four headings.
The efficiency problem (a) The methods adopted by LANE in 1931 produced the most satisfactory and
reliable results, but the cost of extending these methods over the entire coun-try was prohibitive.
(b) Even if a national survey could be completed using the methods of the Lin-guistic Atlas, the time required to complete it would be so great that infor-mants from one part of the country could not be compared to those in an-other.
The sampling problem (c) The sampling grids designed by Linguistic Atlas projects were representative
of geography rather than population, and they underrepresent the majority of the population who live in the larger cities.
(d) Linguistic Atlas informants were concentrated in the rural and small town strata of the population in order to trace settlement history. The linguistic changes in progress that were discovered from 1960 to 1990 were concen-trated in large cities. Several followed the “cascade” model, spreading from the largest cities downward by community size (Callary 1975; Trudgill 1974; Bailey, Wikle, Tillery, and Sand 1993).
(e) Linguistic Atlas informants representing the larger cities were usually mid-dle-aged and cultivated (well-educated) persons. Sociolinguistic studies have found that the most advanced speakers were younger and more representative of the majority culture.
The obsolescence problem (f) The regional vocabulary in Linguistic Atlas protocols has a heavy concentra-
tion of rural and agricultural terms and other words and phrases that are no longer current. The stream of evidence for dialect differentiation therefore shrinks over time, and contributes to the widespread impression that regional dialects are disappearing.
Problems of reliability and validity
(g) Where Linguistic Atlas phonetic transcriptions could be compared with re-cordings or other phonetic records, they tended to be conservative. Through-out the Eastern United States, no short-a words were recorded in LAMSAS records with any nucleus higher than raised [æ^], while other evidence showed that this vowel was merged with the mid-front vowel of bared as
OH PA
KY
NJ
NC
SCGA
FL
MA
IL
TN
ALTX
OK
CADC
RI
LA
WA
IA
MOMD
ME
AK NY
CT
VTWI
ND
NV U
T
NM
OR
HI
AZ
ID
WY
SD
NE
MN MI
KS
CO
MT
AR
MS
IN
WV
VA
DE
NH
The design of the Atlas of North American English
Introduction8
early as 1896 (Babbitt 1896; Labov 1966). In the Southern Shift, the vowels of bit and bet are often raised and fronted to the tense position occupied by beat and bait in other dialects, but LAMSAS records always show lax nuclei for these ingliding forms (Chapter 18).
(h) Linguistic Atlas protocols do not inquire directly into phonological contrasts, so it is difficult at best to trace the progress of the many mergers in progress (Chapters 8, 9).
(i) The protocols of the Linguistic Atlas are question and answer routines that produce “consultative” style, and do not focus on the matters of maximum interest that generate the free flow of spontaneous speech.
1.3.1. The Telsur design The major impetus which led to ANAE was a proposed solution to the efficiency problem (a, b). To capture the current state of sound changes now in progress, it was argued that the time gap between the first and last interviews should be less than half a generation. Instead of dispatching a field worker to a pre-arranged se-ries of geographically scattered communities, it was proposed to contact subjects more quickly and directly by telephone.
Telephone surveys have been used successfully at several points in the his-tory of American dialectology.
(1) A national map of one feature of American phonology was constructed in 1966 by W. Labov through calls to long-distance telephone operators. The map showed progress of the merger of /o/ and /oh/ obtained through the op-erators ̓pronunciations of the words hock and hawk and their judgments as to whether these two words were the same or different (Map 9.4).5
(2) The study of Linguistic Change and Variation in Philadelphia in the 1970s used a telephone survey as its principal means of random selection. The main database was not a random sample, but long-term studies of a judgment sam-ple of ten neighborhoods. The telephone survey of 60 individuals was car-ried out by Donald Hindle (1981). Speakers were selected randomly from the white pages of the telephone book. Although the telephone interviews were much shorter and more formal than the neighborhood interviews, the results showed good agreement with the neighborhood data (Labov 1994, 2001).
(3) The Texas Poll is an annual telephone survey conducted by the Public Policies Resources Laboratory at Texas A&M. It polls a sample of 1,000 Texans over the age of 18, asking questions for governmental, business, and academic agencies. Guy Bailey obtained permission to add questions on nine linguistic variables to this survey in 1989 (Bailey, Wikle, and Sand 1991). The results included good information on age, gender and history of residence, but since the sample was proportional to population rather than area, it did not give a systematic view of the geography of Texas. In a later Oklahoma telephone survey, Bailey corrected this problem by stratifying for area as well as popu-lation (Bailey et al. 1991).
The initial proposals for the Telsur survey extended the target range to all of English-speaking North America. This step was motivated by the fact that from a linguistic point of view, the evolution of Canadian English is of equal interest to the study of English in the U.S. It is also clear that the influence of state or na-tional boundaries can only be assessed if they are not set as arbitrary limitations to the field of study. It was therefore decided to avoid confining the scope of the survey by any political frontier and to sample all English-speaking communities on the continent of North America.
The sampling limitations (d) of traditional dialectology are a natural outcome of the concentration on the history of settlement of the rural population. The find-ings of sociolinguistic research on new urban sound changes led to the proposal to reverse this traditional concentration. Telsur samples the urbanized areas where changes in progress were expected to be most advanced, focusing on that part of the population that had been given least attention in earlier studies (Chapter 4). This initial approach was then modified to construct a sample sensitive to both population and geography, adding smaller communities to the sample whenever large, sparsely populated (or non-urban) areas were unrepresented in the sample of urbanized areas.
The solution to the sampling problem was simultaneously a solution to the efficiency problem. By limiting the Telsur survey to urbanized areas of 50,000 or more, it was possible to cover the entire continent in less than ten years. A representative sample of smaller towns and villages would require a much longer period of time.
The obsolescence problem (f) was not an issue for the Telsur project, since the field methods were designed to study phonological changes that were actu-ally in progress. Some of the variables studied in the Atlas are distinctions that have almost disappeared, but the areas where they are still present form clear geographic patterns (Chapter 8).
Problems of reliability and validity were a major issue in planning the Tel-sur survey. In the early stages, strenuous efforts were made to increase the reli-ability of impressionistic transcriptions, especially when the analysts ̓judgments of ʻsame ̓ and ʻdifferent ̓ differed from the subjects ̓ judgments. It was finally concluded that acoustic analysis must be added to impressionistic judgments to obtain satisfactory reliability levels. The problem of overcoming the effects of formal observation (and tape recording) was a formidable one, especially since the Telsur survey was explicitly focused on language and devoted considerable time and attention to eliciting pronunciations of particular words. Although the central goal of sociolinguistic research is to record the vernacular – the style used with intimate friends and family – it was recognized that the Telsur surveys could not hope to match longer face-to-face sociolinguistic interviews in this respect, especially in the areas of greatest linguistic self-consciousness like New York City or the South.
1.3.2. Technical developments Solutions to the efficiency and validity problems depend upon technical devel-opments in recording and measurement. The history of Linguistic Atlas projects shows a gradual adaptation to the introduction of the magnetic tape recorder fol-lowing World War II (Voegelin and Harris 1951).6 From 1950 on, some subjects were recorded, but most projects continued to take as their basic data the nota-tions made by the field worker in person. As the study of sound change in prog-ress matured, the advantage of recording and acoustic analysis of speech data
5 This survey was a by-product of the use of long-distance telephone operators to obtain pro-nunciation of the names of cities that had recently reached a population size of 2,000 and so were to be included in the 2nd edition of the Columbia Encyclopedia. Operators were asked for the number of Harry Hock, the second word pronounced with an unrounded central vowel [hak]. When the result was negative, they were asked to look up H-A-W-K; those with the most complete merger had usually already looked up this spelling. Further questions obtained more detailed pronunciations and judgments.
6 A limited number of recordings were made by Miles Hanley in the 1930s on aluminum disks.
9
became increasingly clear. This is particularly true when the trajectory of the sound changes depends crucially on small differences in fronting and backing. While traditional phonetic transcription records as many as 16 degrees of height, it is more difficult to get agreement on the diacritics that register degrees of front-ing and backing.7 More generally, the impressionistic phonetician is confined tothe use of a small set of discrete symbols and must recognize the well-document-ed variation in human capacity to agree on the use of these symbols (Ladefoged 1957).
The history of acoustic analysis has registered a steady increase in accuracy and efficiency. At the outset, an electro-mechanical device such as the Kay Sono-graph took a minimum of five minutes to create a spectrogram; measurements of formant centers on that spectrogram had margins of errors equivalent at best to 1/4 of a pitch period – 50 Hz for female speakers. The development of linear pre-dictive coding (LPC) and its software implementation has led to a rapid increase in speed and accuracy and the ability to separate the effects of the supra-glottal tract – the position of the tongue and the lips – from the glottal spectrum.
The acoustic analysis of 440 Telsur speakers was made possible only by the advances in speed, efficiency, and accuracy of the CSL program developed by Kay Elemetrics, using methods described in detail in Chapter 5. Telsur procedures ob-tained measurements of 300 to 500 tokens of the vowel system of a speaker in a single day. This can be compared to the weekʼs effort that was required to produce – and correct – 120 tokens in the original studies of sound change in progress of LYS. Subsequent to the acoustic analysis, further analytical tools were required for dealing with the complexity of English vowel systems. The most important of these is the Plotnik program for plotting, analyzing, and superimposing vowel systems in a two-dimensional, computerized display. ANAE will make extended use of Plotnik displays.
1.3.3. Stages of research and sources of support
The first stage of the Telsur project was a pilot project supported by NSF from 1991 to 1993 [BNS91-11637], under the title of “A Survey of Sound Change in Progress.” This pilot project was designed to test the proposition that sound changes could be traced rapidly and effectively through telephone interviews (Chapter 4). It was followed by a larger project “A Telephone Survey of Sound Change in Progress”, designed to trace sound changes in progress throughout the Midwest, supported by NSF from 1993 to 1994 [SBR 92-22458]. A grant from NEH from 1994 to 1998 made it possible to extend the Telsur project to cover North America as a whole, under the title of “A Phonological Atlas of North American English” [RT-21599-94]. During this period of data collection and analysis, the project also received support from Bell-Northern Laboratories, the research and development division of Bell Canada and Northern Telecom (now Nortel).
From 1998 to 2003, further grants from NSF made it possible for the project to explore two areas in greater detail. Between 1998 and 2000, the project stud-ied age and social stratification in Midland cities, focusing particularly on Pitts-burgh, Columbus, and Indianapolis (“Linguistic Diversity in the North American Midland” [SBR 98-11487]). During the period from 2000 to 2003, the project explored the diffusion of change from large cities to small towns in the region from New York to Baltimore, in the project “A Study of Linguistic Change and Diffusion in the Mid-Atlantic Region” [BCS 0002225]. The great majority of the ANAE data was gathered from 1992 to 1999, but some data derived from these more detailed studies will appear, insofar as it contributes to the study of the pho-nology of the major urbanized areas.
1.4. Data to be presented and questions to be answered
This Atlas will respond both to the traditional questions of dialect geography and to linguistic questions concerning the causes and mechanisms of language change. It will present systematic data on the phonology of the urbanized areas of North America in a form that ideally would be accessible to all those interested in North American English. However, much of the discussion in the printed version of the Atlas is necessarily technical, since there is no non-technical vocabulary to describe changes in the acoustic and auditory character of vowel sounds. The CD-ROM and website accompanying this volume include extensive glossaries and explanations, along with sound samples to provide direct acquaintance with the dialect forms and changes taking place in North American English.
The Atlas will address certain primary questions of dialect geography:
• How many dialects of North American English are there?• What phonological features define them?• What are their boundaries?
The ANAE approach to these questions will develop issues that are specific to the study of linguistic change and variation:
• What are the trajectories of change in NAE dialects?• In what ways are NAE dialects converging or diverging at the phonetic and
phonological levels? • How do current changes in NAE dialects conform to or modify the general
principles that govern the evolution of sound systems?
Though the last of these questions will be integrated into the presentations of At-las maps, the full treatment of the more general theoretical issues will be reserved for further publications. Atlas findings will also bear upon the broader questions of causation that are specific to dialect geography:
• How is settlement history reflected in the current location of dialect boundar-ies and isogloss bundles?
• What internal, structural factors lead to the expansion of dialect boundaries beyond their historical origin?
• How do current patterns of communication affect the development of sound change and the location of dialect boundaries?
These questions will be considered in the Atlas chapters, but the thorough con-sideration of historical and demographic factors will be reserved for future treat-ment.
All of these questions take on a more acute form in the light of the remarkable clarity of the dialect differentiation emerging from the ANAE maps. The data developed by ANAE does not reflect the dialect continuum projected by many exponents of traditional dialectology.
Data to be presented and questions to be answered
7 The syllabi of LANE, PEAS, and LAUM show an unusually high frequency of fronting and backing diacritics, so that a total of nine degrees can be recorded on this dimension. However, the maps of PEAS do not make use of this distinction. The PEAS syllabi show backing diacrit-ics for three Southern cultivated speakers (a crucial characteristic of the Southern Shift), but no such distinction appears in the maps for day or bracelet (PEAS Maps 18, 19).

Introduction10
A map of language variation is merely a static representation of a phenomenon whose most salient characteristic is its fluidity. It is an almost seamless fabric covering the land. (Carver 1987: 19)
In contrast, ANAE will show many sharp and well-defined boundaries dividing the major regional dialects, in which a number of phonological isoglosses are tightly bundled. Archetypical of such boundaries is the North/Midland line. In other areas, particularly in the West, dialect boundaries are less discrete and the definitions of dialect areas are correspondingly complex. The ANAE data will also indicate a drift towards the increasing differentiation of the dialects on either side of these boundaries. Such evidence of change in progress will be drawn largely from age distributions (apparent time), since real-time data are not avail-able for most of the urbanized areas studied. These divergent trends are due to the operation of chain shifts moving in radically different directions: the Northern Cities Shift, the Southern Shift, the Canadian Shift, the Back Upglide Shift, and the Pittsburgh Shift.
Divergence and differentiation are not the whole story. While the larger re-gional dialects show solidification and further development, many smaller local dialects are weakening or have almost disappeared, giving way to the more gen-eral regional patterns. In this sense, ANAE shows convergence as well as diver-gence. The convergence shown is not a movement towards a national norm, but rather towards broader regional patterns.
1.5. Organization of the Atlas
Part A (Chapters 1–6) presents a detailed account of the methods of the Atlas for collecting and analyzing data.
Part B (Chapters 7–9) will report the progress of a wide variety of ongoing merg-ers in North America, based on data from all 768 Telsur subjects. Chapter 7 deals with the importation of consonantal /r/ in areas that were formerly r-less, with a consequent reduction in the long and ingliding vowel sys-tem. Chapter 8 presents data on mergers that are almost complete, where the relevant distinction is maintained in only a few communities. Chapter
9 considers the progress of ongoing mergers that involve roughly half of the North American territory. For each variable, the relations of percep-tion and production are considered, along with the extent to which these developments exemplify the general principles that have been found to govern mergers (Labov 1994: Ch. 11).
Part C (Chapter 10) presents 38 maps that summarize quantitative data on the pronunciation of the stressed vowels of English for 440 subjects, based on the acoustic analysis of 144,000 vowels. The maps present the data in a form that is neutral to any theoretical issue and available for inspection with minimum interference from the perspective of the investigators. The accompanying CD-ROM contains a complete database of reported judg-ments, measurements, and the Plotnik vowel plotting program that will allow any reader to continue the analysis in their own perspective, along with extensive sound samples.
Part D (Chapters 11–13) deals with the regional dialects of North America, be-ginning with definitions of dialect areas on the basis of current changes in progress (Chapter 11). Chapter 12 examines those changes in progress that affect the entire continent, beginning with the large-scale fronting of the back upgliding phonemes /uw, ow, aw/. Chapter 13 deals with the diverse patterns of raising and fronting of short-a, concluding with a con-tinental map of short-a systems.
Part E (Chapters 14–20) takes up successively the individual regions defined in chapter 11: the North, Canada, Eastern New England, the Mid-Atlantic States, the South, the Midland, and the West. These chapters deal with the progress of the chain shifts that define each region, their relation to general principles of linguistic change, and the ways in which the various components of the shift relate to each other and to the regionʼs boundar-ies.
Part F (Chapters 21–23) presents information on a limited number of lexical and grammatical variables, comparing their boundaries to the boundaries established by phonological processes and compares the vowel systems of African American with white speakers in the larger Southern commu-nities. A final chapter summarizes the findings of the Atlas.