Embed Size (px)
Citation preview
1
1. INTRODUCTION
1.1. Background
Dragon Cement Industries Pvt. Ltd. is setting up a mini cement plant at
Bhogiram gaon, P.O. Doboka, Nagaon district, Assam. The capacity of the
proposed plant is 200 TPD Clinker (240 TPD Cement). At Bhogiram gaon, P.O.
Doboka, Nowgaon district, Assam, raw materials are available from the North
Karbi Anglong Hills range. Moreover, in the North Eastern region the demand
and supply gap is very large; as most of the demand of cement is met from
supply from other parts of the country, the market is abundant. In North
Eastern region (as per Cris Infac Study) demand of cement is 2.02 million tons.
In order to assess the likely impact of the proposed mini cement plant to
the environment, authorities of Dragon Cement Industries Pvt. Ltd. has
appointed Green Tech Environmental Engineer & Consultants, Guwahati to
undertake Rapid Environmental Impact Assessment (REIA) for various
environmental components which may be affected and to prepare Environmental
Management Plant (EPM) to mitigate the adverse impact of the project.
1.2. Objectives of the study
The objectives of the present study are as follows
Establish the prevailing baseline environmental and socioeconomic
condition of the project sites and their surroundings along with the
compliance needs for environmental approvals to be able to carry
out site selection and well planning;
Assess environmental, socioeconomic and health impacts arising out
of the proposed project and associated activities;
Recommend appropriate preventive and mitigation measures to
eliminate or minimize pollution, environmental and social
disturbances.
2
Integrate mitigative measures so that they can be implemented,
monitored and suitable corrective action can be taken in case of
deviations;
Identify residual and cumulative impacts that may arise from the
project and suggest suitable measures to minimize them.
1.3. Scope of the study
The basic scope of the present study involves conducting of a rapid EIA
study of about 3 months duration to understand the environmental and social
impacts of the project and recommend suitable preventive/mitigative actions
through the Environment Management Plan (EMP). The scope of the EIA study
includes the following:
Understanding the project based on information provided by
Dragon Cement Industries Pvt. Ltd.;
Make site visits for collection of primary and secondary
information on status of the environment in the study area;
Impact assessment and
Formulate EMP.
1.4. Brief description of nature, size, location of the project and its
importance to the country, region
Dragon Cement Industries Pvt. Ltd. are setting up 200 TPD Clinker (240
TPD Cement)with VSK technology cement plant at Bhogiram gaon, P.O. Doboka,
Dist. Nagaon, Assam.
The important factors for setting up an industry are availability of raw
materials and market of the finished products. At Bhogiram gaon, P.O. Doboka,
Nagaon district, Assam, raw materials are available on the North Karbi Anglong
Hills range. This range is in the vicinity of the project site. There is also a huge
stock of lime-stone and coal in the neighbouring state of Meghalaya. Moreover,
in the North Eastern region the demand and supply gap is very large; as most of
the demand for cement is met from supply from other parts of the country, the
3
market is abundant. In North Eastern region (as per Cris Infac Study) demand
of cement is 2.02 million tons. Major portion of this demand i.e. around 60%
(1.2 million ton) are met from outside the NE region suppliers on which 40
rupees to 85 rupees are spent on transportation cost which is considerably very
high and a matter of concern for the region. The already existing 25 TPD cement
plant is a sick unit. Since there is abundant quantity of lime stone available in
Assam and Meghalaya, there is scope for export too to neighbouring country like
Bangladesh, Myanmar, Nepal and Bhutan etc.
1.5. Scope of the study –detail regulatory scoping carried out (As per
term of reference)
The scope of study includes cross sectional characterization of the existing
environment in an area of 5 Km radius from the project site as well as regional
background, status for environmental component viz. air, noise, water, land,
biological and socio-economic. The main objectives of the study are:
To study the effect on the various environmental components of the
proposed 200 TPD Clinker (240 TPD Cement) plant.
To prepare environmental management plan (EMP) adopted for
mitigation of adverse impacts.
To delineate post project environmental quality monitoring and program to be
pursued.

4
2. PROJECT DESCRIPTION
A condensed description of those aspect of the project (based on project
feasibility study), likely to cause environmental effects is enumerated. Study
should provide to give clear picture of the various parameter of the project.
2.1. Type of project
Dragon Cement Industries Pvt. Ltd. are setting up 200 TPD Clinker (240
TPD Cement) with VSK technology cement plant at Bhogiram gaon, P.O.
Doboka, Dist. Nagaon, Assam. The total capital cost of the project is estimated
at Rs. 497 lakhs including margin money of Rs. 55.37 lakhs for working capital.
2.2. Need of the project
The important factors for setting up an industry are availability of raw
materials and market of the finished products. At Bhogiram gaon, P.O. Doboka,
Nowgaon district, Assam, raw materials are available on the North Karbi
Anglong Hills range. This range is in the vicinity of the project site. There is also
a huge stock of lime-stone and coal in the neighbouring state of Meghalaya.
Moreover, in the North Eastern region the demand and supply gap is very large;
as most of the demand of cement is met from supply from other parts of the
country, the market is abundant. In North Eastern region (as per Cris Infac
Study) demand of cement is 2.02 million tons. And major portion of this
demand i.e. around 60% (1.2 million ton) are met from outside the NE region
suppliers on which 40 rupees to 85 rupees are spent on transportation cost
which is considerably very high and a matter of concern for the region. Since
there is abundant quantity of lime stone available in Assam and Meghalaya,
there is scope for export too to neighbouring country like Bangladesh, Myanmar,
Nepal and Bhutan etc.
2.3. Location (map showing general location, specific location, project
boundary & project site layout)

5
A plot of land measuring around 17 bighas at Bhogiram gaon, Mouza
Jamunamukh, Circle Doboka, District Nagaon, Assam has been acquired for the
proposed project. The project site is 2 Km from Doboka town, 10 Km from the
Jamunamukh railway station, 1 Km from the National Highway 54. Nagaon town
is 36 Km away from the project site on North West direction (Figure 2.3.1 and
Figure 2.3.2).

6
Figure 2.3.1: Map of Nagaon district 6
7
Figure 2.3.1: Site map of the proposed cement plant

8
9
2.4. Size or magnitude of operation
Dragon Cement Industries Pvt. Ltd. are setting up 200 TPD Clinker (240
TPD Cement) with VSK technology cement plant at Bhogiram gaon, P.O.
Doboka, Dist. Nagaon, Assam. The total capital outlet including working capital,
margin money of Rs. 55.37 lakhs has been estimated at Rs. 497 lakhs. The
manpower requirement will be around fifty persons for smooth functioning of
the project.
2.5. Proposed schedule for approval and implementation
Implementation of the project work has already been started. The land
development work is going on at the project site. The formalities for legal
clearance from various departments are also under process.
2.6. Technology and process description
Raw Materials
The main raw materials used in the cement manufacturing process are
limestone, sand, shale, clay, and iron ore. The main material, limestone, will be
collected from the neighbouring places.
Raw Material Preparation
Depending on size, the raw materials may or may not be crushed before
being stored in separate areas until required.
Raw Grinding
In this step the raw material is proportioned to meet a desired chemical
composition and fed to either a rotating ball mill or vertical roller mill. The raw
materials are dried with waste process gases and ground to a size where the
majority of the materials are less than 75 microns. The dry materials exiting
either type of mill are called "kiln feed". The kiln feed is pneumatically blended
10
to insure the chemical composition of the kiln feed is well homogenized and then
stored in silos until required.
Pyroprocessing
Whether the process is wet or dry, the same chemical reactions take
place. Basic chemical reactions are: evaporating all moisture, calcining the
limestone to produce free calcium oxide, and reacting the calcium oxide with the
minor materials (sand, shale, clay, and iron). This results in a final black,
nodular product known as "clinker" which has the desired hydraulic properties.
In the wet process, the slurry is fed to a rotary kiln, which can be from 3.0
m to 5.0 m in diameter and from 120.0 m to 165.0 m in length. The rotary kiln
is made of steel and lined with special refractory materials to protect it from the
high process temperatures. Process temperatures can reach as high as 1450oC
during the clinker making process.
In the dry process, kiln feed is fed to a preheater tower, which can be as
high as 150.0 meters. Material from the preheater tower is discharged to a
rotary kiln with can have the same diameter as a wet process kiln but the length
is much shorter at approximately 45.0 m. The preheater tower and rotary kiln
are made of steel and lined with special refractory materials to protect it from
the high process temperatures.
Regardless of the process, the rotary kiln is fired with an intense flame,
produced by burning coal, coke, oil, gas or waste fuels. Preheater towers can be
equipped with firing as well.
The kiln discharges the red-hot clinker under the intense flame into a
clinker cooler. The clinker cooler recovers heat from the clinker and returns the
heat to the pyroprocessing system thus reducing fuel consumption and
improving energy efficiency. Clinker leaving the clinker cooler is at a
temperature conducive to being handled on standard conveying equipment.

11
Finish Grinding and Distribution
The black, nodular clinker is stored on site in silos or clinker domes until
needed for cement production. Clinker, gypsum, and other process additions are
ground together in ball mills to form the final cement products. Fineness of the
final products, amount of gypsum added, and the amount of process additions
added are all varied to develop a desired performance in each of the final
cement products.
Each cement product is stored in an individual bulk silo until needed by the
customer. Bulk cement can be distributed in bulk by truck, rail, or water
depending on the customer's needs. Cement can also be packaged with or
without color addition and distributed by truck or rail.

12
3. DESCRIPTION OF ENVIRONMENT
3.1. Study Area, period, components & methodology
The project site falls under Bhogiram gaon and Sutargaon gram
panchayat, Binnakandi C.D. Block in Nagaon district. The geographical location
of Nagaon district is 25°56’ North Latitude and 92°57’ East Longitude. For the
present study cross sectional characterization of the existing environment in an
area of 5 Km radius from the project site as well as regional background, status
for environmental component viz. air, noise, water, land, biological and socio-
economic condition were studied.
Rapid EIA study was conducted for a period of 3 months duration
(November, December and January) to understand the environmental and social
impacts of the project(Figure 3.1.1).
The average gradient is gentle with a moderate slope. The mean daily
maximum temperature during winter is about 25° C and minimum is 11° C. The
mean daily maximum temperature during summer is 34° C and the minimum is
24° C. The relative humidity varies from month to month and increases from
76% to 84% during the South west monsoon and is about 77% in rest of the
year. The humidity varies throughout the year but seldom drops down below
67%. The average annual rainfall is 1541.7 mm. Rainfall is confined mainly
during the monsoon season. Winds are generally light to moderate being 2-8
Km per hour (Figure 3.1.1).
3.1.1 Air Environment
Studies on air environment were carried out in the following three
different fields: ambient air quality within 5 km radius, theoretical estimation of
stack and fugitive emission characteristics on the basis of DFR and prediction of
ground level concentration (GLC) through air pollution models for existing
operational levels and proposed facilities.

13
14
For Ambient Air Quality Monitoring (AAQM) 16 sampling stations were
selected within 5 km radius zone on the basis of micro-meteorological data
(wind/speed/direction) collected from the site for the purpose. The parameters
for AAQM included suspended particulate matter (SPM), sulphur dioxide (S02),
and nitrogen dioxide (N02). Gaseous pollutants (viz. S02, NOx, etc.) were
monitored on 8 hr average and SPM for 24 hr average basis. The micro-climatic
parameters were also recorded for the whole study period. Different types of
sampling equipments viz. Hi-Volume samplers, portable battery powered spot
monitors; gaseous monitoring units etc. were deployed to meet the specific
requirements of field conditions. For simultaneous gaseous and particulate
sampling, a tapping is provided in hopper of the Hi-Volume sampler for
generating necessary suction head.
The gaseous monitoring was done at impingement rate of 1 l/min. A
temporary field centre as central facility for the purpose of calibration of
equipment and standardization of analytical procedures was set up at Guwahati.
The samples were analyzed on the same day of collection. AQM was carried out
for a period of 30 days during December, 2007.
The emissions were also estimated theoretically based on design data and
emission factors reported for such processes.
PTPLU (point plume), PTMTP (multi-point source) and PAL (point area line
source) models were finally applied for prediction of ground level concentration
(GLC) under different micro-meteorological and emission strength scenario.
3.1.2. Noise Environment
Noise pollution survey was conducted in and around the project site at 16
locations for projecting base line status. The prominent noise sources
anticipated from vehicles and machineries of stone crusher very near to the
project site. Spot noise levels (A-weighted) were measured using a precision
noise level meter SLM-100 (Envirotech Instruments Pvt. Ltd.). As the project
site is being located very close to NH-54 the generated noise levels from the
highway were also recorded at various locations. Spot noise levels were also
15
recorded in the surrounding small residential villages and important landmarks
near the project site on NH-54 for projecting general scenario within 5 km
radius.
Hemispherical sound wave propagation model has been used to estimate
noise levels at various receptor locations due to major noise sources of the
region. Besides noise level prediction, the attenuation factors for noise were also
obtained for optimal green belt design.
3.1.3. Water Environment
All surface water resources of the region were identified and background
characteristics (data base) for each source were generated. Twelve locations
were selected for analyzing the water samples. The parameters of prime
importance for source quality characterization were selected covering
physicochemical as well as nutrient group. The quality of water was tested and
the pH was found to be 7.2.
The total water requirement of the cement plant will be around 20 KLD for
cooling and administrative purposes. The requirement will be met by bore well
within the plant site. Sources of biodegradable wastewater were quantified to
set up proposed treatment units. In addition, sampling was also performed from
the existing tube wells nearby to access the general water quality character of
the soil.
3.1.4. Land Environment
Land environment is primarily impacted as a consequence of:
Fall out of atmospheric pollutants. It may be dry and wet disposition
of dust and secondary pollutants.
Soil samples were collected from number of villages in order to
determine the soil infiltration rates, and other physicochemical
changes at the possible solid waste disposal sites.
Characterization of different solid wastes that may be generated by the
cement plant was conducted to determine the optimal system for disposal
16
and/or reuse of solid wastes. It is to be noted that the solid waste generated
from manufacturing process is almost nil.
3.1.5. Biological Environment
Keeping in view, the importance on biological component of total
environment due to proposed cement manufacturing processes, terrestrial and
aquatic biological aspects were studied in detail. The status of micro-flora as
well as biological status of surface and ground water sources was established
within the impact zone to access the impact of leachates and wastewater
disposal practices. Soil samples were also collected from different villages in
order to access the impact on crop pattern and limitation of soil for growth of
appropriate plants under green belt development recommendation. Plant species
for development of green belt were identified by taking attenuation factor into
consideration for mitigating fugitive emission (FE) of air pollutants.
Besides biological characterization of terrestrial and aquatic environments,
changes in species diversity of flora and fauna in terrestrial as well as aquatic
systems were also studied for impact assessment due to proposed cement
manufacturing activities and other facilities. The forest area adjacent to the
project site is negligible but plantation by the individual households has changed
the entire scenario. Further, in accordance with the government policy on social
forestry, a good number of trees were planted. The trees have attained a
luxurious growth and have been very helpful in bringing a balance in the
ecosystem and moderating climate to a great extent.
3.2. Establishment of baseline for valued environmental components,
as identified in the scope
3.2.1. Air quality
The average concentrations for all 16 AQMS (Table 3.2.1.1) ranged widely
from 84.25 to 56.25 µg/m3 (Table 3.2.1.2). The variations in SPM were due to
local village combustion sources or agricultural activities leading to up liftmen of
settled dust. The low dust concentration is due to occasional rain in the

17

18
19
surrounding vicinity and due to higher density of surrounding vegetation
resulting in overall high humidity. A high concentration is due to the influence of
other industries releasing smoke at ground level.
The limit of SPM established by Central Pollution Control Board (CPCB) for
residential, rural and other areas is 200 µg/m3 (Annexure I). In the present
investigation out of the 16 AQMS the SPM concentration did not exceed the limit
at most of the sites. Some of the sites represent the minimal background SPM
concentration of the region. At most of the sites the SPM concentrations (90
percentile) is above 100 µg/m3 which can also be considered as background of
the region because some build up is due to the vehicular traffic and the work
going on in the industrial units within the zone. The respiratory suspended
particulate matters (RSPM) ranged from 26.75 to 42.50 µg/m3 (Table 3.2.1.3).
The gaseous air pollutants measured were SO2 and NOx. With regards to
NOx concentration the levels are governed by some local natural sources as
certain water bodies are present. The level of NOx as per CPCB limit for
residential, rural and other areas is 60 µg/m3. At all the stations the minimum
and maximum concentration were in the range of 7 to 22 µg/m3 (Table 3.2.1.4).
Thus the area under the present investigation can be classified as unpolluted
zone.
The minimum and maximum S02 concentration was 7 and 15 µg/m3(Table
3.2.1.5)respectively. In general, one can conclude that the S02 concentration
was well below the permissible limit at all the sites of the region.
3.2.2. Noise environment The basic steps associated with impact assessment of the noise
component of the environment involve identification, prediction and evaluation
of the present exposure status of the cement plant workers (occupational) as
well as general population including sensitive receptors viz, hospitals, offices,
schools, colleges etc. Inter relationship among noise pollution sources
anticipated from major cement manufacturing processes and various affected
components of human interest is depicted in (Figure 3.2.2.1)

20

21

22

23
24
The community background noise sources including traffic and other
industrial activities were, therefore, monitored to determine a general noise
pollution status. The scenario for exposure status of in plant workers was
established based on past experience for such plants. The sampling sites for
community exposure survey were selected keeping in view the prevalent
meteorological conditions at the time of survey.
Community Noise
Community noise includes all types of noise in the outdoor acoustic
environment and it is essential to study its variations, magnitude and character
at various locations. A permissible outdoor noise level for urban residential areas
as recommended by IS: 4954, is 35-45 dB(A) (Annexure-III).
The ambient sound pressure level is termed as total noise at a given
location due to all sources. The residual noise level is that level below which the
ambient noise does not seem to drop during a given time interval and is due to
distant unidentified sources.
The extent to which an individual is affected by intruding noise is a
complex phenomenon. The impact of noise on the individual’s health depends
on:
(i) Physical dose of noise viz, noise level, frequency spectrum,
intermittency etc.
(ii) Human factors viz, sex, age, health state, occupation, nature of
activity viz, study, sleep etc.
The intensity of the impact however, depends on:
(i) Psychological and physiological state of the individual and
(ii) The number of individuals exposed.
Day v/s Night Noise Level
The community noise is determined by recording the day-night noise
levels (Ldn). Ldn is defined as the 24 hr equivalent sound level except that
weighting penalty of 10 dB(A) is added to the measured instantaneous noise
level for night time period i.e. from 2200 to 0700 hrs. This is because the same
noise levels during the night time are more annoying than during the day time.
25
At the proposed site of the cement plant the background noise level were
mainly from the vehicular traffic of NH-54 and a already existing stone crusher
near the project site. There were slight variations in the sound level during the
day and night time. As there is no activity of the cement plant at present, and
the difference in day and night levels is very small calculation of Ldn was not felt
necessary for the present study.
Noise Data
In plant Noise Levels
About 16 important noise level stations were set up within and around the
area of the proposed cement plant complex. Noise levels with respect to these
sources were obtained from the data recorded from the sampling stations in
order to generate a scenario for projecting the source strength of process noise
sources and also for the general in plant noise pollution status. The data were
collected at different time of the day. Noise levels of these sources are
summarized in Table 3.2.2.1. The maximum sound level was 60 dB(A) and the
minimum was 28 dB(A).
Noise Level Due To Other Industries
There are a few industries within the 5 km study zone around the
proposed cement plant. The nearest industries are stone crushers and
perfumery. Only some of these units were operational during our study period.
Hence, the noise from these sources may not be as high as expected.
Noise Level Due To Vehicular Activity
The villages are located at a distance of 1 Km from the plant. The
vehicular traffic density is quite high because of the closeness to the NH-54.
Nevertheless, the background road side noise level was within the permissible
limits.
Noise Level At Residential And Commercial Zones
As mentioned earlier,villages are scattered at a distance of 1 Km from the
proposed site. The background noise in the villages falling within the study zone
is primarily due to vehicular traffic and other social activities. The noise level at
residential areas within the study zone are summarized in Table 3.2.2.1.

26

27
3.2.3. WATER ENVIRONMENT
Impact has been assessed on all the surface and ground water sources
falling within the impact zone due to the wastewater from the existing industrial
activities. Prediction of impact on receiving bodies has been achieved by using
versatile water quality models formulated for this purpose.
The site of the cement plant as stated earlier, is very near to the NH-54.
The Jamuna river is close to the project site. The proposed cement plant
proposes not to discharge any effluent outside the site. The water will be
recycled and used.
Survey of prominent villages within the radius of 5 km from the proposed
site of the plant revealed that majority of the people have tube wells and hand
pumps. Some of them were having open ring wells and dug wells also along
with ponds which is used as a source of drinking water as well as for rearing
fish. In such cases the fisheries are for domestic consumption only.
The water requirement of the cement plant as well as the domestic water
requirement of the site will be met from tube wells. The water treatment plant
of the site will have water from deep tube wells. Waste water generated from
the cement plant will be almost negligible and will not be discharged so as to
avoid health hazards at any cost. For study of impact assessment the
quantification of water requirement and wastewater generation were done.
Water Balance
Average annual rainfall in the area is estimated to be 1541.70mm as per
record of Statistical Hand Book, Assam 2006 (Table 3.2.3.1). Considering 10%
of seepage to subsoil water, the water recharge potential of the area within 5
km radius can thus be calculated. This quantity of recharge water is much more
than the maximum required for the proposed coke plant and the population of
the area. The water table is about 0.85 m below ground level during monsoon
season; it is 1.4 meters during the dry season. For the water requirement of the
coke plant, the deep well and the tube-well together with the stream along the
boundary wall of the site is adequate enough.

28

29
Water quality
To access the water quality within the radius of 5 km from the project site,
11 sampling stations were selected. The location and source of the water
sampling sites is given in Table 3.2.3.2. The physicochemical analysis is
presented in Table 3.2.3.3 respectively. The findings of bacteriological analysis
of the sampling stations are shown in Table 3.2.3.4.
All the values of turbidity, alkalinity and hardness, chloride, sulphate and
nitrate are well within permissible limit. Water quality assessment data indicates
that both surface and ground water are suitable for human consumption.
3.2.4. LAND ENVIRONMENT Impact of industrial activity on land environment is primarily attributed to
perpetual fallout of the harmful gaseous emission along with the natural
atmospheric pollutants.
Irrigation practices with wastewater having varying concentration of
pollutants.
Land Use Pattern And Soil Characteristics
Present status of the land-use pattern of the area clearly projects that
though it is more or less plain with high potential of shrub growth, it is mostly
being used for agricultural purposes. The forest cover in the area is not very
high. The lands are cultivated for both domestic and commercial purpose.
Some samples of soil were collected from different points within the study
zone and these samples were laboratory tested to know in details about the
physicochemical characteristics of the soil. The results of soil testing have been
provided in Table 3.2.4.1. The soil is slightly acidic in nature and the texture is
clayey.
Seismic Status
If we study the seismic map of the North- East India, it is observed that
the Kamrup district falls under the seismic magnitude of less than 5.5 which is
the lowest as far as the magnitude of earthquake intensity in the entire North-
eastern region is concerned.

30

31

32

33

34
3.2.5. BIOLOGICAL ENVIRONMENT
The impact on biological environment within the study zone was studied
primarily on terrestrial and aquatic habitats. The presence of coliform organisms
in water is regarded as evidence of faecal contamination as their origin is in the
intestinal track of human and other warm blooded animals. Rapid multiple tube
fermentation technique is used for determining the presence of faecal conforms
and the results are expressed as Most Probable Number (MPN). The estimated
faecal coliform density is reported in terms of MPN per 100 ml. Water samples
were also collected from different sources around the site.
The area and has got an equable climate raining. Temperature as well as
rainfall in the area is quite normal. The vegetation cover is of deciduous in
nature.
Data on fauna was procured from respective Government departments as
well as field observation and onsite visits to the area around the project site.
Terrestrial Biology
Flora And Fauna (General Vegetation And Animals)
The topography of the area is more or less plain consisting of plain land
used for cultivation as well as the hills. The hillocks in the forest areas are of
sand stone and lateritic clay. The roads and lines of communication are highly
developed.
According to the data provided by the Department of Forest, Government
of Assam, the common flora and fauna are depicted in Table 3.2.5.2 and Table
3.2.5.3. The entire area is characterized by the presence of deciduous plants.
The main plant species found in the area are shrubs.
Agriculture
The main source of income of the majority of the population is agriculture.
The agro-climatic condition of the area is most congenial for cultivation of paddy
and seasonal vegetables. In 2004-2005, the total area under production of high
yielding variety of paddy in Nagaon district was 160035 hectares (Statistical
35
Handbook, Assam, 2006). The main cultivated food crop in the area is rice and
its cultivation is done on a commercial as well as domestic basis.
The eco-friendly systems of Integrated Nutrient Management and
Integrated Pest Management are being introduced by the Government to make
the farmers aware of the adverse effect of the chemicals. These practices will
help in sustaining soil health and to control the depletion of soil nutrient.
Fisheries
Data on commercial fisheries are important to denote the fisheries
potential of the fresh water ecosystem of the region and to ascertain the likely
impacts that may arise due to the project activity. Fishing is an important small
scale industry of the area and many families are dependent on it for their
livelihood. In addition the Jamuna and Kopili River also supports many varieties
of fishes and is an important spawning ground. In the year 2005-2006, there
were 40 registered fisheries and 12 registered river fisheries in the entire
Nagaon district. (Table 3.1.5.1. Source: Statistical Handbook, Assam, 2006).

36

37

38

39
Table 3.2.5.3 : List of Faunal species in the study zone
Sl. No. Scientific Name Common Name Local
Distribution
A Mammals
1 Bandicota bengalensis Indian Mole Rat C
2 Canis aures Jackel C
3 Felis bengalensis Leopard cat R
4 Felix chaus Jungle cat R
5 Macaca assamesensis Assamese macaque
C
6 Oryctolagus coniculus Rabbit C
7 Ratus ratus Rat C
8 Vulpes bengalensis Indian fox R
B Birds
9 Acridotheres tristis Common myna C
10 Centropus sinensis Crow pheasant S
11 Columba livia Blue rock pigeon C
12 Corvus splendens House crow C
13 Cuculus sparverioides Cuckoo S
14 Eudynamys scolopacea
Koel C
15 Passer domesticus House sparrow C
16 Spliornis cheela Crested serpent eagle
R
C Reptiles
17 Ahaetulla nasutus Green whip snake C
18 Gecko gecko Common gecko C
19 Calotes versicolor Common garden lizard
C
20 Hemidactylus flaviviridis
House wall lizard C
21 Naja naja Indian cobra C
22 Python molurus Indian python C
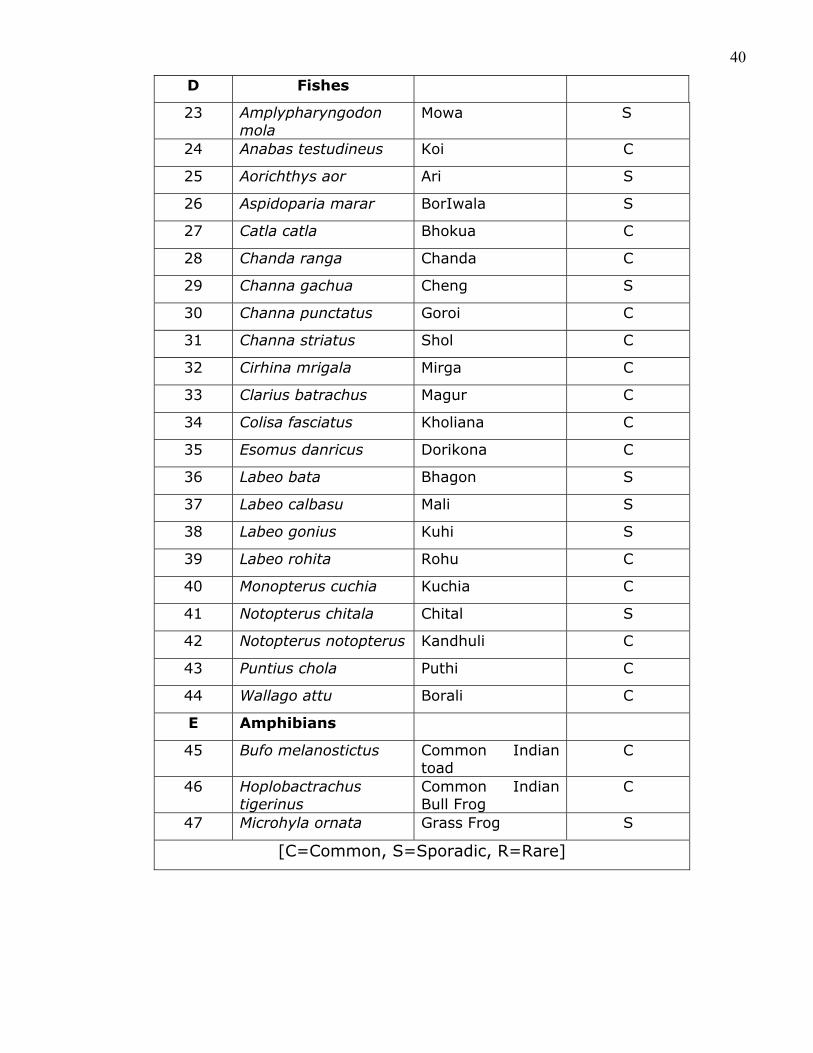
40
D Fishes
23 Amplypharyngodon mola
Mowa S
24 Anabas testudineus Koi C
25 Aorichthys aor Ari S
26 Aspidoparia marar BorIwala S
27 Catla catla Bhokua C
28 Chanda ranga Chanda C
29 Channa gachua Cheng S
30 Channa punctatus Goroi C
31 Channa striatus Shol C
32 Cirhina mrigala Mirga C
33 Clarius batrachus Magur C
34 Colisa fasciatus Kholiana C
35 Esomus danricus Dorikona C
36 Labeo bata Bhagon S
37 Labeo calbasu Mali S
38 Labeo gonius Kuhi S
39 Labeo rohita Rohu C
40 Monopterus cuchia Kuchia C
41 Notopterus chitala Chital S
42 Notopterus notopterus Kandhuli C
43 Puntius chola Puthi C
44 Wallago attu Borali C
E Amphibians
45 Bufo melanostictus Common Indian toad
C
46 Hoplobactrachus tigerinus
Common Indian Bull Frog
C
47 Microhyla ornata Grass Frog S
[C=Common, S=Sporadic, R=Rare]
41
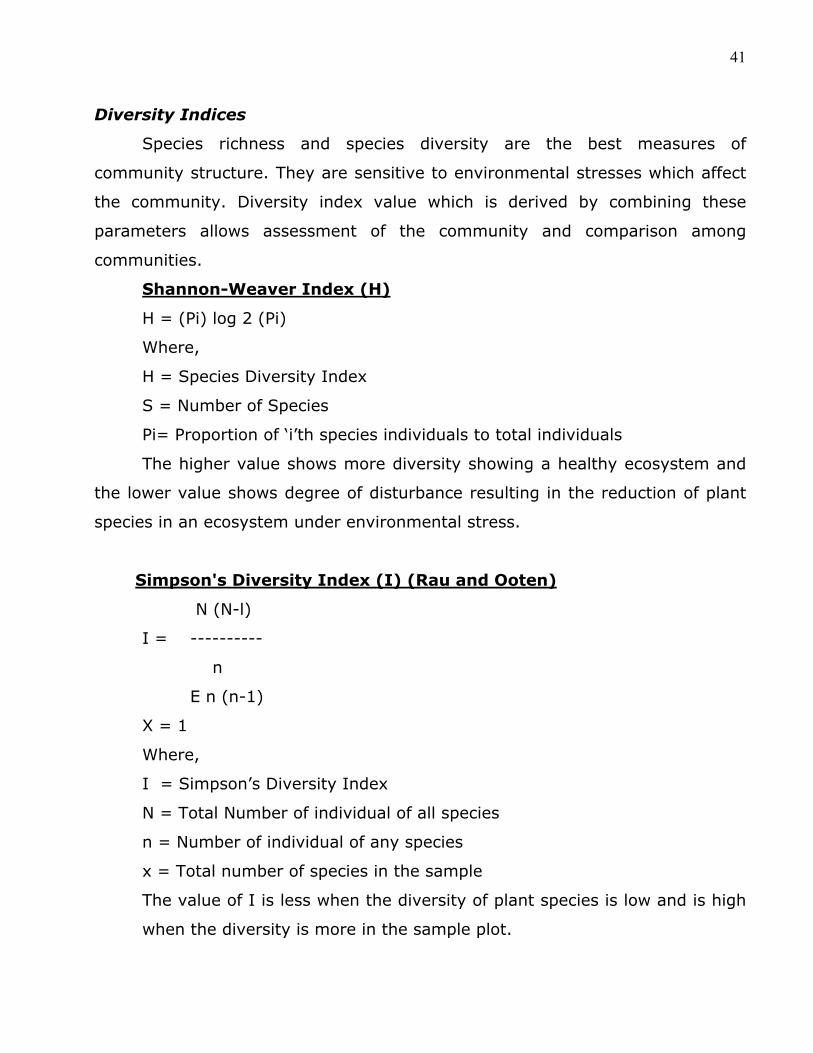
Diversity Indices
Species richness and species diversity are the best measures of
community structure. They are sensitive to environmental stresses which affect
the community. Diversity index value which is derived by combining these
parameters allows assessment of the community and comparison among
communities.
Shannon-Weaver Index (H)
H = (Pi) log 2 (Pi)
Where,
H = Species Diversity Index
S = Number of Species
Pi= Proportion of ‘i’th species individuals to total individuals
The higher value shows more diversity showing a healthy ecosystem and
the lower value shows degree of disturbance resulting in the reduction of plant
species in an ecosystem under environmental stress.
Simpson's Diversity Index (I) (Rau and Ooten)
N (N-l)
I = ----------
n
E n (n-1)
X = 1
Where,
I = Simpson’s Diversity Index
N = Total Number of individual of all species
n = Number of individual of any species
x = Total number of species in the sample
The value of I is less when the diversity of plant species is low and is high
when the diversity is more in the sample plot.
42
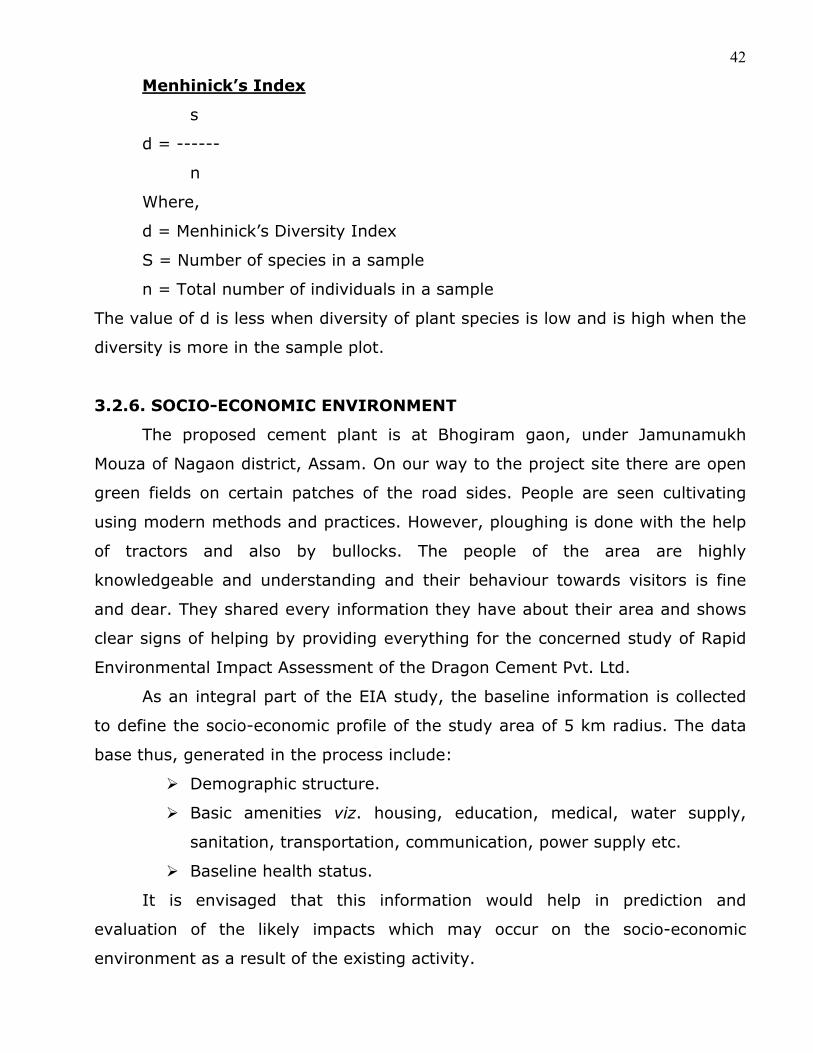
Menhinick’s Index
s
d = ------
n
Where,
d = Menhinick’s Diversity Index
S = Number of species in a sample
n = Total number of individuals in a sample
The value of d is less when diversity of plant species is low and is high when the
diversity is more in the sample plot.
3.2.6. SOCIO-ECONOMIC ENVIRONMENT
The proposed cement plant is at Bhogiram gaon, under Jamunamukh
Mouza of Nagaon district, Assam. On our way to the project site there are open
green fields on certain patches of the road sides. People are seen cultivating
using modern methods and practices. However, ploughing is done with the help
of tractors and also by bullocks. The people of the area are highly
knowledgeable and understanding and their behaviour towards visitors is fine
and dear. They shared every information they have about their area and shows
clear signs of helping by providing everything for the concerned study of Rapid
Environmental Impact Assessment of the Dragon Cement Pvt. Ltd.
As an integral part of the EIA study, the baseline information is collected
to define the socio-economic profile of the study area of 5 km radius. The data
base thus, generated in the process include:
Demographic structure.
Basic amenities viz. housing, education, medical, water supply,
sanitation, transportation, communication, power supply etc.
Baseline health status.
It is envisaged that this information would help in prediction and
evaluation of the likely impacts which may occur on the socio-economic
environment as a result of the existing activity.
43
Socio -Economic Profile of Demographic Structure
Table 3.2.6.1 to Table 3.2.6.6 give details regarding the demographic
structure of the study area. The people of the area mostly belong to the
agricultural class and their behaviour towards us shows that they are honest
and people of integrity.
Socio-economic Profile Of Basic Amenities
The following observations are made by studying the socio-economic
aspects of the study area.
Most of the villages in the study zone have primary schools. Few villages
have middle as well as English medium schools also. There is a college (Haji
Anwar Ali College) within 5 Km radius of the cement plant.
Medical facilities are average but not highly developed. There is one 30
bedded community health centre which is 2.5 Km from the project site.
As regards power supply, it is a developed sector in this area. All the
villages are well connected with pitched as well as kutcha roads and the railway
line runs close to the area.
Post office, sub post office and telegraph office are available in the area
which designates the area as being on the process of development.
Socio-Economic Survey
The socio-economic survey serves as a tool to establish contacts with the
local residents and with the help of personal inventories an insight into their
feelings about the project is obtained. These personal inventories give
information about the status of the respondents with reference to education,
occupation, wealth as well as their awareness about the project, their opinion
and also their apprehensions about the project. This helps in visualizing,
assessing and predicting the impacts of the project on socio-economic
environment. For the survey, adult males and females were selected on random
basis.
The villages have small markets “haat” to cater to the daily needs of the
people.
44
Radio and television are available uniformly in all the villages within the
study zone.
Awareness And Opinion About The Project
The atmosphere of the study zone is cool and calm and apart from this,
the people’s behavior towards us was something totally unquestionable. About
50% of the village people are poor; yet they never forget to provide hospitality
to anyone visiting them and it very well proves that they are honest and people
of integrity.
Project awareness amongst the respondents is very high. Most of them
have either heard about it from others or seen some activities themselves.
As regards to the opinion of the local people, it is very heartening to note
that barring only 20% of the surveyed households in all the villages have opined
that the proposed cement plant is good as it would create some employment
opportunities for the local youths. But they made it amply clear that every
measure should be adopted by the company to minimize the levels of
environmental pollution in their area. On the whole the people at large opined
that this area could progress immensely through industrial development. What
is needed is not a ban on industrial development but a control on pollution
emissions using improved machineries and equipments. If pollution is controlled
at large, they feel that the high level of industrial development would bring their
region in prominence on the indian industrial development map.
Salient Observations
Most of the people residing in the villages are farmers, some are into
service and few are doing small business and the local educated unemployed
youths are looking forward to the industrial ventures being established in this
region for increased job opportunities.
Wells seem to be the common source of water supply. Sanitation facilities
are rather poor and open field defecation among the labour class working in the
industries of the area is quite common. Medical facilities are not up to the mark.
There is only one Community Health Centre.
45
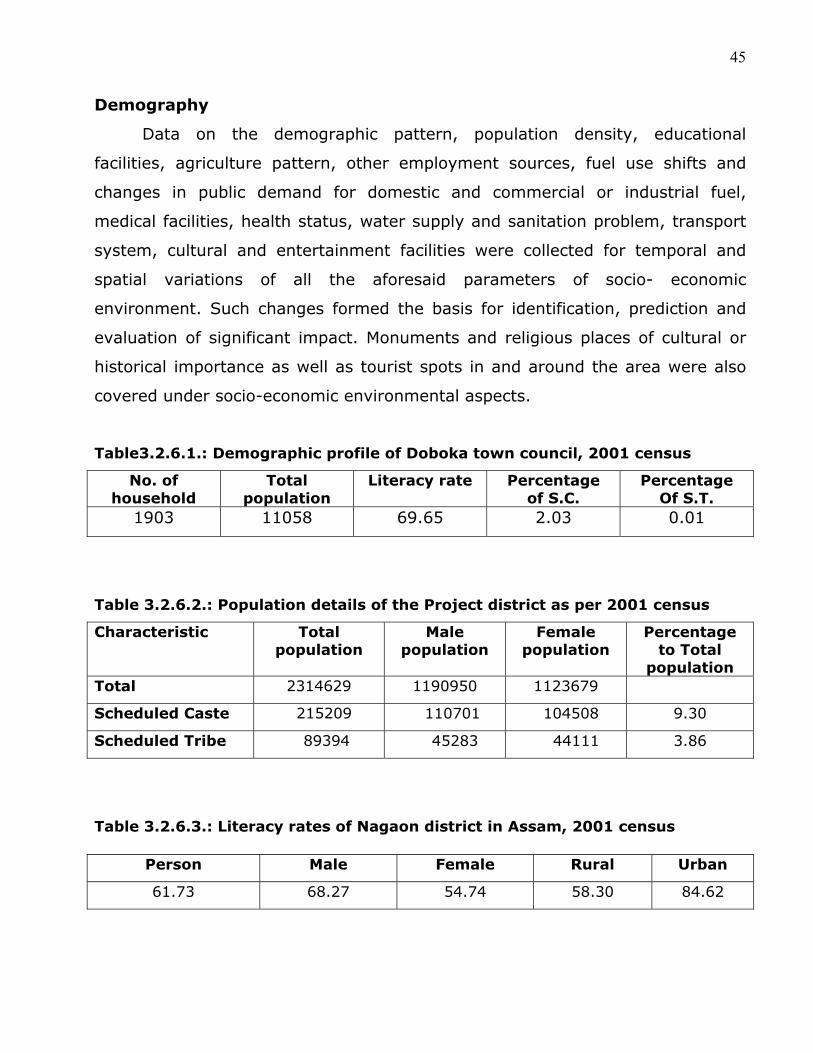
Demography
Data on the demographic pattern, population density, educational
facilities, agriculture pattern, other employment sources, fuel use shifts and
changes in public demand for domestic and commercial or industrial fuel,
medical facilities, health status, water supply and sanitation problem, transport
system, cultural and entertainment facilities were collected for temporal and
spatial variations of all the aforesaid parameters of socio- economic
environment. Such changes formed the basis for identification, prediction and
evaluation of significant impact. Monuments and religious places of cultural or
historical importance as well as tourist spots in and around the area were also
covered under socio-economic environmental aspects.
Table3.2.6.1.: Demographic profile of Doboka town council, 2001 census
No. of household
Total population
Literacy rate Percentage of S.C.
Percentage Of S.T.
1903 11058 69.65 2.03 0.01
Table 3.2.6.2.: Population details of the Project district as per 2001 census
Characteristic Total population
Male population
Female population
Percentage to Total
population Total 2314629 1190950 1123679
Scheduled Caste 215209 110701 104508 9.30
Scheduled Tribe 89394 45283 44111 3.86
Table 3.2.6.3.: Literacy rates of Nagaon district in Assam, 2001 census
Person Male Female Rural Urban
61.73 68.27 54.74 58.30 84.62
46
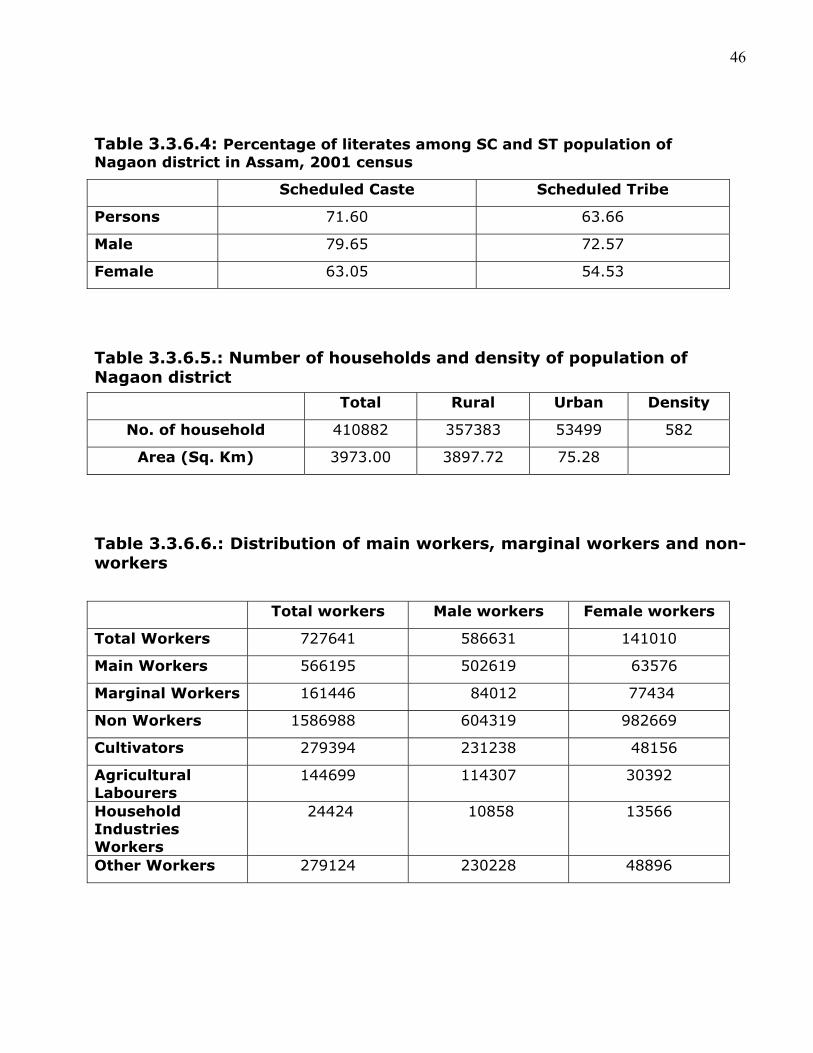
Table 3.3.6.4: Percentage of literates among SC and ST population of Nagaon district in Assam, 2001 census
Scheduled Caste Scheduled Tribe
Persons 71.60 63.66
Male 79.65 72.57
Female 63.05 54.53
Table 3.3.6.5.: Number of households and density of population of Nagaon district
Total Rural Urban Density
No. of household 410882 357383 53499 582
Area (Sq. Km) 3973.00 3897.72 75.28
Table 3.3.6.6.: Distribution of main workers, marginal workers and non-workers
Total workers Male workers Female workers
Total Workers 727641 586631 141010
Main Workers 566195 502619 63576
Marginal Workers 161446 84012 77434
Non Workers 1586988 604319 982669
Cultivators 279394 231238 48156
Agricultural Labourers
144699 114307 30392
Household Industries Workers
24424 10858 13566
Other Workers 279124 230228 48896
47
4. ANTICIPATED ENVIRONMENTAL IMPACTS & MITIGATION MEASURES
In this section the impacts of the project activities on the environment of
the project site are assessed. The probable impacts during the various phases of
the project lifecycle to the environmental receptors are enumerated.
PREDICTION OF IMPACT Many well designed scientific techniques and methodologies are available
to predict impact on physico-ecological environment. Techniques based on
mathematical model and in situ environmental monitoring for establishing the
impact on various environmental components can be used to estimate
quantitatively the cause and effect relationships between source of pollution and
different environmental components.
4.1.1. Visual Impacts and Aesthetics
Potential landscape and visual impacts will result from both onsite
activities such as leveling the land, setting up of machineries, temporary
storage, onsite disposal of process waste etc.
Impacts from onsite works
As part of the setting up of the cement plant there will be an adverse
visual impact for residents of the area which has very few industries. The added
noise levels, operation of vehicles, and the people residing in the campsite will
also affect the aesthetic and peaceful environment of the place. Debris
generated during decommissioning activities along with domestic waste would
be stored temporarily within the site before final offsite disposal.
Impacts from offsite works
Improper selection and operation of the plant area might result in visual
impacts in the surrounding. Disposal of domestic solid waste as well as debris
generated at any place other than the designated site can lead to visual
impacts.
48
4.1.2. Impact to air quality
In the proposed cement unit there are no major stacks, only processed
vents are present. Among process vents only one stack will be provided for kiln
(120 feet height). Only vents attached to the dust collection systems where
collected dust is recycled into the process are present. Existing ground level
concentration of ambient air quality and static air volume sampling also was
undertaken as a reference. There will be air pollution from Generator(DG) set.
The primary pollutants emitted by a DG set consist of particulate matter, oxides
of sulphur and nitrogen, carbon monoxide, carbon dioxide and hydrogen.
Combustion of fuel in a DG sets typically happens at high temperatures resulting
in generation of considerable amounts of NOX. The SO2 concentration in
emissions is dependent on the sulphur content in fuel burnt and particulate
matter consists of unburnt carbon particles.
To predict the ground level of concentrations (GLCs) at various distances
from the source of the above mentioned pollutants, an air modeling exercise has
been undertaken.
The impact on air quality due to automobile emission has been predicted
to be insignificant because of the anticipated increase in vehicular movement
(46 trucks per day) due to the proposed project is marginal.
The impact of these emissions will be limited to a very short distance. The
roads from the nearby towns to the plant site are tar roads and the fugitive
emission due to the vehicular traffic will be insignificant.
However, during production, if pollution level increases beyond the
prescribed limits, then mitigative measures should be implemented in order to
control the menace of pollution to the normal limits which has been thoroughly
discussed in the Environment Management Plan for this particular cement plant.
Plant Emission Scenario
Emission from cement plants vary greatly in both quantity and type. The
most important factor affecting cement plant emissions include the process of
burning, use of pollution control equipments/ storage of raw material and
49
general level of their maintenance. The major pollutants emitted are SPM, SOx,
NOx, CO and dust particles.
The prime source of air pollution from the cement plant is the stack
emission. The stack emission was theoretically estimated through thermal
balance under DFR.
Mathematical Model Details
In an attempt to predict impact on ambient air quality, certain air quality
simulation models viz, PTPLU, PTDIS, PTMTP and PAL were identified for
different purposes. These models are part of the UNAMAP package of air quality
simulation modeling, algorithms released by USEPA and modified for indigenous
applications at NEERL. These models have a long history of applications in
regulatory situations viz, New Source Reviews (NSR), Prevention of Significant
Deterioration (PSD) analysis. State Implementation Plan (SIP) etc. and hence
their usage here is highly appropriate.
The PTPLU (point plume) computes maximum ground level concentration
(MGLC) v/s Distance (km) from source as a function of wind speed and stability
classes with extrapolated wind speed for a point source. It gives short term (10
min-1 hr average) concentrations.
PTDIS (point-distance) predicts the variation of start time (10 min-1 hr
average) ground level plume centre line concentrations with distance due to
single point source for a given set of emission, meteorology and downwand
distances.
PTMTP (multi-point source) is short term (1-24 hr average) air quality
dispersion model. PTMTP computes ground level concentration at multiple
receptors resulting from multiple point sources.
PAL (Point-Area-Line source model) is short term Gaussian-Steadly- state
algorithms estimates GLC from point, area and line sources. It calculates hourly
concentrations and average concentrations for 24 hours can also be obtained.
Air Quality Prediction
The first step in such an approach is to run the available data through a
“screening model” (PTPLU) where extreme estimates of the worst case scenario
50
to be done. The results of the screening exercise have significance as a
clearance of site due to sensitive receptors.
Comparative Method
In this method we have to choose a similar working condition for data that
are readily available. The quality of environmental attributes in similar projects
would guide in forecasting the environmental pollution of the project in
question. This method also presupposes that data for other projects are
available and on this account the situation is not encouraging because of the
following features.
Apart from the cement plant there are few number of other industries like
stone crushers and perfumery operating in the area. They have their own share
of contribution to environmental degradation. Most of the industries have not
yet adopted pollution control measures. Moreover, no systematic studies have
as yet been carried out to determine the exact extent of pollution caused by
different industries.
A. Matrix Method
The most commonly adopted environmental impact assessment
methodology is the matrix method with weighting scheme approach for various
impact .The impact score is considered before mitigation measures are
implemented and after implementation quantification of degree of impact as well
as effect of mitigation measures is brought out. The environmental attributes
considered for assessing the impact of the project are air, surface and ground
water, solid waste disposal, noise, vegetation, forest and wildlife. The
socioeconomic aspects like land use pattern and places of tourist interest were
also considered.
Matrices are similar to checklists in that they use a tabular format for
presenting information. The matrix is however, more complex and can best be
described as a 2-dimensional checklist. Matrices can be used to evaluate to
some degree the impacts of a project’s activities on resources, and can also be
extended to consider the cumulative and indirect impacts, as well as impact
interactions on a resource. Matrices can not be used in themselves to quantify
51
the actual significance of impacts; this can only be done using other methods. It
is however possible to weight matrices to reflect factors such as duration,
frequency and extent. They can also be used to score or rank impacts. If
weighting or scoring are used, the criteria must be clearly set out. This approach
relies on expert opinion to provide ranks/weights for each project with respect
to each environmental effect. By looking for patterns in the finished matrix, for
example columns or rows with numerous impact strikes, it is possible to develop
a clear picture of how impacts combine in a cumulative way on a particular
environmental receptor. In doing so, probable impact interactions can also be
identified. Matrices can be used during the Scoping stages of impact
assessment. They are also useful tools to summaries and present impacts within
the Environmental Statement. Keeping in view the type of industry and
relevance, we followed the Simple matrix, Weighted matrix and Stepped Matrix.
B. Simple Matrices
Simple matrices can be organized to cross reference the different phases
of a project (e.g. construction, operation and decommissioning) against
elements of the environment or sensitive receptors. Cumulative impacts may for
example be considered in a separate column by including the effects of past,
present and future actions on resources, alongside the range of effects caused
by the action of immediate concern. The following is the simple matrix using
symbols. Numerical scores are used equally well to show the approximate scale
or magnitude of the impact.
Table A: Simple Matrix
* Low Adverse effect ** Moderate Adverse Effect *** High adverse effect + beneficial effect
Proposed Action Potential Impact
Area Construction Operation Mitigation
Past
Action
Other
present
Action
Future
Action
Cumul-
ative
Impact
Landscape * * + * *
Ecology * *
Water Quality * *
Land use * *
Cultural Heritage
52
C. Weighted Matrices
By introducing weighting into a matrix it allows the ranking of impacts. It
also provides a tool for assessing complex effects. However, use of such
complex approaches may make interpretation of the results difficult for others.
Weighting an impact will be subjective and it is therefore important that the
assessment explains assumptions made and the criteria used. Weighted
matrices allow the magnitude of impacts to be used quantitatively. A weight is
assigned to each environmental component, indicating its importance. The
impact of the project on each component is then assessed and scored.
Weighting or scoring can also be used to give an overall total score for the
project or alternative options. Extreme caution should be practiced if these
weights are to be used additively during the comparison of project options or to
determine combined impact values as the rankings do not work in a strict
additive way. The following is the weighted matrix developed to compare
alternative sites.
Table B: Weighted Matrix
Environmental
Component Construction Operation
A
Relative
Weighting
(Total
100)
B A X B B A X B
Air 10 1 10 2 20
Water 35 2 70 1 35
Noise 8 3 24 2 16
Landscape 10 5 50 1 10
Ecology 27 1 27 3 81
Total
Cumulative
Impact
100 181
162
53
D. Stepped Matrices
Stepped matrices are a more advanced type of matrix that considers how
the various activities of a project relate to the environmental resource or
parameter. It shows resources against functions of the environment. This
approach therefore shows how one action can impact on a resource, which can
then cause changes on another resource. Table 3 is the Stepped Matrix
developed by Froelich and Sporbeck for a road scheme. Air quality in terms of
ground level concentration (GLCs) at various receptor points have been
calculated using the ISC 3 short term model which is considered to standard
model for prediction of air quality impacts world wide. The emission factor for
various pollutants, viz. NOx ,SO2,and particulate matter was presumed .
The model run was carried out based on screening meteorology to be able
to predict worst air quality impacts for average 24 hr period that may be caused
a peak production .
The result of the run shows that maximum GLC will occur about 200 m
distance from the stack and than reducing considerably with distance and
reaching levels well within Nation Ambient Air Quality Standards ( NAAQS)
ANNEXURE –I at about 1 km from the project site .
The maximum predicted 24 hr average concentration of pollutants at that
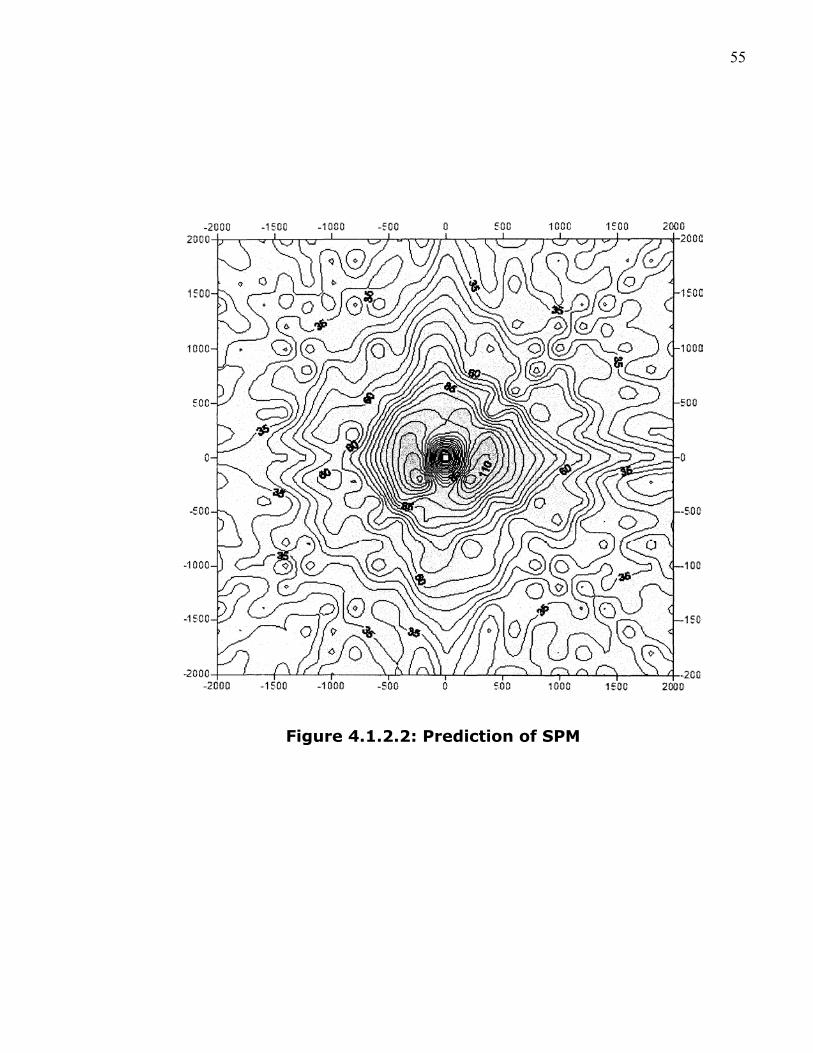
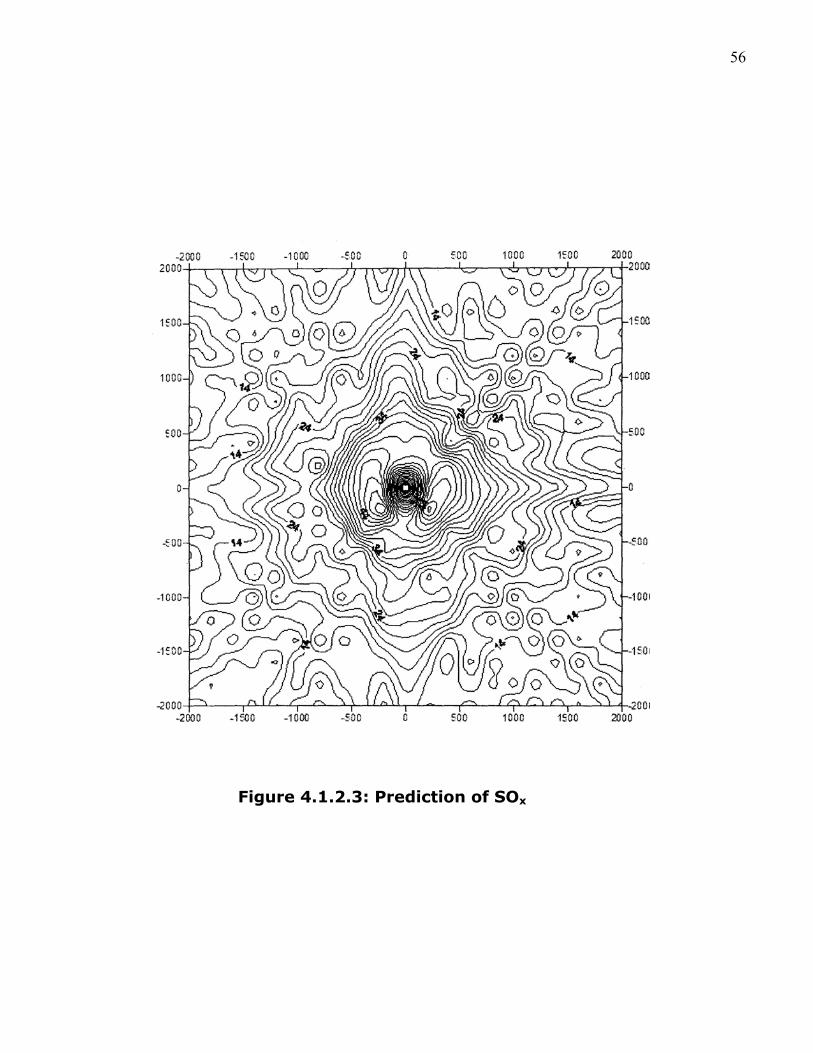
distance is given below NOx - 48 µg/m3 SOx - 6.46 µg/m3 Particulates - 76.24 µg/m3
The GLCs have been spatially mapped and isoclines for air pollutant concentration have been presented in the Figure 4.1.2.1 – 4.1.2.3. The impact identification network for air pollution is in Figure 4.1.2.4.
54
Figure- 4.1.2.1: Prediction of NOx
55
Figure 4.1.2.2: Prediction of SPM
56
Figure 4.1.2.3: Prediction of SOx

57
58
4.1.3. NOISE ENVIRONMENT
In plant Occupational Exposure
The sound power radiated by a source spreads to the space as the
pressure waves travel outwards. Hence, it decreases with distance and also gets
affected by environmental conditions.
The sound pressure level at a distance from the source can be calculated
by using the following mathematical model:
Lpo = Lw + DI - 20 logr - Ae -10 log2 .......(I)
Where,
Lpo = sound pressure level at the receiver located in the direction 0 and
distance v from the source.
Lw = sound power level of source.
DI = directivity index of source in the direction 0 (for hemispherical
radiation DI = 3 dB(A)
r = distance of receiver from source.
Ae = excess attenuation caused by environmental conditions.
The total impact (Lp total) of all the sources at particular place is then
estimated using the following model:
Lp total = 10 log (10 Lp 01 / 10 + 10 Lp 02/10 +......) .......(II)
In a cement plant, the noise sources are generally scattered within the
boundary of the plant if it has sufficient free space. The noise pressure at the
centre of the plant , as calculated from the above model and considering the
general plant layout of an identical cement plant comes to about 84-90 dB(A)
which is within the OSHA specifications for damage risk criteria for noise
exposure (Annexure II). These values, however, may vary depending upon the
proximity of noise generating sources within the site.
Depletion In Noise Level Status Due To Green Belt Development
The sound pressure level generated by a noise source decreases with
increasing distance from the source due to wave divergence according to the
following relationship:
59
Lp = Lw - 20 log r - Ae - 8 (dB)
Ae includes:(a) Attenuation by air absorption
(b) Attenuation by vegetation
Atmospheric attenuation at a temperature of 20°C has been calculated
from the equation:
7.4*F2*r 10-8
Ae = ————————— (dB)
0
where,
F = frequency, Hz or octave or 1/3 octave-band centre frequency.
R = distance between source and receiver (m)
0 = relative humidity (%)
Attenuation by vegetation can be of two types:
(a) attenuation by shrubs or grass and
(b) attenuation by forests.
For the proposed green belt, the attenuation caused by the forest
community was applied which has been calculated by the equation:
Aef = 0.01 Fl / 3r dB(A)
Where,
f = frequency of sound.
r = distance traveled.
If the sound power of a source is not known but the sound pressure level
Lpl at a distance r1 from the source is known the sound pressure level Lp2 at a
distance r2 from the source can be calculated from the equation:
Lp2 = Lpl - 20 log (r2/r1) - Ae 1,2
60
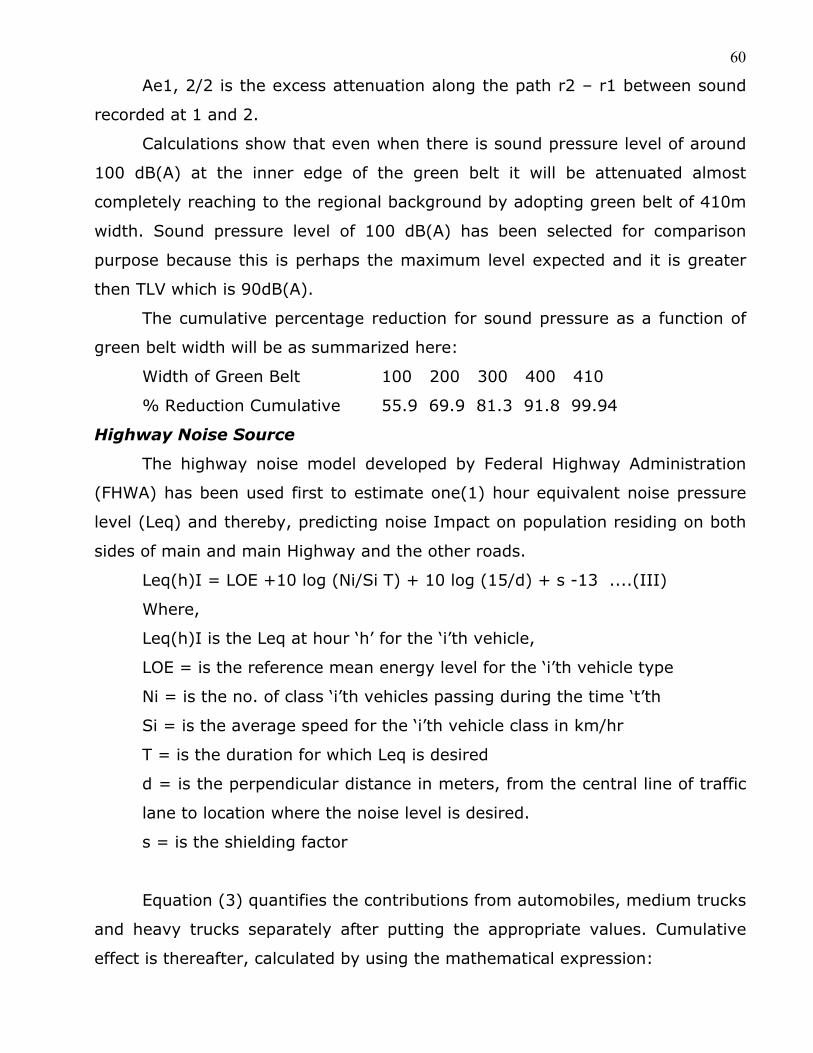
Ae1, 2/2 is the excess attenuation along the path r2 – r1 between sound
recorded at 1 and 2.
Calculations show that even when there is sound pressure level of around
100 dB(A) at the inner edge of the green belt it will be attenuated almost
completely reaching to the regional background by adopting green belt of 410m
width. Sound pressure level of 100 dB(A) has been selected for comparison
purpose because this is perhaps the maximum level expected and it is greater
then TLV which is 90dB(A).
The cumulative percentage reduction for sound pressure as a function of
green belt width will be as summarized here:
Width of Green Belt 100 200 300 400 410
% Reduction Cumulative 55.9 69.9 81.3 91.8 99.94
Highway Noise Source
The highway noise model developed by Federal Highway Administration
(FHWA) has been used first to estimate one(1) hour equivalent noise pressure
level (Leq) and thereby, predicting noise Impact on population residing on both
sides of main and main Highway and the other roads.
Leq(h)I = LOE +10 log (Ni/Si T) + 10 log (15/d) + s -13 ....(III)
Where,
Leq(h)I is the Leq at hour ‘h’ for the ‘i’th vehicle,
LOE = is the reference mean energy level for the ‘i’th vehicle type
Ni = is the no. of class ‘i’th vehicles passing during the time ‘t’th
Si = is the average speed for the ‘i’th vehicle class in km/hr
T = is the duration for which Leq is desired
d = is the perpendicular distance in meters, from the central line of traffic
lane to location where the noise level is desired.
s = is the shielding factor
Equation (3) quantifies the contributions from automobiles, medium trucks
and heavy trucks separately after putting the appropriate values. Cumulative
effect is thereafter, calculated by using the mathematical expression:

61
Leq(h) total = 10 log (10 LeqA/10 + 10 Leq MT/10 + 10 Leq
Ht/10)........4
Where,
LeqHT, LeqMT and LeqA are equivalent noise level is for heavy trucks,
light trucks and automobiles respectively.
Prediction Of Impact On Community
Impact on community noise levels due to the proposed cement plant are
expected due to various factors viz. power of noise sources, increase in overall
traffic and other regional growth activity of the impacted zone thereby, causing
rise in regional noise level. As regards the impact prediction on noise component
of air environment, the levels of 40-45 dB(A) are expected within the boundary
of the cement plant which will be attenuated to 32-25 dB(A) after minimal green
belt (inplant) recommendations are implemented. The highway at 50-54 dB(A)
noise level after 100 m without green belt on highway and the same shall drop
further to lower than 46-48 dB(A) when green belt plantation is undertaken with
the help of local authorities.
4.1.4. WATER ENVIRONMENT
Industrial wastewater, if discharged to surface water, can give rise to
significant deterioration in its water quality. The extent of such influences, in
addition to wastewater characteristics and quantity, also depends upon the
hydraulic and water quality characteristics of quanitity of available water in the
water body used for disposal. Mathematical models which stimulate water
quality transformations in a water body by means of a set of mathematical
equations provide means to quantify such influences under different wastewater
disposal and rich flow scenarios. Such analysis, therefore, provides the basis
for:
Assessment of impact of a proposed industry on surface water quality and
prediction of surface water quality profile due to existing industry for conditions
for which monitored observations are not available.
62
It should be noted that the wastewater generated during the process of
manufacturing in cement plants is minimal and therefore is of less important for
our purpose. But in order to be sure about the impacts of wastewater on
environmental pollution, we have done water quality survey around the plant
site.
The state-of-art river water quality model QUAL2E of US Environmental
Protection Agency (EPA) can be used to predict the likely water quality profiles
under such conditions in this very report.
Water Quality In River
BRIEF DESCRIPTION OF QUAL2E
QUAL2E is a comprehensive and versatile stream water quality model. It
can simulate upto 15 water quality constituents in river system, namely pH,
BOD, temperature, algae as chlorophyll, organic, ammonia, nitrite and nitrate
nitrogen, organic and dissolved phosphorus, coliforms and arbitrary non-
conservative constituent and three conservative constituents. The model works
under the assumption of completely mixed free regime and steady state
conditions in terms of initial conditions and forcing functions. Diurnal variations
in certain water quality constituents such as temperature and DO variations due
to photosynthesis can also be simulated under pseudo-dynamic mode. The basic
equation solved by QUAL2E is the one dimensional and vector-dispersion mass
transport equation, which is numerically integrated for each water quality
constituent. This equation includes the effects of advection, dispersion, dilution,
constituent reactions and interactions, and sources and sinks. Under steady
state mode for any constituent, C, this equation can be written as:
dC
d(AxDL------- )
dx d(AxuC) dC S
----------------- --------------- ---- + ---- = 0 ……………(1)
Ax dx Ax dx dt V
Where,
Ax = cross-sectional area (L2)
63
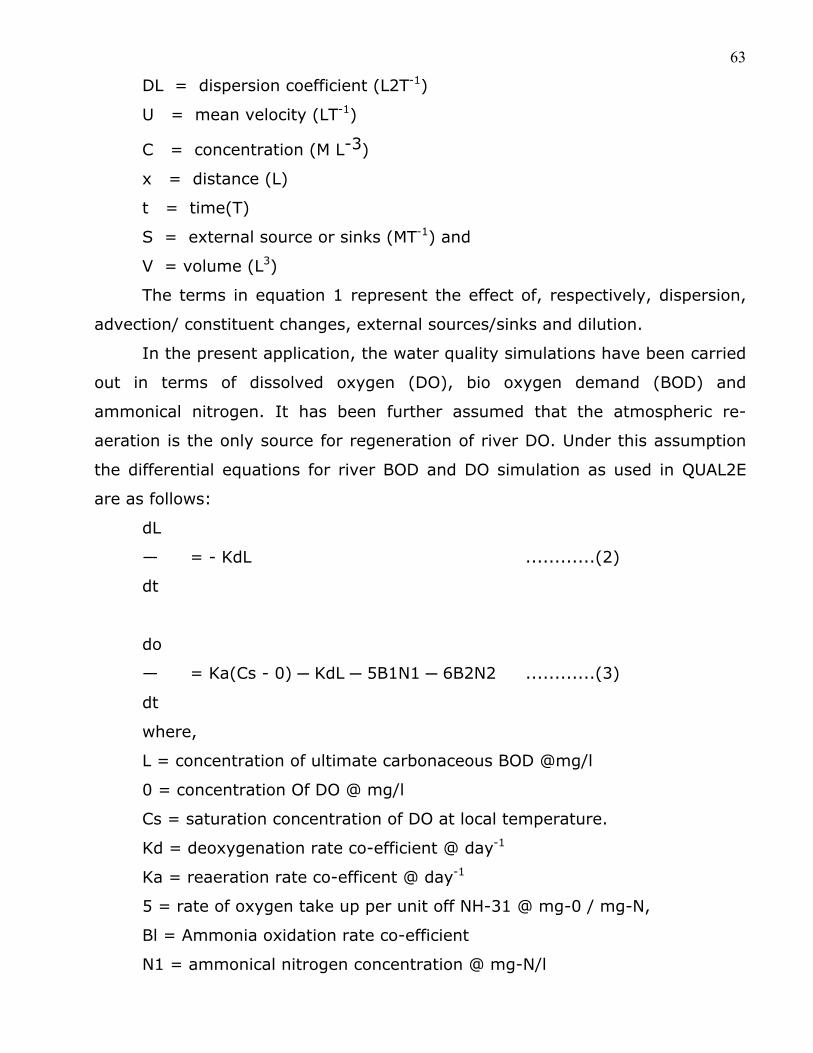
DL = dispersion coefficient (L2T-1)
U = mean velocity (LT-1)
C = concentration (M L-3)
x = distance (L)
t = time(T)
S = external source or sinks (MT-1) and
V = volume (L3)
The terms in equation 1 represent the effect of, respectively, dispersion,
advection/ constituent changes, external sources/sinks and dilution.
In the present application, the water quality simulations have been carried
out in terms of dissolved oxygen (DO), bio oxygen demand (BOD) and
ammonical nitrogen. It has been further assumed that the atmospheric re-
aeration is the only source for regeneration of river DO. Under this assumption
the differential equations for river BOD and DO simulation as used in QUAL2E
are as follows:
dL
— = - KdL ............(2)
dt
do
— = Ka(Cs - 0) ─ KdL ─ 5B1N1 ─ 6B2N2 ............(3)
dt
where,
L = concentration of ultimate carbonaceous BOD @mg/l
0 = concentration Of DO @ mg/l
Cs = saturation concentration of DO at local temperature.
Kd = deoxygenation rate co-efficient @ day-1
Ka = reaeration rate co-efficent @ day-1
5 = rate of oxygen take up per unit off NH-31 @ mg-0 / mg-N,
Bl = Ammonia oxidation rate co-efficient
N1 = ammonical nitrogen concentration @ mg-N/l

64
B2 = nitrate oxidation rate co-efficient @ day-1
N2 = nitrate nitrogen concentration @ mg-N/l
For the conversions from 5 day BOD to ultimate BOD following equation is
used:
BOD5 = BODu (1.0 - exp (-5* KBOD) ............(4)
Where,
BOD5 = 5 day BOD @ mg/l
BODu = ultimate BOD @mg/l
KBOD = BOD conversion rate co-efficient @ day-1
Following differential equations governing transformations of organic
nitrogen to ammonia, to nitrate and finally to nitrate are used in QUAL2E.
DN4
------ = -B31N4 ……………………………….(5)
dt
N4 = concentration of organic nitrogen @ mg-N/l
B3 = rate constant of hydrolysis of organic nitrogen to
ammonia nitrogen @ day-1
DN1
----- = B3N4 ─ B1N1 ……………………………… (6)
dt
Where,
N1 = concentration of ammonical nitrogen @ mg-N/l
B1 = rate constant for oxidation of ammonical nitrogen @day-1
dN2
----- = B1N1 ─ B2N2 ………………………………(7)
dt
N2 = concentration of nitrate nitrogen @ mg-N/l
B2 = rate constant for oxidation of nitrate nitrogen @ day-1
65
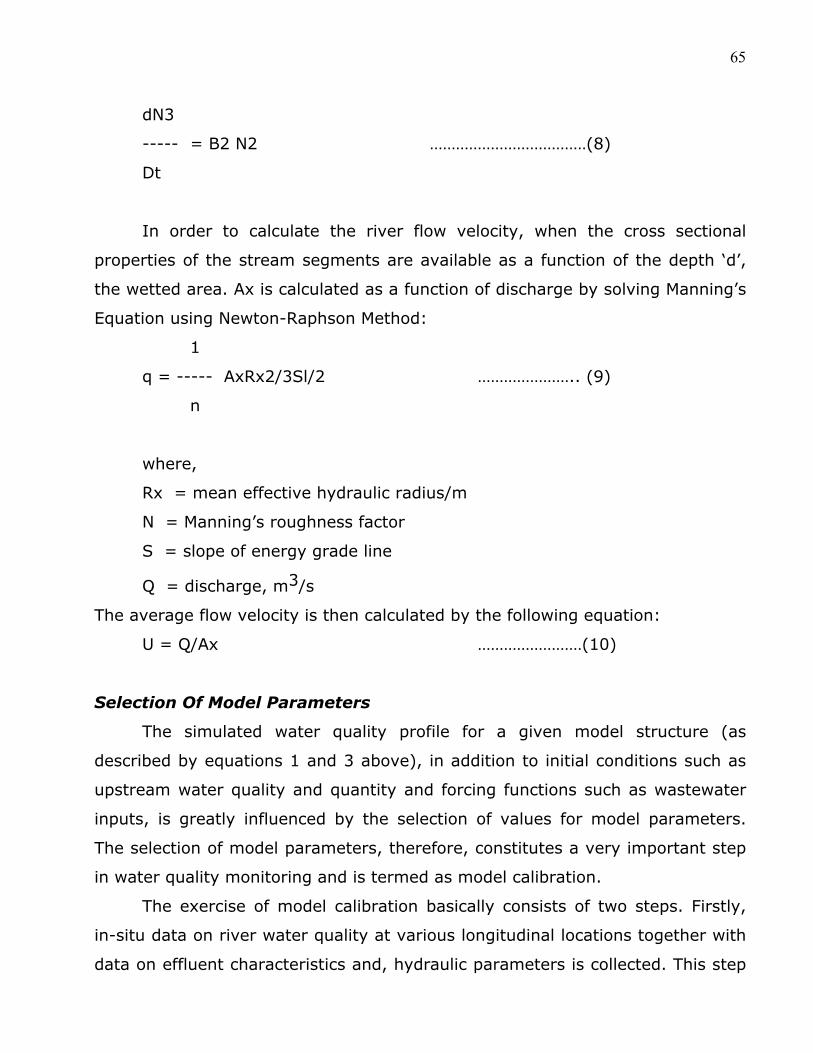
dN3
----- = B2 N2 ………………………………(8)
Dt
In order to calculate the river flow velocity, when the cross sectional
properties of the stream segments are available as a function of the depth ‘d’,
the wetted area. Ax is calculated as a function of discharge by solving Manning’s
Equation using Newton-Raphson Method:
1
q = ----- AxRx2/3Sl/2 ………………….. (9)
n
where,
Rx = mean effective hydraulic radius/m
N = Manning’s roughness factor
S = slope of energy grade line
Q = discharge, m3/s
The average flow velocity is then calculated by the following equation:
U = Q/Ax ……………………(10)
Selection Of Model Parameters
The simulated water quality profile for a given model structure (as
described by equations 1 and 3 above), in addition to initial conditions such as
upstream water quality and quantity and forcing functions such as wastewater
inputs, is greatly influenced by the selection of values for model parameters.
The selection of model parameters, therefore, constitutes a very important step
in water quality monitoring and is termed as model calibration.
The exercise of model calibration basically consists of two steps. Firstly,
in-situ data on river water quality at various longitudinal locations together with
data on effluent characteristics and, hydraulic parameters is collected. This step
66
is followed by an exercise of matching the predicted water quality to the
observed one by adjusting the value of model parameters. Those values of
model parameters which provide a good match with the observed values are
chosen for prediction of water quality under different scenarios.
Such procedure for model calibration, however, could not be followed
since there is no wastewater discharge from the proposed cement plant so as to
provide water quality observations for model calibration. It was necessary to
take recourse to alternate methods to assign appropriate values to model
parameters.
As stated earlier the water quality predictions by means of modeling
exercise can be undertaken for the worst case characterized by upset conditions
of biological treatment plant. Under such conditions the effluents are expected
to contain significant concentrations of moderately biodegradable waste matter.
BOD decay coefficient in the river basin can be taken as 0.5/day which
represents a middle value on low side of the range reported for the coefficient in
the literature.
The value of re-aeration coefficient is calculated based on the expression
provided by Dobbins and Oconner which is suitable for the hydraulic
characteristics of river during the low flow conditions.
As regard to the selection of model parameters for simulation of nitrogen
species, it is observed from literature that rate coefficients for organic nitrogen
hydrolysis, ammonia oxidation and nitrate oxidation vary from 0.1 to 0.4(day-1),
0.1 to 0.4 (day-1) and 2.0 to 5.0 (day-1) respectively. Due to the want of data to
estimate these parameters for river, middle values of the respective ranges can
be taken for model predictions.
4.1.5. LAND ENVIRONMENT
Soil Characteristics
It is clear from the Table 3.2.4.1 that the soil at the proposed cement
plant will require special management considerations with reference to neutral
pH and leaching predominating clay nature. Acidic soils have higher solubility of
67
salts as a function of pH and leaching processes are prevalent. Due to
characteristic climatic conditions (deciduous evergreen forest) and typical
ecosystem of the area, recycling of organic nutrients is very fast. A slight
disturbance in the natural processes which is quite evident in the area where
land has been used for other purposes (other than natural vegetation, forest
etc.) such as industrialisation and other human activities.
Solid Waste
During rainy season, surface run-off will also carry the hazardous
materials and may spoil the ecology of the surrounding environment.
The acidic nature and low cation exchange capacity (CEC) of soils further
enhance the possibility of leaching toxic metals and other injurious constituents.
4.1.6. BIOLOGICAL ENVIRONMENT
Terrestrial Biology
Green Belt Development
In order to predict the impact on air environment and to device mitigation
strategy for further emissions, noise besides reusing the treated solid wastes,
green belt design approach through modeling was adopted. Estimation of
optimal width of green belt in and around the proposed plant is based on
pollution attenuation coefficient of selected plant species of deciduous forest as
reported in literature.
The model used for the estimation of pollution attenuation factor of green
belt around the proposed cement plant pollution source has been developed
using a combination of an exponential law for dry removal of pollution while
traveling on natural surface and plant canopy of green belt. The pollution
attenuation factor (AF) is given by the equation:
FD (X1 +X2)
AF = ----------------------------------------------------
He he
FD(X1) er F ------ e - X2 + erFc ------F’D(X2)
2 2 (X1) 2 2 (X1)
68
where,
X2 = width of green belt (m)
He = effective height of green belt (m)
= pollution attenuation co-efficient (m-1)
X1 = separation distance between the green belt and pollution
source (m)
FD(X1 +X2) and FD(X1) are the plume depletion factors due to dry
deposition of pollutant on natural surface for downwind distances (X1 +X2) and
X1 respectively.
FD(X2) is the plume depletion factor for distance (X2) above green belt and
is obtained as follows:
FD (X1 +X2)
FD(X2) = ------------------ ………………….(2)
FD(X1)
The plume depletion factor FD(X) for any distance X has been calculated
using:
FD (X) = exp 1/Z exp ─ H2 /2Z2 δz ─ (2/) ½ Vd/U
where,
H = release height (m)
δz = standard deviation of concentration distribution in
vertical (m) direction for downstream distance X
Vdp = Dry deposition velocity (m/s)
U = Mean Wind Speed (m/s)
The concept of effective height ‘he’ (which is less than the physical height
of the green belt) is introduced to account for reduced wind speed in the green
belt region. The value of ‘he’ has been computed from me following relationship:
Uz δz = hUc
Where,
69
Uz = is the wind speed profile outside the green belt
Uc = is the average wind speed inside the green belt. The pollution
attenuation coefficient of (m-1) of the green belt is given by:
K t Vd/Uc
where,
t = foliage surface area density of single tree (w2m
3)
c
K = ----
T
c= average foliage surface area density of the green belt(m2m-3)
Vdg = dry deposition velocity of the pollutant (ms-1) for the
vegetative canopy
The main gaseous pollutants expected from cement plant are sulphur di-
oxide (S02), CO and particulate matters as this will be generated during the
process of manufacturing of cement. Dry deposition velocities on natural surface
(Vdp) and on vegetation (Vdg), wind speed outside the green belt (Uz) and wind
speed inside green belt (Uc) used for calculation of optimum thickness of green
belt for S02 and hydrocarbons. Variation of attenuation factor (AF) with respect
to distance of green belt from the source (X1) has been depicted for 5, 10, 15
and 20m tree heights. It is clear that attenuation is far greater if the plantation
is near to the source, while after 500m as one moves away from the source,
attenuation remain more or less constant irrespective of height of trees. It is
obviously seen that the attenuation factor increases with the width of green
belt(X2) (i.e. optimum width) as well as with height of trees up to a certain
extent and there after remains same irrespective of the width. It is calculated
that plants of 5, 10, 15 and 20m heights can reduce the pollution impact by 31,
50, 60 and 70% respectively; while in absence of green belt the surrounding
zone will be exposed to the fugitive pollutants that will be emitted from the
cement plant (Table 4.1.6.1 and Figure 4.1.6.1).
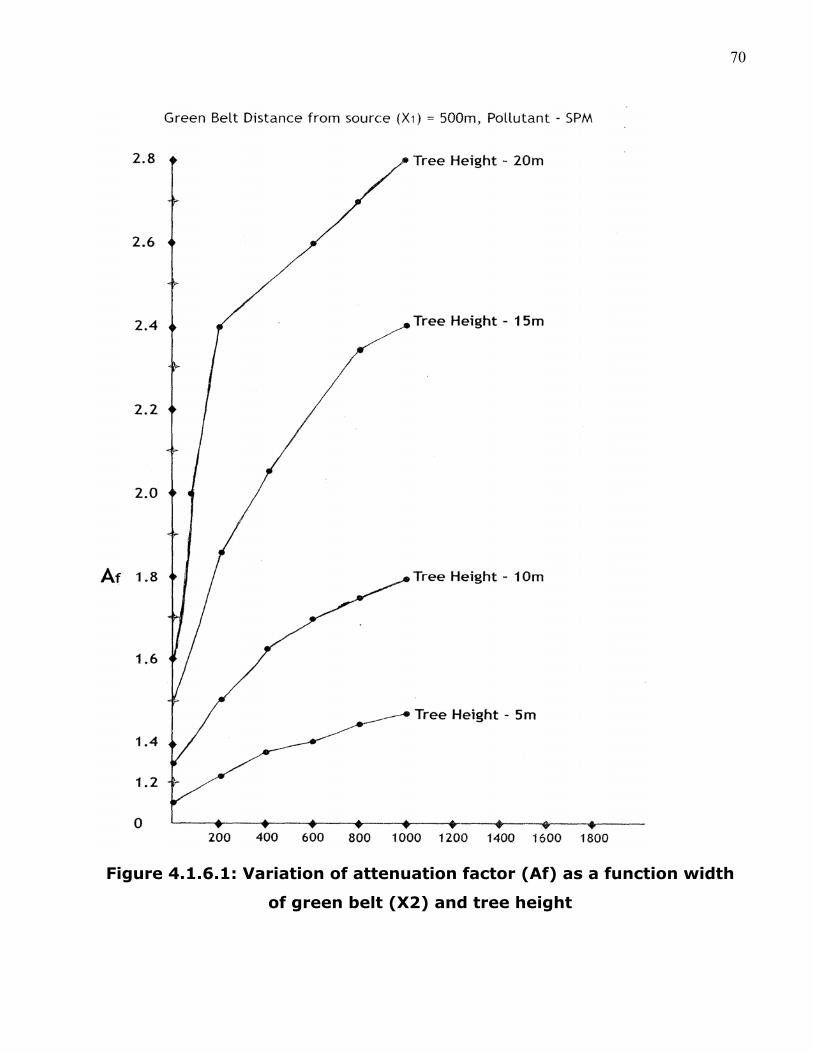
70
Figure 4.1.6.1: Variation of attenuation factor (Af) as a function width
of green belt (X2) and tree height
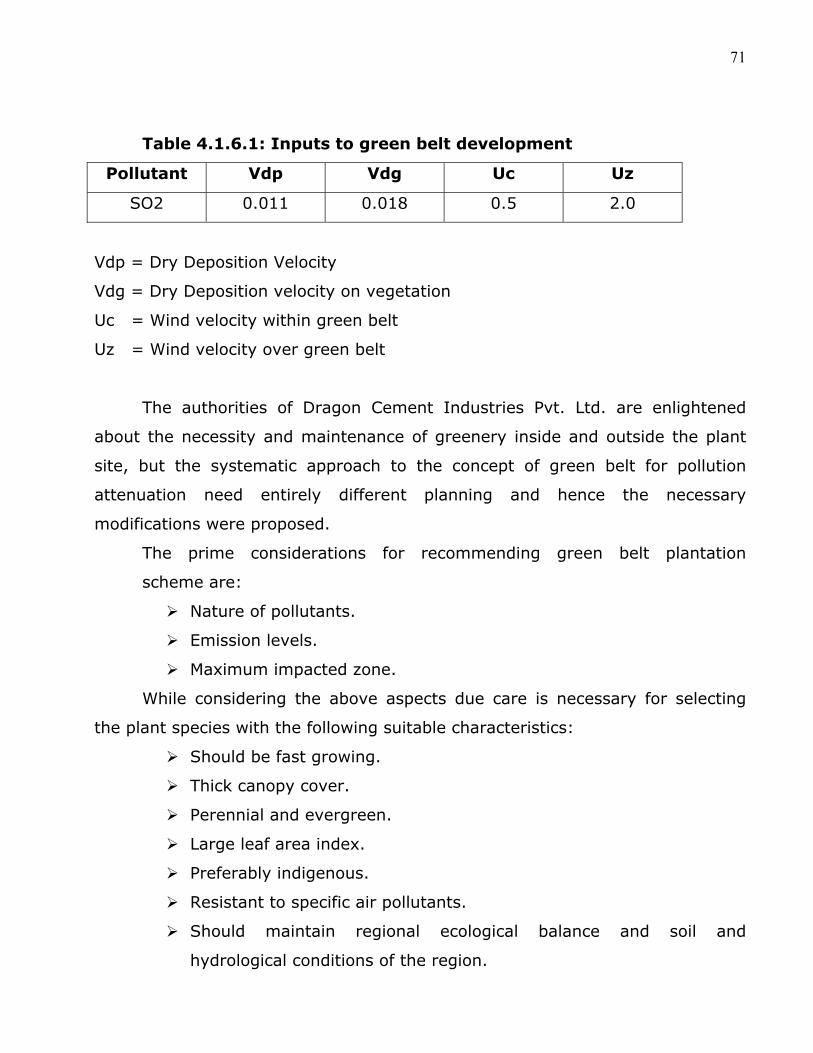
71
Table 4.1.6.1: Inputs to green belt development
Pollutant Vdp Vdg Uc Uz
SO2 0.011 0.018 0.5 2.0
Vdp = Dry Deposition Velocity
Vdg = Dry Deposition velocity on vegetation
Uc = Wind velocity within green belt
Uz = Wind velocity over green belt
The authorities of Dragon Cement Industries Pvt. Ltd. are enlightened
about the necessity and maintenance of greenery inside and outside the plant
site, but the systematic approach to the concept of green belt for pollution
attenuation need entirely different planning and hence the necessary
modifications were proposed.
The prime considerations for recommending green belt plantation
scheme are:
Nature of pollutants.
Emission levels.
Maximum impacted zone.
While considering the above aspects due care is necessary for selecting
the plant species with the following suitable characteristics:
Should be fast growing.
Thick canopy cover.
Perennial and evergreen.
Large leaf area index.
Preferably indigenous.
Resistant to specific air pollutants.
Should maintain regional ecological balance and soil and
hydrological conditions of the region.
72
Aquatic Biology
Since there will be almost negligible amount of treated effluent from the
proposed cement plant therefore there will be no impact on river water within
the impact zone.
General Guidelines
Trees growing up to 10 meters or more in height should be planted
around the plant installation.
Planting of trees should be undertaken in appropriate encircling rows
around the installation in alternating rows to prevent horizontal
pollution dispersion.
Trees should be planted along road sides, to arrest auto exhaust and
noise pollution, and in such a way that there is no direct line of sight
to the installation when viewed from a point outside the foliage
parameter.
Since tree trunks are normally devoid of foliage (up to 3 m). It
would be appropriate to have shrubbery in front of such trees to
give coverage to this portion.
The open areas within the campus should be covered with lawn
grass for effective trapping and absorption of air pollutants.
Fast growing trees with thick perennial foliage should be grown as it
will take many years for trees to grow to their full height.
4.1.7. SOCIO-ECONOMIC ENVIRONMENT
Setting up of the cement plant in the area would bring forth certain
impacts altering the pristine socio-economic environment. Some of these
impacts would be of direct consequence to the environment whereas the others
would be of secondary or of ripple nature. Positive impacts can be enumerated
as:
Employment opportunities to the local people would increase
considerably due to the construction and operation of the plant.
73
Increased facilities in the field of medicine, water supply, housing,
sanitation etc. would definitely crop up.
The cement plant will fill the gap of supply. This will augment the
process of industrial development of the area as well as it carries
higher revenue for the concerned Government authorities.
Negative impacts can be enumerated as:
Influx of workers during construction and manufacturing phase
would put strain on the existing basic amenities in the area.
The area is endowed with scenic beauty and green foliage and
forests. Setting up the cement may disturb the scenic beauty.
Based on our findings, it is anticipated that the positive impacts would
outweigh the negative ones and thus a net positive impact on socio-economic
environment is visualized. Table 4.1.7.1 consists of parameters for prediction of
impact on socio-economic environment.
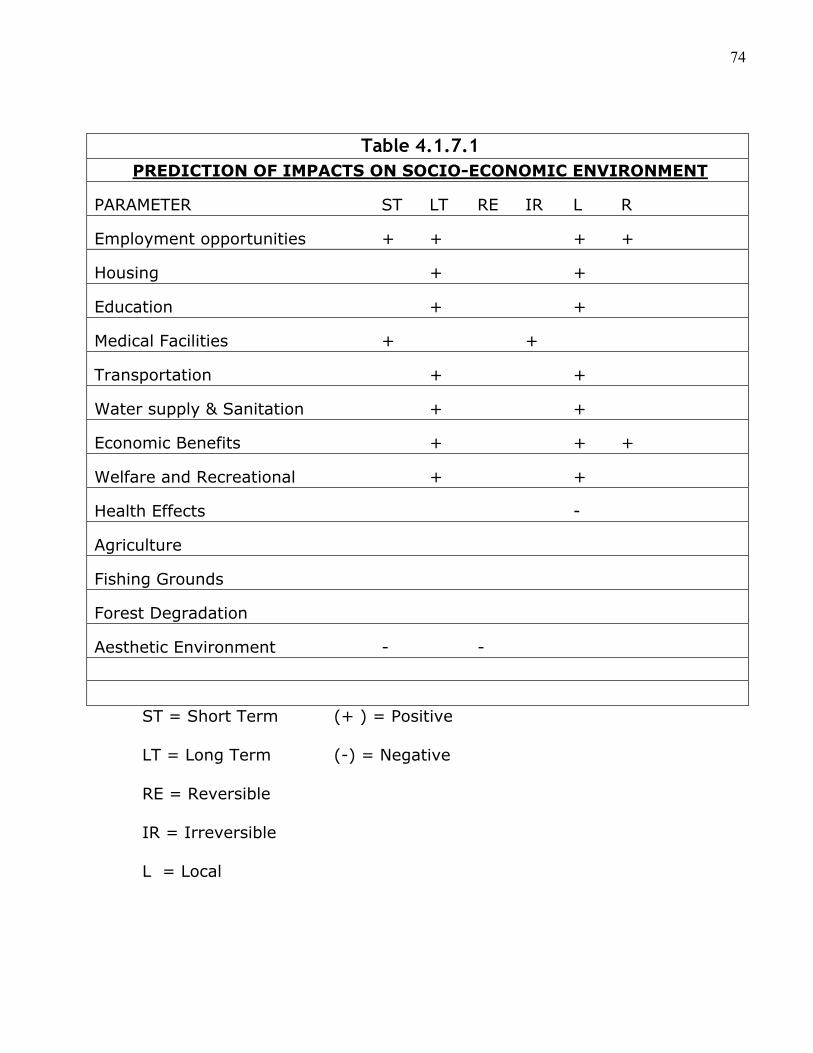
74
Table 4.1.7.1 PREDICTION OF IMPACTS ON SOCIO-ECONOMIC ENVIRONMENT
PARAMETER ST LT RE IR L R
Employment opportunities + + + +
Housing + +
Education + +
Medical Facilities + +
Transportation + +
Water supply & Sanitation + +
Economic Benefits + + +
Welfare and Recreational + +
Health Effects -
Agriculture
Fishing Grounds
Forest Degradation
Aesthetic Environment - - ST = Short Term (+ ) = Positive LT = Long Term (-) = Negative RE = Reversible IR = Irreversible L = Local
75
4.2. EVALUATION OF IMPACT
A mathematical/ statistical environmental model for evaluation of the
impact to be generated from the proposed cement plant was generated and its
impact was observed as enumerated.
BATTELIE ENVIRONMENTAL EVALUATION SYSTEM
Environmental quality assessment can be undertaken by evaluating
various environmental parameters. These parameters represent the various
component of environment viz, biological environment, environmental pollution
incorporating water, air, land and noise pollution, aesthetics and human
interests. Functional relationships have to be developed for each parameter
relating it with environmental quality.
A weighing scaling checklist has to be used for assigning important weight
for each parameter by an inter-disciplinary team of experts drawn from different
fields. Ranked pair wise comparison technique also has to be used to arrive at
the parameter importance units (PIU).
Impact evaluation has to be accomplished through the use of functional
relationship according to Batteile Environmental Evaluation System (BEES).
Functional relationships also called value function curves, refer to graphical
means of transforming environmental data (baseline and predicted) into
subjective evaluation. Objective measurements are to be presented into a
subjective interpretation of Environment Quality (EQ) on a scale of 0 to 1 where
1 stands for excellent environmental quality and 0 for poor quality.
An index is calculated in terms of Environmental Impact Units (EIU) for
each parameter and for different environmental conditions.
EIU = (EQ) ij (PIU)I
where,
EIU = environmental impact units for ‘j’th alternative
EQ = environmental quality scale for ‘i’th factor and ‘j’th
Alternative
PIU = parameter importance units for ‘i’th factor
76
The environmental parameters for the said coke industry have been
identified and distributed in four categories presented in Fig IV-1. The changes
in HU have been calculated for pristine environment and existing environmental
status with implementation of EMP.
Biological Environment
Impacts on parameters of this component have been studied and it is
evident that some negative impacts are possible, however it is not significant
enough to disturb the ecological balance of this area.
Environmental Pollution
At present water pollution in the area is non-existing. After commissioning
of the cement plant, there will be marginal impact on the environment. After the
implementation of the EMP, the final impact shall not be significant. Water
environment improvements are expected under normal conditions.
Since assimilative capacity of the water bodies and the rivers nearby are
very good there are little chances of any adverse impact on water quality due to
this cement industry. Fisheries and aquatic flora and fauna shall also not be
impacted.
Deterioration in air quality improvement is foreseeable from the present
status of clean atmosphere but the impact shall be confined within short
distances. However, for the improvement in the conditions after measures are
suggested in EMP. These measures are adopted so that the pristine environment
is not affected. Impact shall be kept minimum on land environment.
Noise pollution will have some negative impact because of the unavoidable
noise sources within the plant. However, there is contribution of noise from the
surrounding road and habitation also. Mitigation measures as control at the
source as well as control through green belt (inside and out-side) shall keep the
impact marginal.
77
Aesthetics
Appearance of water body will be preserved after adopting EMP. Natural
vegetation and its diversity will be maintained for green belt development.
Human Interest
Major contribution is expected towards casual labours employment which
will improve after the setting up of the cement plant. The economy output due
to the cement industry is positive besides enhancement of community services.
Overall Impact
Impact on the total project area would be marginal in certain sectors viz,
biological environment, water, air, land and noise environment and aesthetics
and gross improvement in other aspects of human interest. Large beneficial
impacts are due to cement welfare activities and adoption of EMP.
The impact statement focuses on the study area of 5 km radius around
the site. The four basic environmental components likely to get affected are:
Air Environment
Water environment
Land environment
Socio-economic environment
For all the environmental parameters impact identification, measurement,
prediction of data and finally evaluation has been done to arrive at the complete
scenario of adverse or beneficial impacts. Moreover, the presence of many
industries within the study zone adds to the problem of impact of pollution on
the environment. Most of the industries are without any pollution control
measures. Therefore, it has not been an easy task to calculate the actual impact
on the environment of the area. So, we can say that the impact of any single
cement plant will be negligible but altogether the cluster of industries might
contribute to pollution in the zone.
78
4.3.1. Air Environment
The existent ambient air quality in the Doboka area as affected by the
overall pollution caused by the fumes from vehicles running through the NH-54
and the machineries involved in the construction of the roads. This will change
once the EMP measures are adopted. EMP measures have been proposed to
mitigate long term as well as short term impact so that general air pollution is
brought down. Since there are other major industrial units around the project
site, the air pollution scenario will be definitely affected and therefore,
improvement in the air quality is a must.
Human settlement and forest vegetation will not be affected to any
significant extent due to the proposed cement plant. Since an appreciable
improvement in air environment is expected after implementation of EMP. SOx
and NOx will be mitigated by development of green belt thus avoiding any
complaints from human settlement areas.
4.3.2. Noise Environment
Noise environment due to the proposed cement plant will be significant for
the workers working in the manufacturing sector and therefore, mitigation
measures suggested for the workers protection should be adopted.
Noise levels in nearby villages and settlements near highways are in
general high because of heavy traffic on major highway and noise generated
from social/religious functions and therefore, do not need any special
attenuation.
4.3.3. Water Environment
Surface Water
Surface water quality will not be affected as there will be no discharge of
wastewater from the proposed cement plant into the nearby river. The slightest
amount of wastewater if disposed off will be treated to meet MINAS limits.
79
Ground Water
Whole study area has high water table due to adequate rains and low rate
of ground water withdrawal. Water quality of village well/ponds will not be
affected by effluent of the proposed cement plant. Minor treatment with pot
chlorinator and maintenance of hygienic condition around wells can improve the
general ground water quality. Ground water, however, can be used for irrigation
without any adverse affects on land.
4.3.4. Land Environment
Mitigation measures suggested in EMP will minimize any impact on land.
Primarily as there will be no discharge of any sludge from the proposed cement
plant, therefore the question of recycling and re-use of major portion of sludges
does not arise at all.
4.3.5. Socio-Economic Environment
The impacts on the socio-economic status of the project area are both
positive and negative. However, no drastic changes are expected. Overall health
improvement and better sense of well-being will be generated after following the
measures as envisaged in EMP.
80
5. ENVIRONMENTAL MONITORING
5.1. POST-PROJECT OPERATION
5.1.1. Air Environment
Ambient air quality monitoring at different averaging time depict that
occasional peak of SO2 and SPM concentrations for short term period within 1-5
km can occur during emergency release depending upon wind direction/ speed.
Exposure of sensitive receptors located well within the study zone of 5 km shall
be within acceptable level for long term as well as short term emergency
releases. Further short term (8 hr average) as well as long term
(seasonal/annual averages) concentrations will remain well within the
permissible levels of CPCB (120 ug/m3 : 8 hr average : 90 percentile and 80
ug/m3 : annual average) even leaving ample scope for overall development of
the region. But the following mitigation plan shall help further in maintaining
ecological balance in the region.
Stack emissision monitoring will be done at fixed interval of time.
The weight scrubbing will further reduce the pollution of the pollutants far
below the prescribed limits.
Pollution Control Measures
Dust, NOx, SO2 and VOC emissions are subject to continuous monitoring
standard as per the recommendation. Heat recovered from the kiln and clinker
cooler is recycled for preheating the raw meal, reducing thermal energy
consumption. Unburnt volatile matters contribute to emission of pollutant
through the stack particularly to the emission of suspended particulate
matter(SPM).
The wet scrubbing will further reduce the emission of the pollutants far
below the prescribed limit without sacrificing the chimney draught for which
proper chimney height has to be made. The water spray also dissolves some
SOx carried over by the flue to the chimney. The crusher machine has to be
81
operated in a close compartment to avoid dust and noise pollution. Moreover,
there have to be green plantation of at least 5 m width through out the
boundary wall of the cement plant.
The following standards for emission are based on those notified by the
Government of India under the Environment Protection Act, 1986 and modified
from time to time. The standards are fixed as follows: -
(i) New Unit Particulate matter 150mg/m3
(Corrected to 6% C02)
SOx: Below acceptable limit When “Sulphur” in
coal is less than 1%. However, generation of SOx
is sensitive to sulphur content of the coal charged.
NOx: Below acceptable limit.
Note: A minimum stack height of 120 m shall be provided.
(ii) Emissions from cement plant shall be channelised through a vent and
finally emitted through a stack. Damper adjustment techniques shall be
used to have optimum heat utilization and also to control the emission of
unburnt carbon particles and combustible flue gases.
(iii) Wet scrubbing system or waste heat utilization for power generation or
by-product recovery systems should be installed preferably to achieve the
prescribed standards.
It is apparent from the baseline study that the status of noise pollution at
all the community locations including sensitive zones viz, residential areas,
schools, hospitals etc. are within the permissible exposure limit (IS-4954).
Average rise in community noise level due to the various processes in the
cement plant is likely to be less than 32 dB(A). This is within the prescribed limit
of acceptable noise level. The levels will further be attenuated by more than
50% with the implementation of green belt as recommended.
The inplant workers particularly those working near higher noise sources
may be exposed to noise level higher than the 90 dBA. In the cement plant such
exposures should be restricted to a shorter duration as high tech noise pollution
82
control equipments are to be installed in the proposed plant wherein the noise
levels shall be well below the Occupational Exposure Limit(OSHA) of 90 dB(A)
for 8 hr shift and 6 days working.
Further the provisions of ear plugs or ear muffs should be made for the
inplant workers having duties at such places to avoid exposure to high levels
whenever they come near to high noise generating operation. But this is only a
temporary measure, as many a time/ workers do not continuously use these
equipments due to personal discomfort etc. Noise levels at other locations within
the study zone of 5 kms in general are not likely to exceed 65 dB(A).
Green belt designed for the proposed cement plant for control of air
pollution of fugitive nature shall also be adequate to attenuate the noise
pollution because the maximum noise of 60-65 dB(A) calculated at the project
site without any major existing green belt, shall further attenuate by minimum
of 50%.
5.1.3. Water Environment
It is found that no industrial effluent will be discharged from the cement
plant. However, there is every possibility of surface run-off caused by
precipitation. Proper maintenance schedule are needed to be planned and
implemented.
Proper drainage system should be made and all the sanitary waste are to
be diverted into a septic tank followed by soak pit.
Trained personal should be responsible for upgrading all the modern day
electronic gadgets to check the water pollution at all levels.
5.1.4. Land Environment
As described in previous chapters there will be no solid and hazardous
disposal from the proposed cement plant. However, there are chances of surface
run-off caused by precipitation which may at times carry suspended solids and
also dissolved solids. This may cause soil pollution. To mitigate this proper
drainage and sanitation system should be made all along the boundary.
83
5.1.5. Biological Environment
The green belt development around the project site should be designed
taking into consideration the local indigenous plant species. Efficiency of green
belt in pollution abatement depends mainly on the width of green belt distance
from the source and tree height. Green belt development is primarily effective
for fugitive emissions. The pollutants mainly identified for cement industries are
SPM, SOx, NOx, dust etc. which are mitigated through optimal size of green belt
in 500m. From noise pollution point of view much smaller width shall suffice.
Also the units which are potentially capable of generating emission should be
identified and adequate space for growing plant in three to four rows should be
reserved. The plantation should be done on the both sides of the plant site
boundary as also along the low lying open fields around the plant site if possible.
Social Forestry and community plantation program is recommended. List of
species selected for planting green belt is enclosed in Table
Though the prevailing wind direction is in the South-East, it should be
desirable to have green belt all around the boundary of the cement plant. So far
as the site premises is concerned, it is suggested that plantation in double rows
can be done all along the open fields on both sides of the site and approach road
as well as within the campus. Lawns and shrubs can be grown on the space
available to arrest fugitive emissions. The inplant site where it would be
necessary to arrest fugitive emissions:
(i) All along the boundary wall.
(ii) Around the low lying areas.
Around the project site plants in more than two rows should be planted.
All around the inside of boundary wall tall trees with height more than 10m
should be planted to maintain the ecological balance of the area as a whole.
84
5.1.6. Socio-economic Environment
It is revealed from the studies that the following socio-economic factors
need to be considered while implementing EMP.
Welfare activities like provision of medical facilities, development of sports
etc. which are rather poor in the area should be taken up as a measure of
goodwill;
To intensify the Social Forestry Program;
To properly manage the natural ecosystem at all possible levels;
To monitor the pollution levels by sensitive plant species;
To monitor the status of vegetation with the help of density and
percentage vegetation cover, diversity indices and IVI values;

85
6. ENVIRONMENTAL MANAGEMENT PLAN
6.1. Air pollution sources and control measures
In the proposed cement plant suitable pollution control equipments shall
be selected which will ensure that the emission levels are maintained below the
prescribed unit. All pollution control equipment in the proposed cement plant is
designed for an outlet emission of less than 50 mg/m3 of suspended particulate
matter.
Hammer mill
420 cfm (714 m3/hr) (3 HP)
Cyclone separator with multicyclone collector or pulse jet bag filter system.
Raw mill
1280 cfm (2175 m3/hr) (5HP)
Reverse pulse jet bag filter system
Cement mill
1280 cfm (2175 m3/hr) (5HP)
Reverse pulse jet bag filter system
Kiln
820 cfm (1393 m3/hr) (7.5 HP) output 1000mm diameter chimney
Impingement plate scrubber i.e. air jet wash system with 4000 cfm twin lobe
rotary compressor.
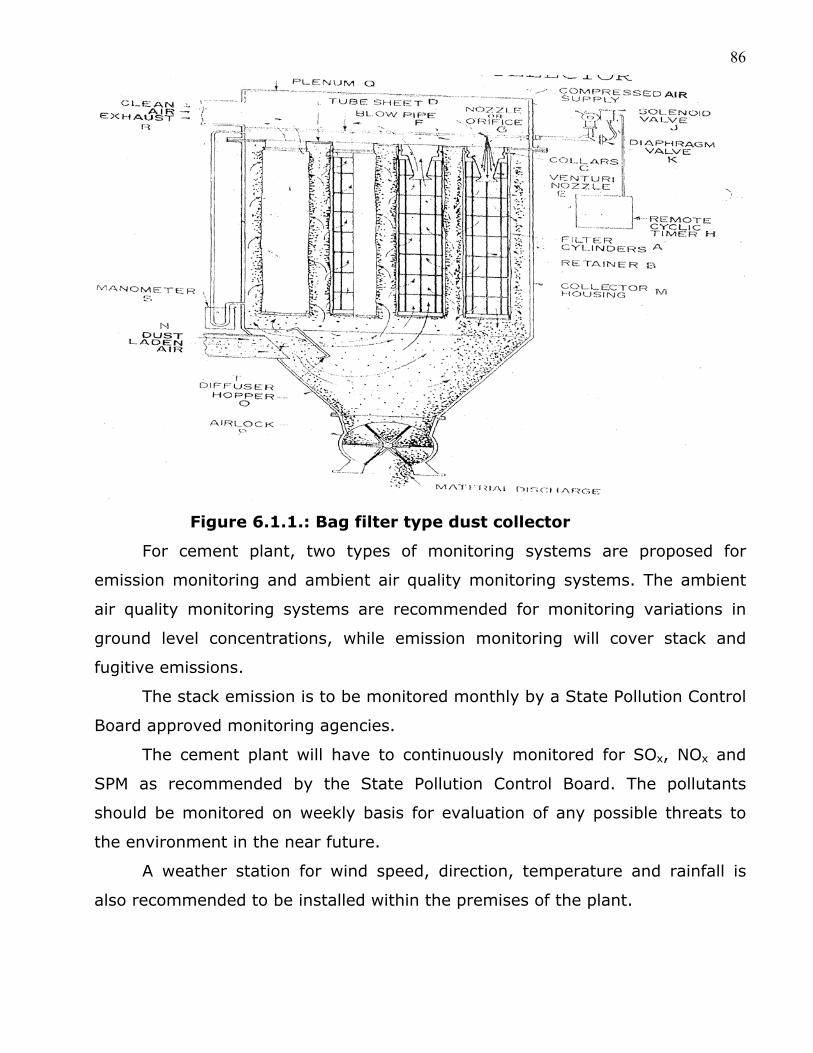
86
Figure 6.1.1.: Bag filter type dust collector
For cement plant, two types of monitoring systems are proposed for
emission monitoring and ambient air quality monitoring systems. The ambient
air quality monitoring systems are recommended for monitoring variations in
ground level concentrations, while emission monitoring will cover stack and
fugitive emissions.
The stack emission is to be monitored monthly by a State Pollution Control
Board approved monitoring agencies.
The cement plant will have to continuously monitored for SOx, NOx and
SPM as recommended by the State Pollution Control Board. The pollutants
should be monitored on weekly basis for evaluation of any possible threats to
the environment in the near future.
A weather station for wind speed, direction, temperature and rainfall is
also recommended to be installed within the premises of the plant.
87
6.2. Noise Environment
Monitoring of noise levels is essential to assess the efficiency of
maintenance schedules undertaken to reduce noise levels and noise protection
measures. A good quality sound pressure level meter is essential for this
purpose. Dragon Cement Pvt. Ltd. Is procuring Compressors and Generators
with acoustic enclosure.
6.3. Water Environment
There will be no waste water generated due to the process.The sanitary
waste is diverted into a septic tank followed by soak pit. Therefore, suggestions
regarding their disposal and treatment have not been covered in details. Here,
we can at least say that the pollution control measures regarding wastewater
discharge should be followed in accordance with the norms of the State Pollution
Control Board. Whatever wastewater is generated from the plant will be
recycled.
Rain water harvesting: Based on the available data on roof area one rain
harvesting pit have been envisaged, to ensure surging of ground water. Pits will
be made with gravel and sand filled in as filtering media.
6.4. Land Environment
At times suspended solids and also dissolved solids may contaminate the
soil. This may cause soil pollution. To mitigate this proper drainage system
should be made all along the boundary of the proposed cement plant in order to
discharge any kind of waste to the river outlet by all possible means. Soil
parameters like pH, conductivity, NPK ratio etc. Soil testing should be done on
case to case basis.
Solid waste generation is mainly from the pollution control equipments
which is negligible but periodically recycled after the containers placed beneath
the rotary valve of the respective dust collectors are adequately filled in.
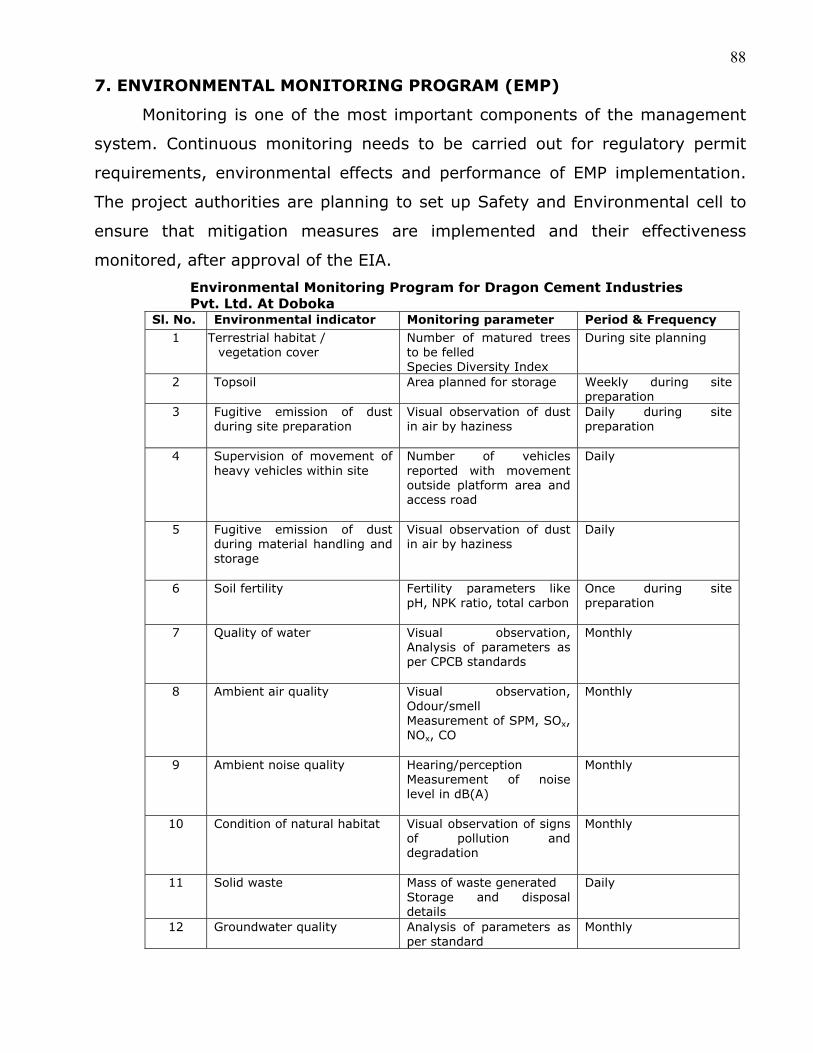
88
7. ENVIRONMENTAL MONITORING PROGRAM (EMP)
Monitoring is one of the most important components of the management
system. Continuous monitoring needs to be carried out for regulatory permit
requirements, environmental effects and performance of EMP implementation.
The project authorities are planning to set up Safety and Environmental cell to
ensure that mitigation measures are implemented and their effectiveness
monitored, after approval of the EIA.
Environmental Monitoring Program for Dragon Cement Industries Pvt. Ltd. At Doboka
Sl. No. Environmental indicator Monitoring parameter Period & Frequency
1 Terrestrial habitat / vegetation cover
Number of matured trees to be felled Species Diversity Index
During site planning
2 Topsoil Area planned for storage Weekly during site preparation
3 Fugitive emission of dust during site preparation
Visual observation of dust in air by haziness
Daily during site preparation
4 Supervision of movement of heavy vehicles within site
Number of vehicles reported with movement outside platform area and access road
Daily
5 Fugitive emission of dust during material handling and storage
Visual observation of dust in air by haziness
Daily
6 Soil fertility Fertility parameters like pH, NPK ratio, total carbon
Once during site preparation
7 Quality of water Visual observation, Analysis of parameters as per CPCB standards
Monthly
8 Ambient air quality Visual observation, Odour/smell Measurement of SPM, SOx, NOx, CO
Monthly
9 Ambient noise quality Hearing/perception Measurement of noise level in dB(A)
Monthly
10 Condition of natural habitat Visual observation of signs of pollution and degradation
Monthly
11 Solid waste Mass of waste generated Storage and disposal details
Daily
12 Groundwater quality Analysis of parameters as per standard
Monthly
89
8. SUMMARY AND CONCLUSION
Dragon cement Pvt. Ltd. is a firm believer in eco-friendly industrialization
which leads to the development of the area. It will follow the norms and
guidelines of State and Central Pollution Control Boards. They are also planning
to undertake many socio-economic development activities in the area to bring
about overall improvements in the area. Therefore, the project may be accorded
environmental clearance.


![INDEX [enviscecb.org]enviscecb.org/223/English.pdf · M/s. Shree Cement Ltd. 1 1.0 PROJECT DESCRIPTION 1.1 Introduction Shree Cement Limited (SCL) is the largest producer of cement](https://img.pdfslide.us/doc/110x75/5e781cc7ba951d34db1de7e9/index-ms-shree-cement-ltd-1-10-project-description-11-introduction-shree.jpg)


![INDEX [shodhganga.inflibnet.ac.in]shodhganga.inflibnet.ac.in/bitstream/10603/100406/6/06_chapter 1.p… · INDEX 1.1 INTRODUCTION ... 1.10.3 Binani Cement 1.10.4 Shree Digvijay Cement](https://img.pdfslide.us/doc/110x75/5eac6ed12f470f78de1b8f9b/index-1p-index-11-introduction-1103-binani-cement-1104-shree-digvijay.jpg)