Embed Size (px)
Citation preview
EE5712 Power System Reliability:: Introduction
Panida Jirutitijaroen
1EE5712 Power System Reliability 12/27/2010
Outline
• About this class
• Introduction to reliability
• Basic steps in system reliability analysis
• Introduction to power system reliability
• Power system reliability indexes and criterion
3EE5712 Power System Reliability 12/27/2010

ABOUT THIS CLASS
Overview
Assessment
Scope
Objective
4EE5712 Power System Reliability 12/27/2010
Scope
• Power System Reliability
– Electric power
– System
– Reliability
• Reliability theory applied to power systems
• Analytical and simulation tools to conduct reliability analysis
8EE5712 Power System Reliability 12/27/2010
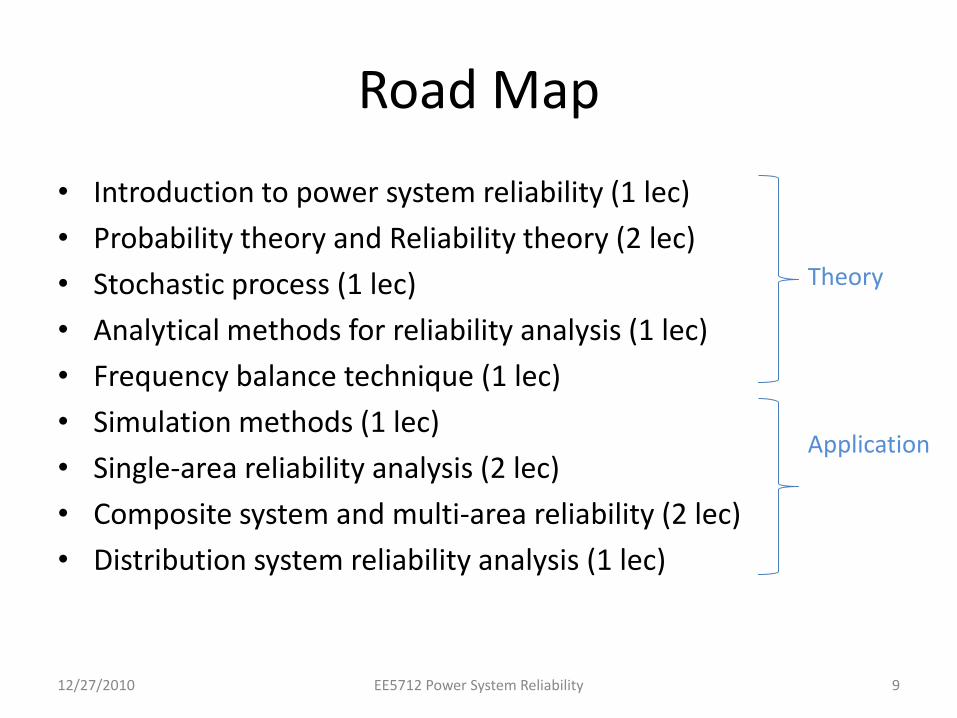
Road Map
• Introduction to power system reliability (1 lec)
• Probability theory and Reliability theory (2 lec)
• Stochastic process (1 lec)
• Analytical methods for reliability analysis (1 lec)
• Frequency balance technique (1 lec)
• Simulation methods (1 lec)
• Single-area reliability analysis (2 lec)
• Composite system and multi-area reliability (2 lec)
• Distribution system reliability analysis (1 lec)
Theory
Application
9EE5712 Power System Reliability 12/27/2010
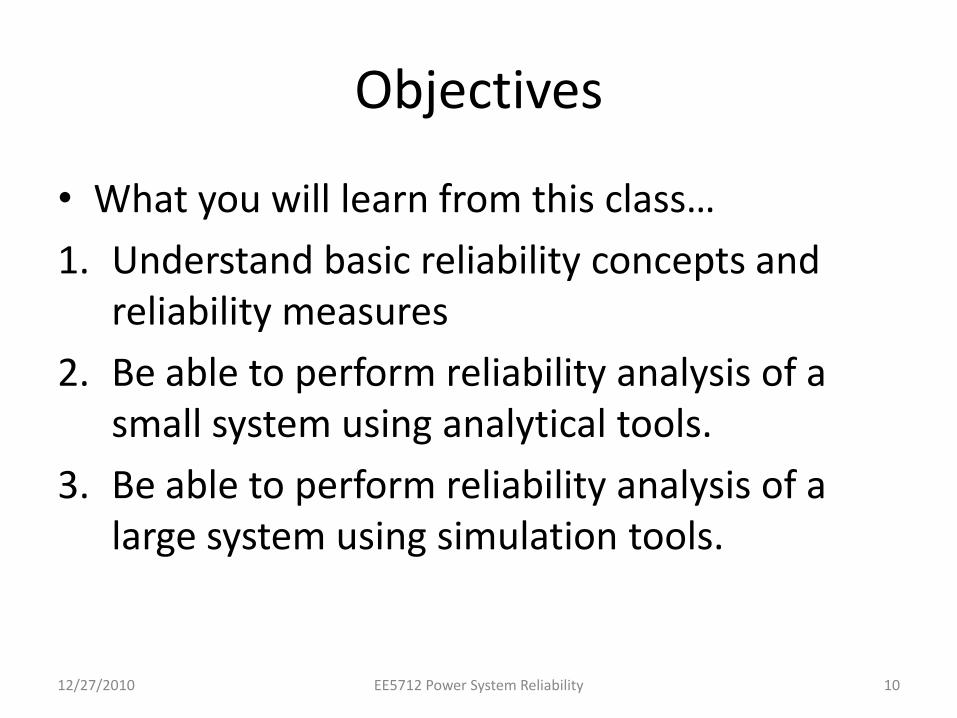
Objectives
• What you will learn from this class…
1. Understand basic reliability concepts and reliability measures
2. Be able to perform reliability analysis of a small system using analytical tools.
3. Be able to perform reliability analysis of a large system using simulation tools.
10EE5712 Power System Reliability 12/27/2010
INTRODUCTION TO RELIABILITY
What is reliability?
What causes a system to fail?
How to model uncertainties?
11EE5712 Power System Reliability 12/27/2010
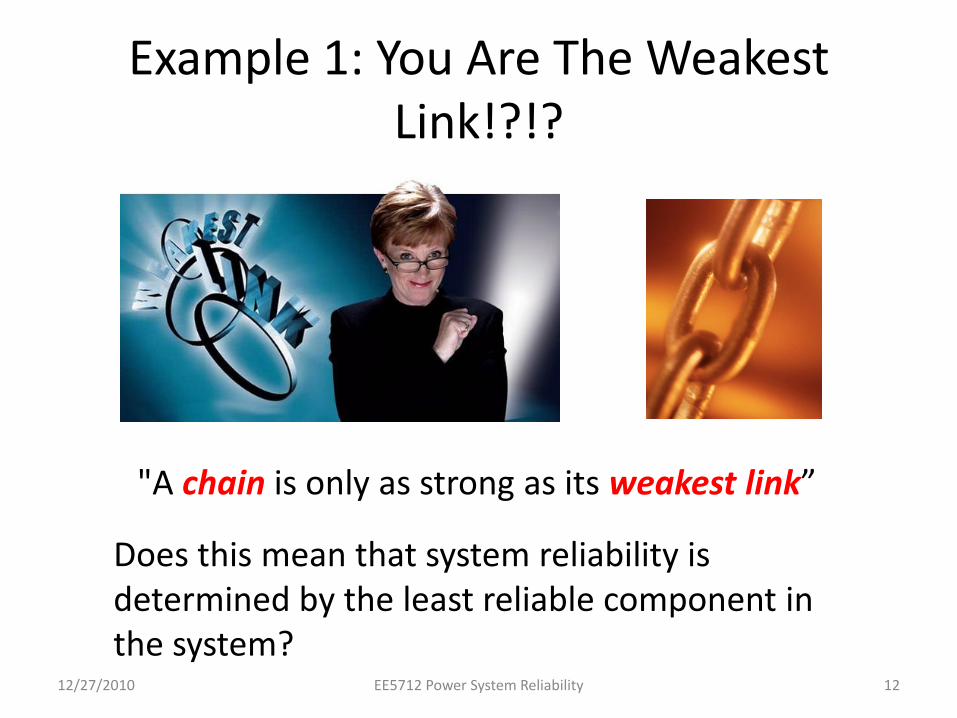
Example 1: You Are The Weakest Link!?!?
"A chain is only as strong as its weakest link”
Does this mean that system reliability is determined by the least reliable component in the system?
12EE5712 Power System Reliability 12/27/2010
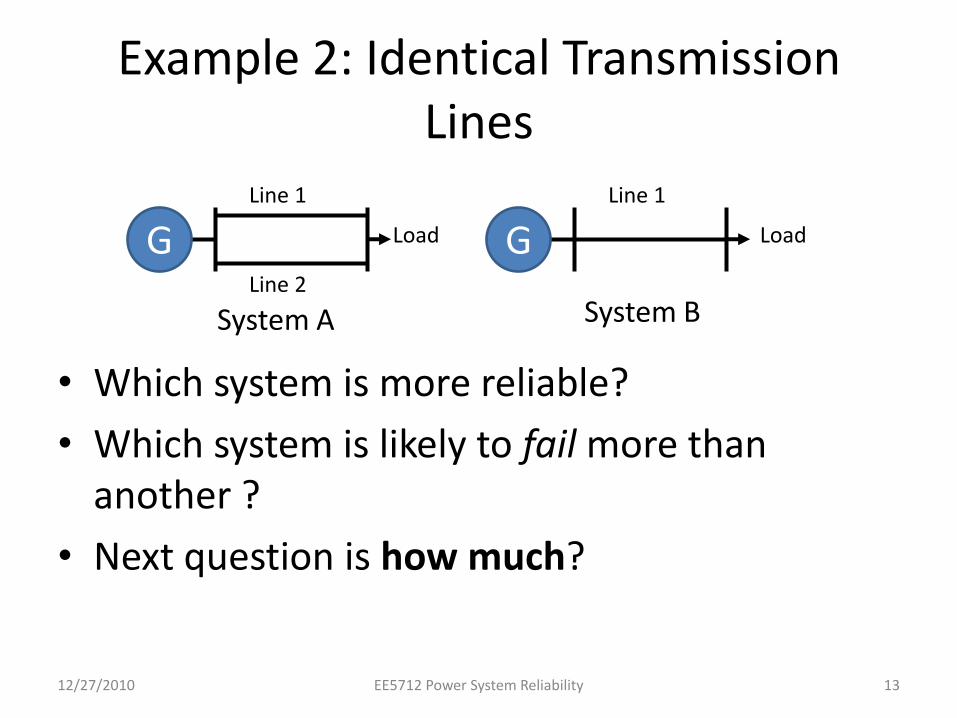
Example 2: Identical Transmission Lines
• Which system is more reliable?
• Which system is likely to fail more than another ?
• Next question is how much?
Line 1
Line 2
G Load
System A
Line 1
G Load
System B
13EE5712 Power System Reliability 12/27/2010
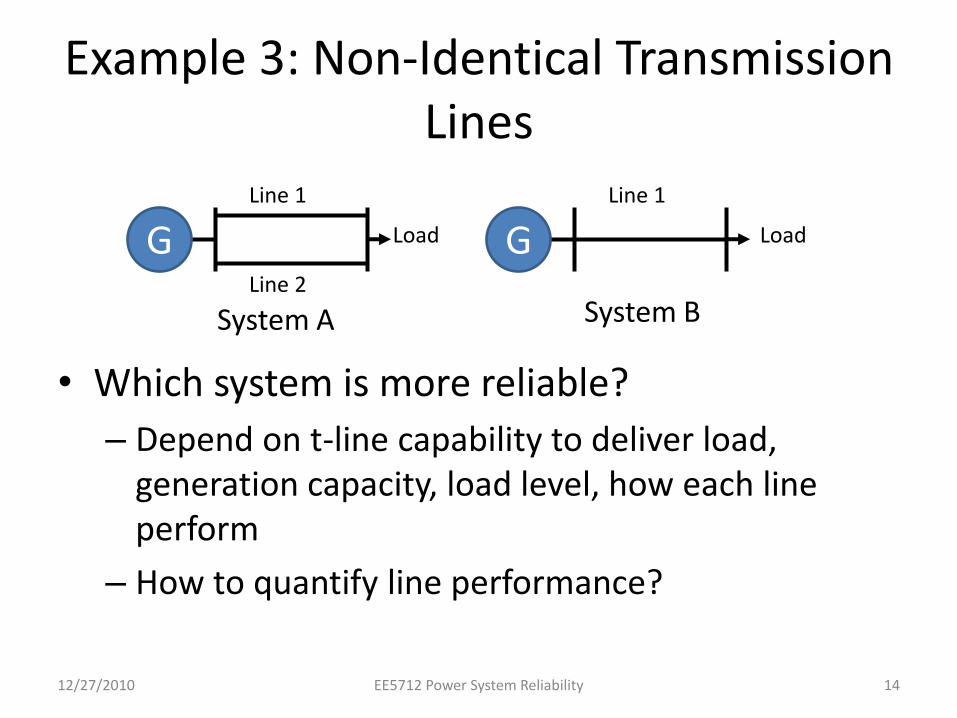
Example 3: Non-Identical Transmission Lines
• Which system is more reliable?
– Depend on t-line capability to deliver load, generation capacity, load level, how each line perform
– How to quantify line performance?
Line 1
Line 2
G Load
System A
Line 1
G Load
System B
14EE5712 Power System Reliability 12/27/2010
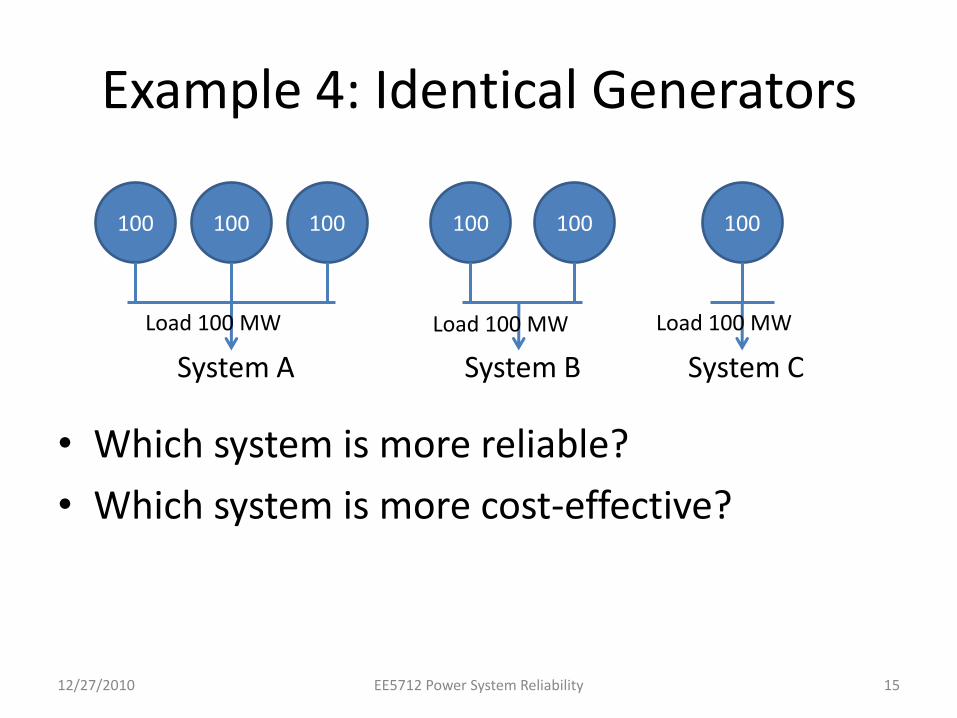
Example 4: Identical Generators
• Which system is more reliable?
• Which system is more cost-effective?
100 100 100
System A
Load 100 MW
100 100
System B
Load 100 MW
100
System C
Load 100 MW
15EE5712 Power System Reliability 12/27/2010
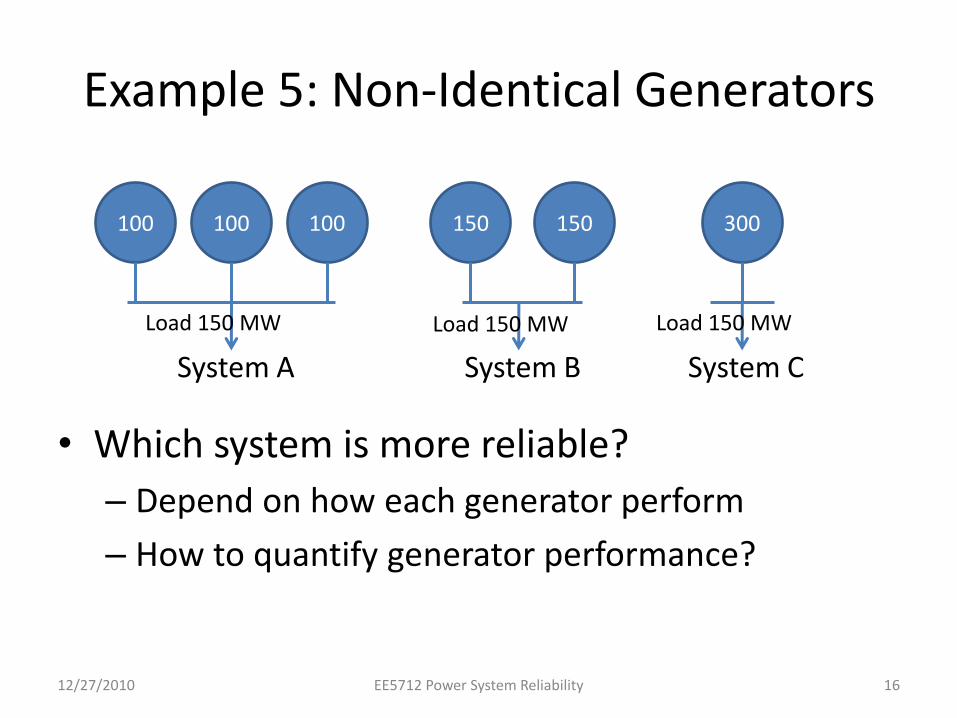
Example 5: Non-Identical Generators
• Which system is more reliable?
– Depend on how each generator perform
– How to quantify generator performance?
100 100 100
System A
Load 150 MW
150 150
System B
Load 150 MW
300
System C
Load 150 MW
16EE5712 Power System Reliability 12/27/2010
What Is Reliability?
• Ability of a component/system to perform its intended function
• Within a specified period of time
• Under stated condition
→ Qualitative sense in terms of performance function, time, and surrounding conditions
How to quantify ‘reliability’?
17EE5712 Power System Reliability 12/27/2010
Reliability
• Relate to the absence of failures, that due to random phenomenon
• Define numerically as ‘average’ or mean value
• Can be treated as a parameter
• Can be traded off with other parameters such as cost
18EE5712 Power System Reliability 12/27/2010
What causes a system to fail?
• Human factors
• System design
• Operation condition
• Maintenance procedure
• Deterioration (function of time)
• Random failures
• Uncertainties…
19EE5712 Power System Reliability 12/27/2010
How to model ‘Uncertainty’?
• Probability of failure– Chance that a component will fail
– Probabilistic value with no unit
– May be difficult to interpret
• Frequency of failure– In terms of number of failure within specified time
– Easier to predict from history
– Express in per hour, per day, per year
• We will discover later on in this course how to relate frequency of failure to probability of failure
20EE5712 Power System Reliability 12/27/2010
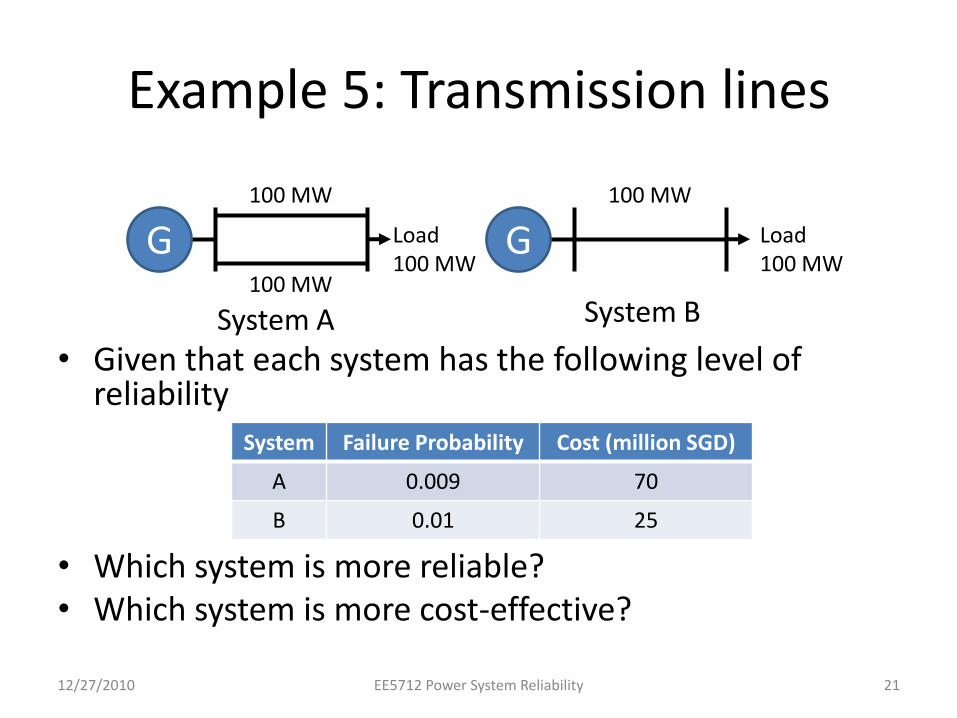
Example 5: Transmission lines
• Given that each system has the following level of reliability
• Which system is more reliable? • Which system is more cost-effective?
100 MW
100 MW
G Load100 MW
System A
100 MW
G Load 100 MW
System B
System Failure Probability Cost (million SGD)
A 0.009 70
B 0.01 25
21EE5712 Power System Reliability 12/27/2010
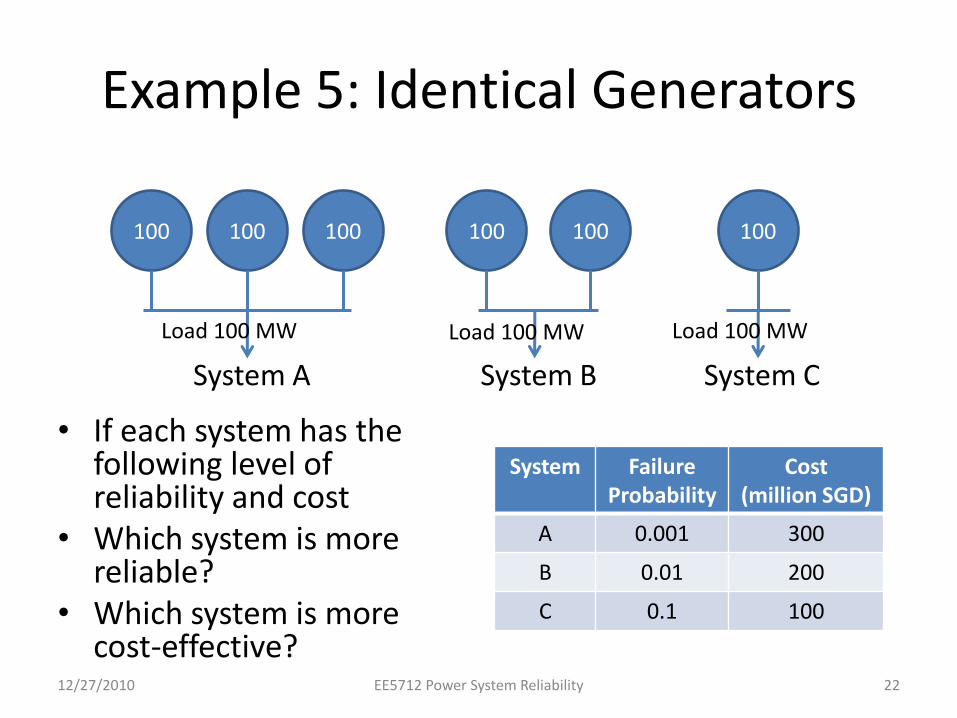
Example 5: Identical Generators
• If each system has the following level of reliability and cost
• Which system is more reliable?
• Which system is more cost-effective?
100 100 100
System A
Load 100 MW
100 100
System B
Load 100 MW
100
System C
Load 100 MW
System Failure Probability
Cost (million SGD)
A 0.001 300
B 0.01 200
C 0.1 100
22EE5712 Power System Reliability 12/27/2010
Motivations for Quantitative Reliability
• To evaluate system performance
• System design purpose
• Trade-off reliability with cost
• Increasing complexity of systems
• Competitiveness
• Establish standard in operation procedure
23EE5712 Power System Reliability 12/27/2010
BASIC STEPS IN SYSTEM RELIABILITY ANALYSIS
Objective of the analysis
Component modeling
System modeling
Performance function
Reliability Evaluation
24EE5712 Power System Reliability 12/27/2010
Objective
• Interest to know the likelihood that a component or a system will fail.
– Time-to-failure distribution of a component/system.
• Helps to predict the failure probability at any point in time
• For a complex system, need to estimate reliability index for design and operation purposes.
• Need to start with the component modeling
25EE5712 Power System Reliability 12/27/2010
Component Modeling
• Identify components in the system
• Describe state of each component
– For example, a generator has two states, up or down.
• In terms of probability distribution
– For example, a generator fails with probability of failure = 0.01.
• Stochastic process model
26EE5712 Power System Reliability 12/27/2010
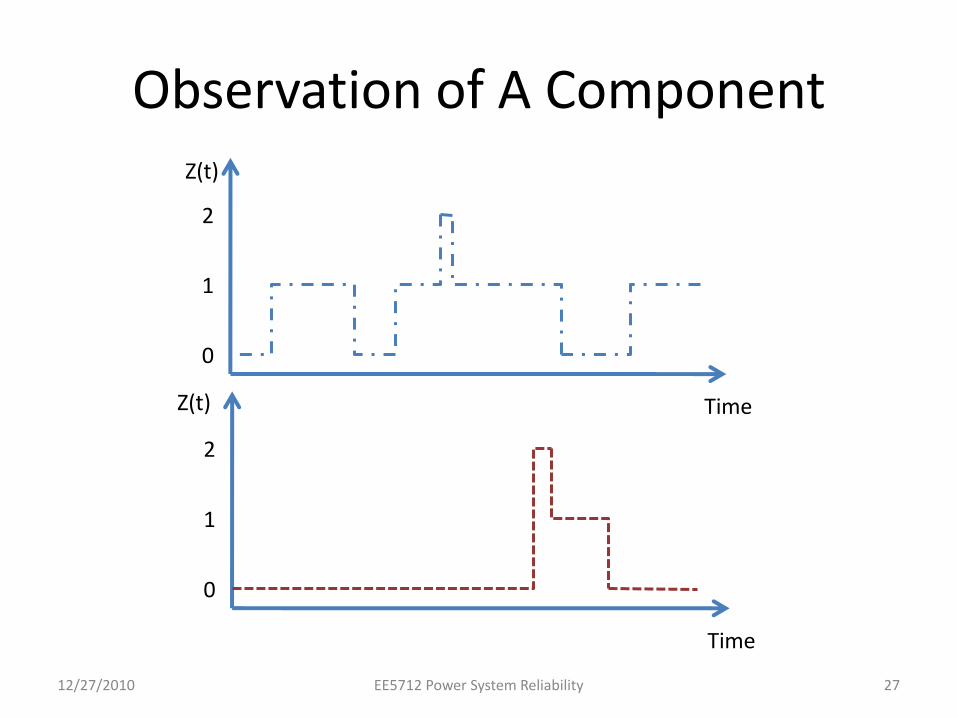
Observation of A Component
12/27/2010 EE5712 Power System Reliability 27
Time
Z(t)
0
1
2
Time
Z(t)
0
1
2
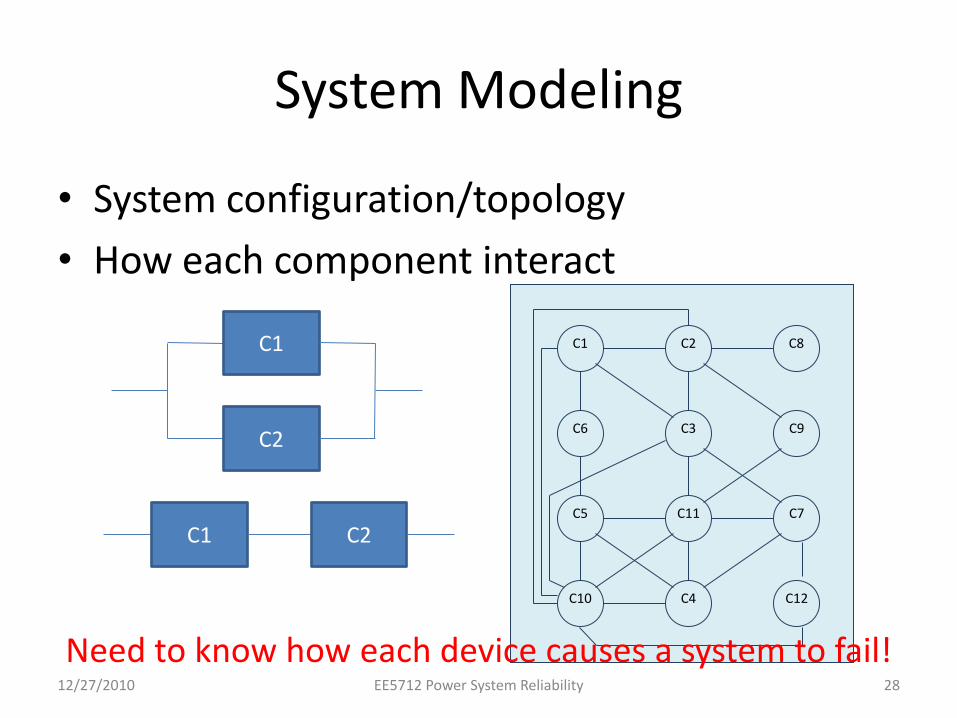
System Modeling
• System configuration/topology
• How each component interact
C1 C2
C1
C2
C1 C2 C8
C6 C3 C9
C5 C11 C7
C10 C4 C12
28EE5712 Power System Reliability 12/27/2010
Need to know how each device causes a system to fail!
Performance Function
• To evaluate system reliability
• Recall,
• Need to define “intended function”
Ability of a system to perform its intended function
29EE5712 Power System Reliability 12/27/2010
Reliability Evaluation
• Each component described by random variables
– For example, a generator has 3 capacity output, 100 MW with 0.85 probability, 50 MW with 0.14 probability, 0 MW with 0.01 probability
• System states constructed from possible combinations of component states
• Evaluate performance function of each system state
• Calculate reliability index
30EE5712 Power System Reliability 12/27/2010
INTRODUCTION TO POWER SYSTEMS
Functional Zones in Power Systems
Objective of Reliability Analysis
Levels of Reliability Analysis
Power System Reliability Indexes
31EE5712 Power System Reliability 12/27/2010
Functional Zones of Power Systems
• Generation system
– Generators
– Load
• Transmission system
– High voltage transmission lines
• Distribution system
– Low voltage transmission lines
– End users
32EE5712 Power System Reliability 12/27/2010
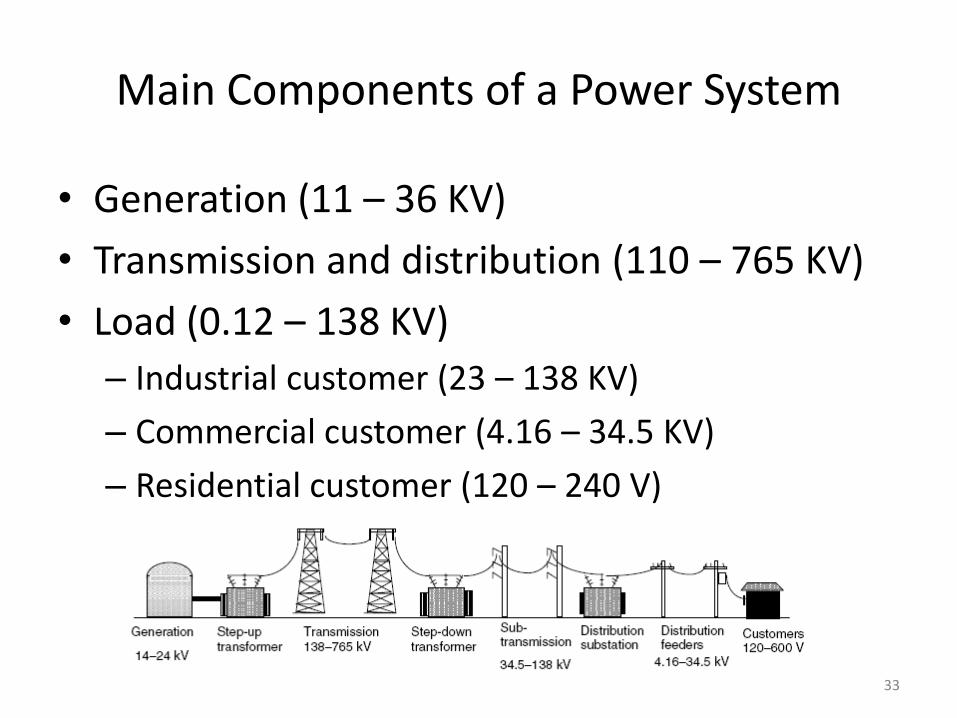
Main Components of a Power System
• Generation (11 – 36 KV)
• Transmission and distribution (110 – 765 KV)
• Load (0.12 – 138 KV)
– Industrial customer (23 – 138 KV)
– Commercial customer (4.16 – 34.5 KV)
– Residential customer (120 – 240 V)
33
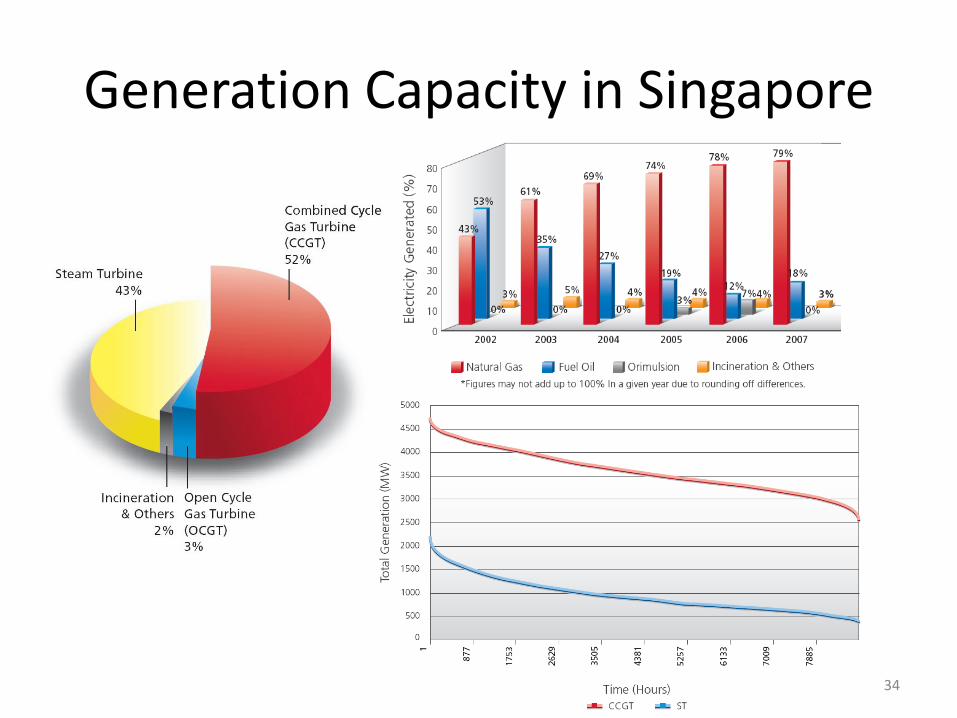
Generation Capacity in Singapore
34
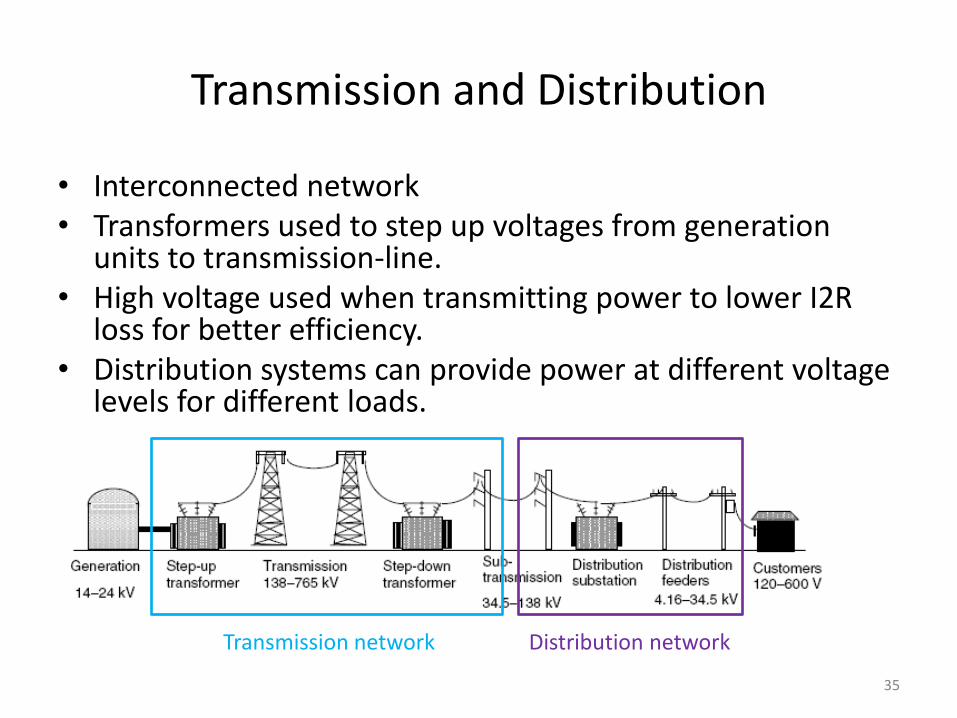
Transmission and Distribution
• Interconnected network• Transformers used to step up voltages from generation
units to transmission-line.• High voltage used when transmitting power to lower I2R
loss for better efficiency.• Distribution systems can provide power at different voltage
levels for different loads.
Transmission network Distribution network
35
36
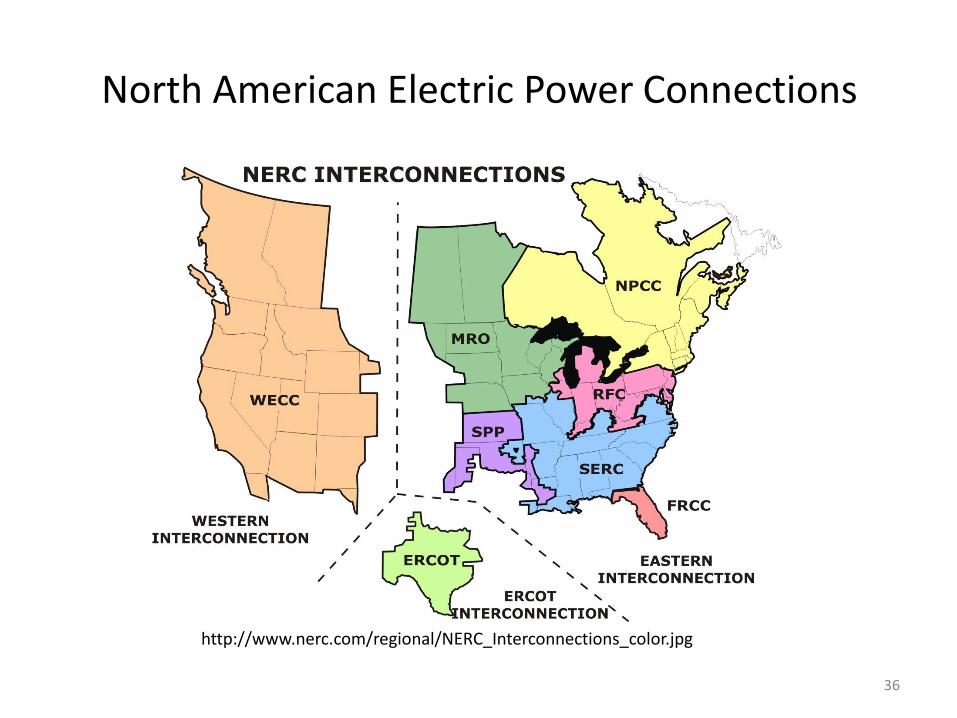
North American Electric Power Connections
http://www.nerc.com/regional/NERC_Interconnections_color.jpg
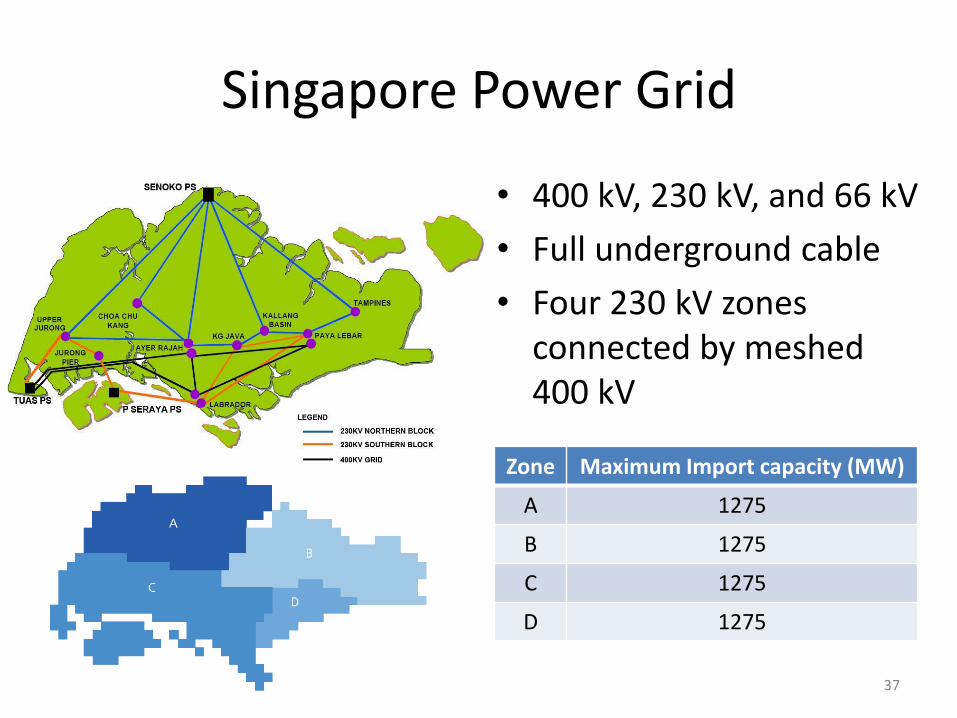
Singapore Power Grid
Zone Maximum Import capacity (MW)
A 1275
B 1275
C 1275
D 1275
• 400 kV, 230 kV, and 66 kV
• Full underground cable
• Four 230 kV zones connected by meshed 400 kV
37
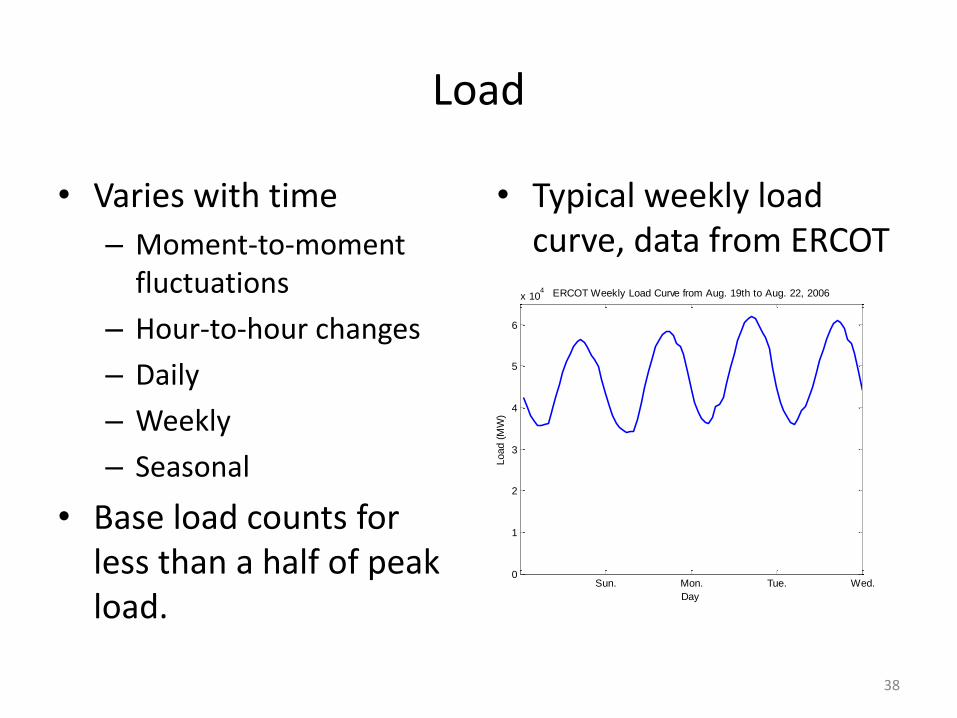
Load
• Varies with time
– Moment-to-moment fluctuations
– Hour-to-hour changes
– Daily
– Weekly
– Seasonal
• Base load counts for less than a half of peak load.
• Typical weekly load curve, data from ERCOT
38
Sun. Mon. Tue. Wed.0
1
2
3
4
5
6
x 104
Day
Load (
MW
)
ERCOT Weekly Load Curve from Aug. 19th to Aug. 22, 2006
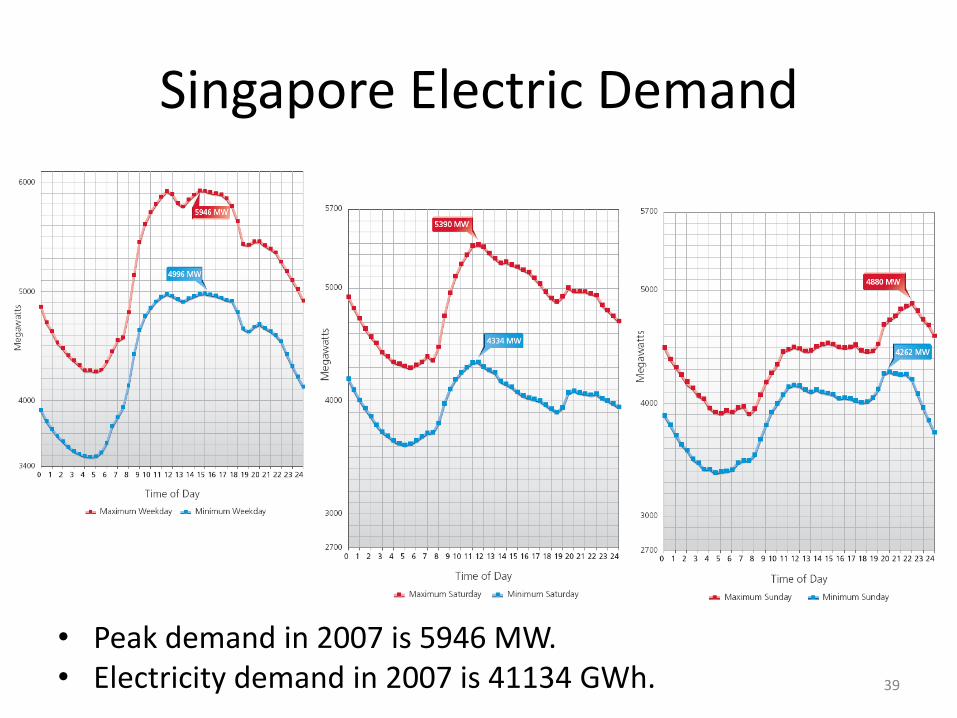
Singapore Electric Demand
• Peak demand in 2007 is 5946 MW.• Electricity demand in 2007 is 41134 GWh. 39
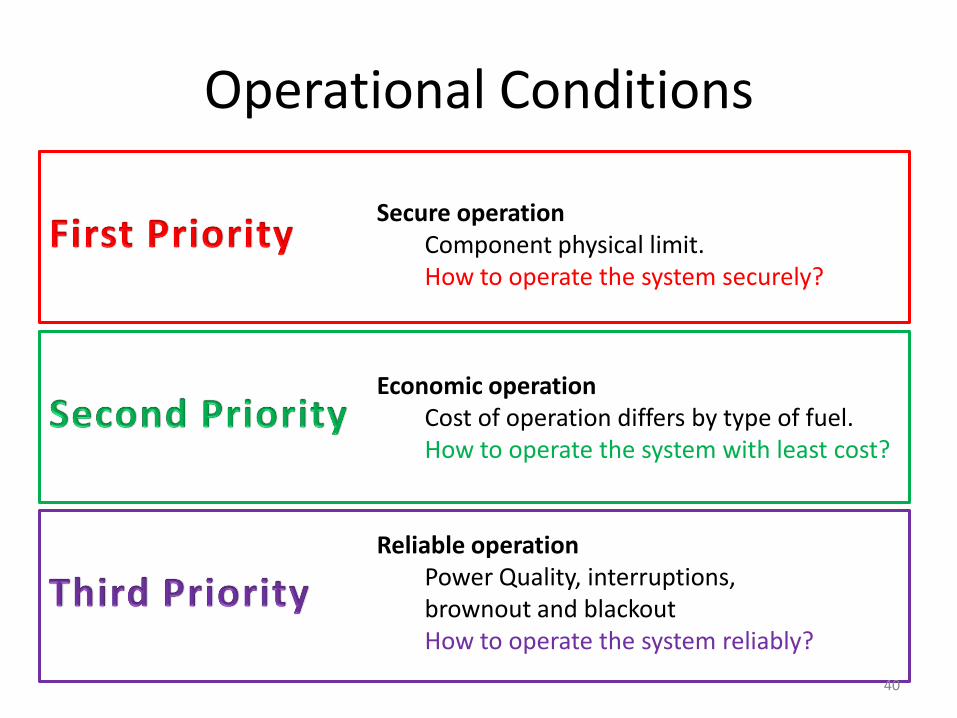
Operational Conditions
Economic operationCost of operation differs by type of fuel.How to operate the system with least cost?
Secure operationComponent physical limit. How to operate the system securely?
Reliable operationPower Quality, interruptions, brownout and blackoutHow to operate the system reliably?
40
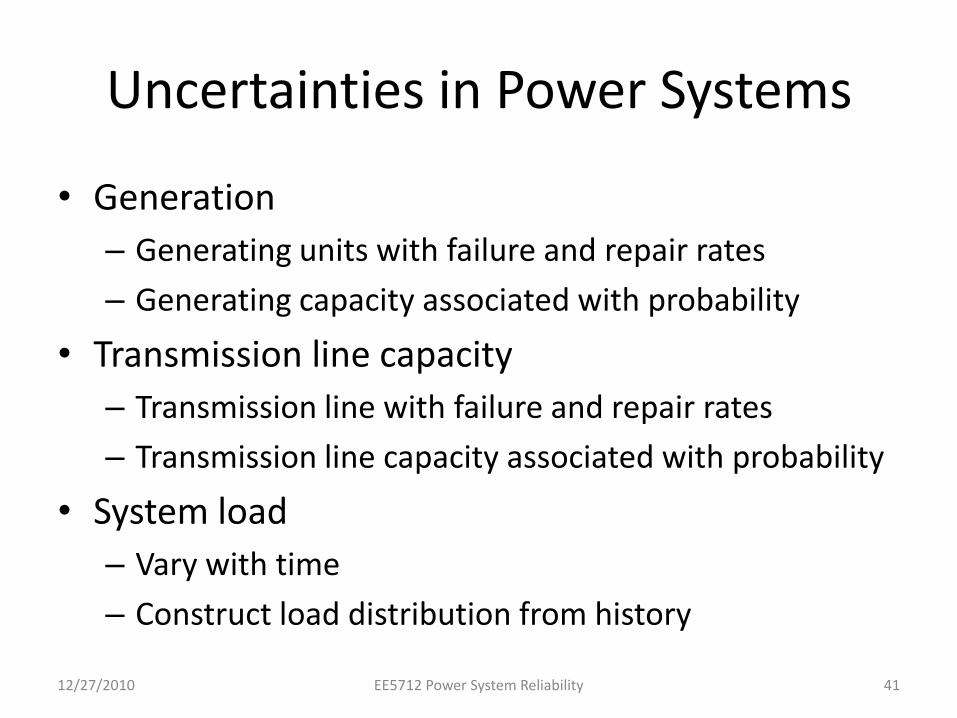
Uncertainties in Power Systems
• Generation
– Generating units with failure and repair rates
– Generating capacity associated with probability
• Transmission line capacity
– Transmission line with failure and repair rates
– Transmission line capacity associated with probability
• System load
– Vary with time
– Construct load distribution from history
41EE5712 Power System Reliability 12/27/2010
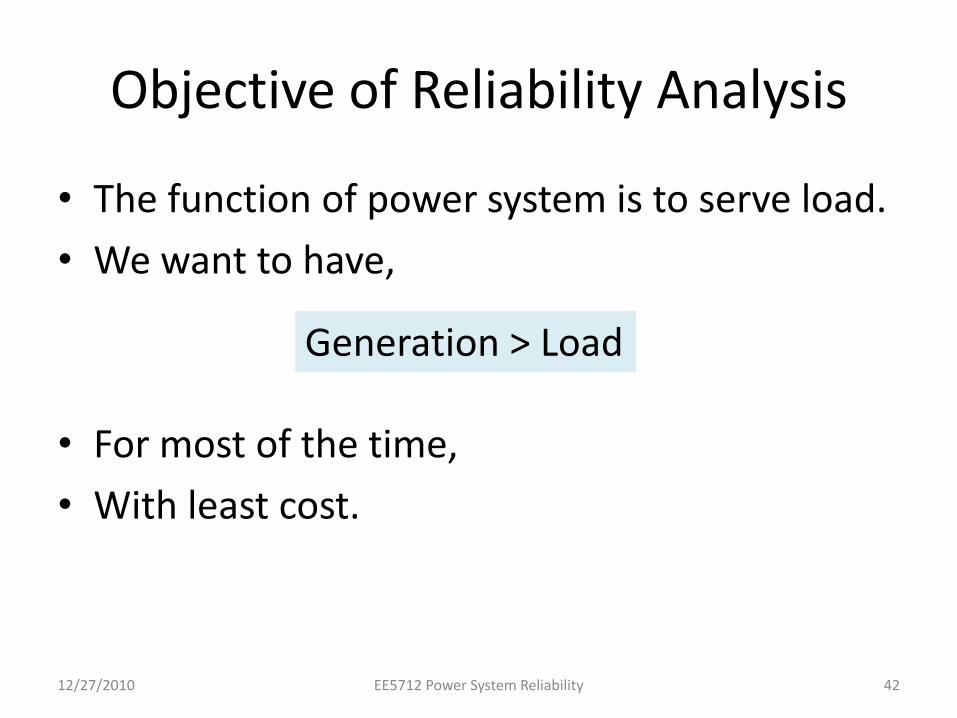
Objective of Reliability Analysis
• The function of power system is to serve load.
• We want to have,
• For most of the time,
• With least cost.
Generation > Load
42EE5712 Power System Reliability 12/27/2010
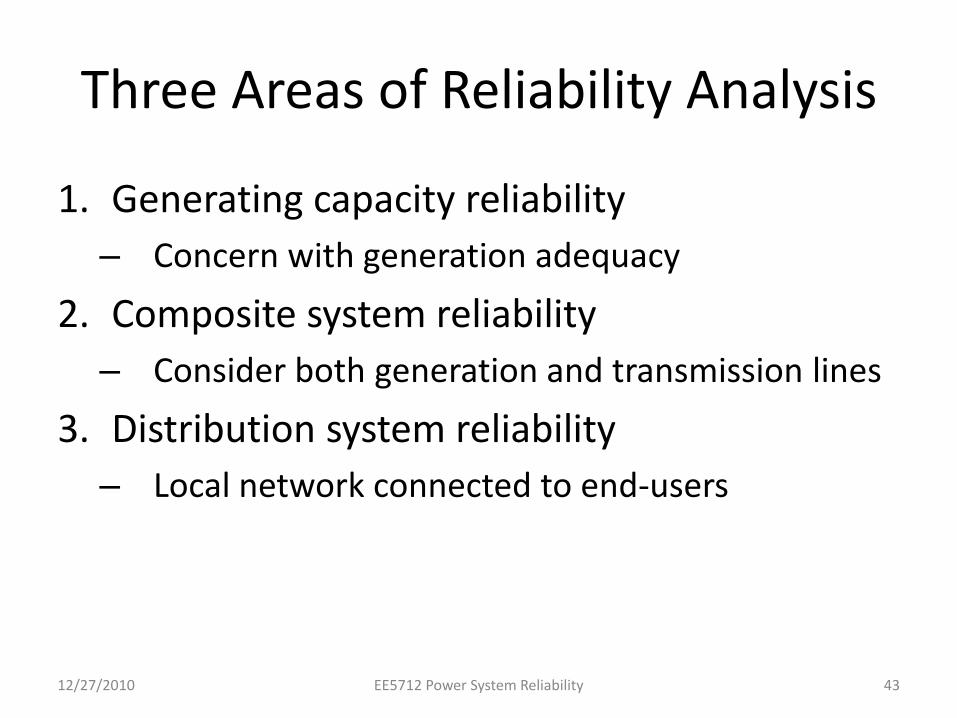
Three Areas of Reliability Analysis
1. Generating capacity reliability
– Concern with generation adequacy
2. Composite system reliability
– Consider both generation and transmission lines
3. Distribution system reliability
– Local network connected to end-users
43EE5712 Power System Reliability 12/27/2010
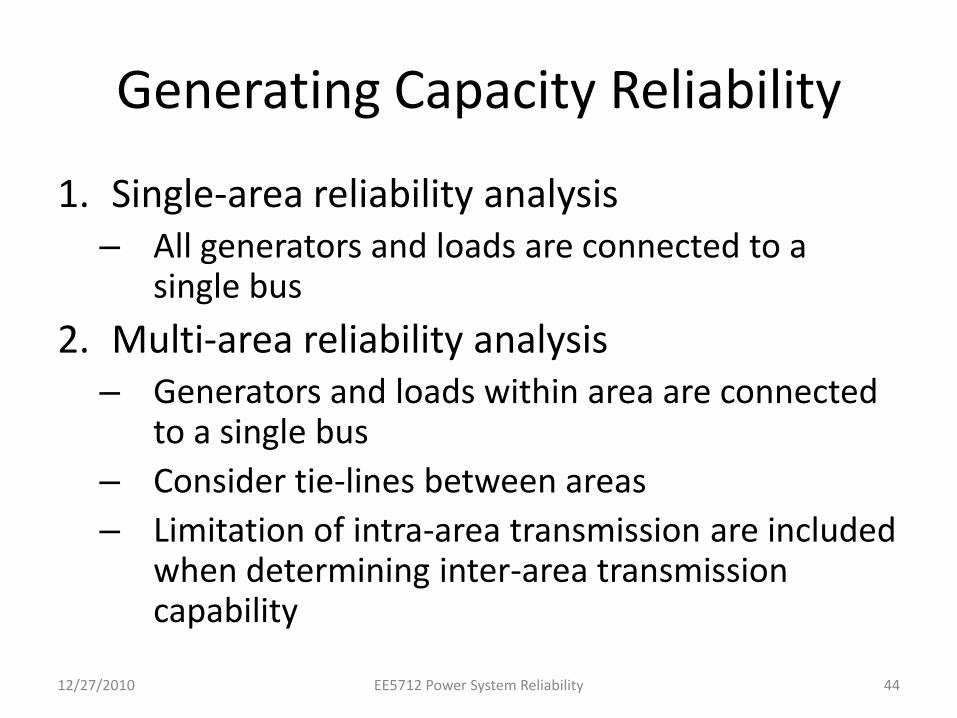
Generating Capacity Reliability
1. Single-area reliability analysis– All generators and loads are connected to a
single bus
2. Multi-area reliability analysis– Generators and loads within area are connected
to a single bus
– Consider tie-lines between areas
– Limitation of intra-area transmission are included when determining inter-area transmission capability
44EE5712 Power System Reliability 12/27/2010
Single Area Reliability Analysis
• Interest to find out the ability of existing generation to serve load
• Single bus analysis
• Generators and loads are within the same bus
• Each generators has their own performance indexes
45EE5712 Power System Reliability 12/27/2010
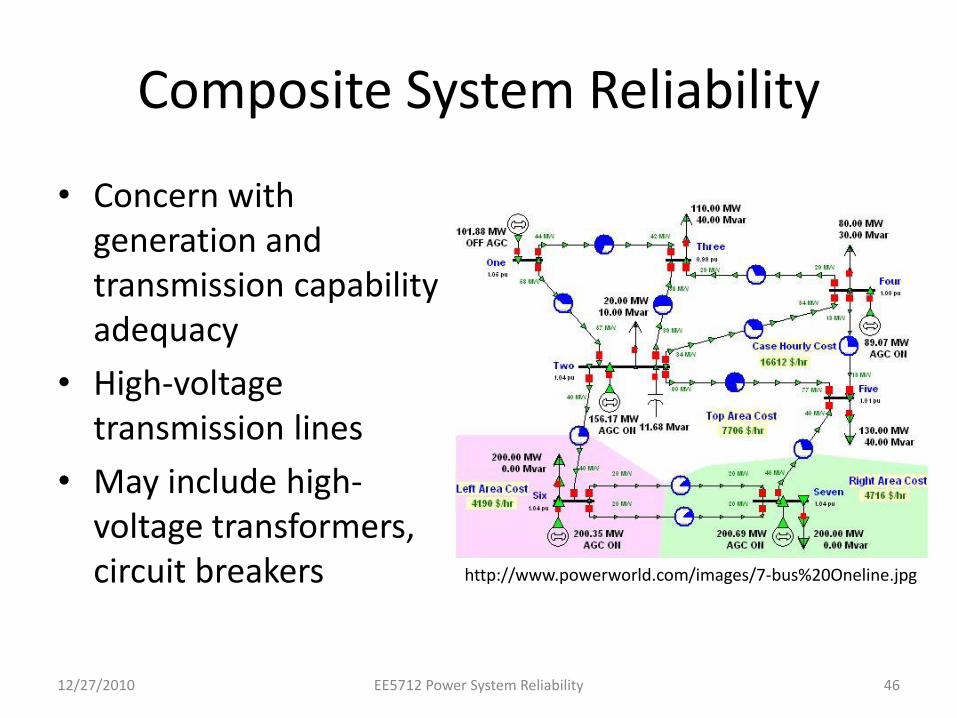
Composite System Reliability
• Concern with generation and transmission capability adequacy
• High-voltage transmission lines
• May include high-voltage transformers, circuit breakers http://www.powerworld.com/images/7-bus%20Oneline.jpg
46EE5712 Power System Reliability 12/27/2010
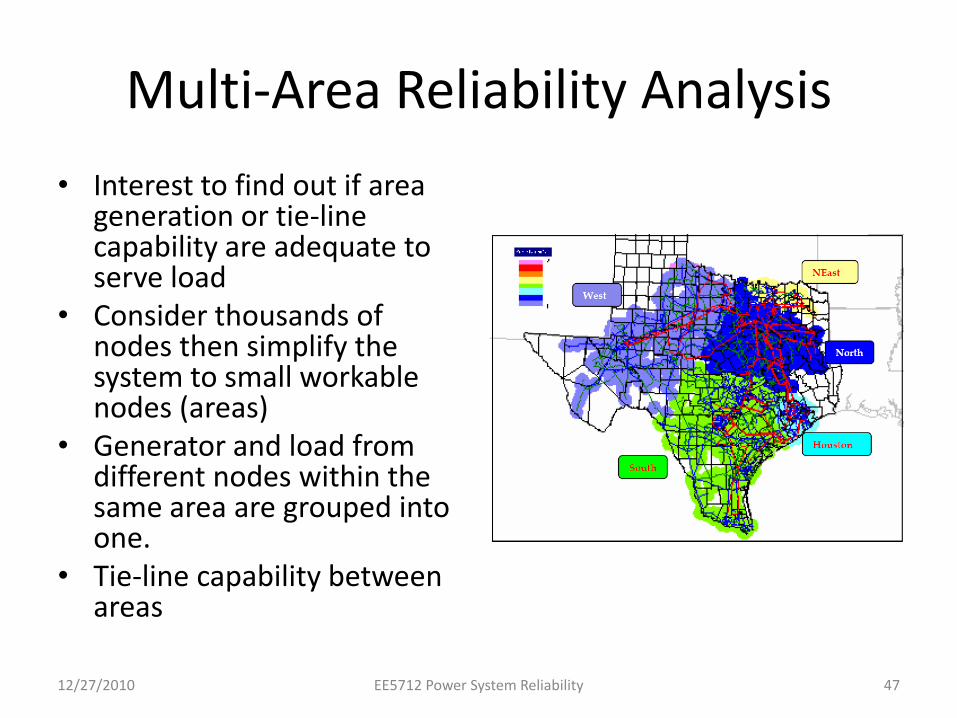
Multi-Area Reliability Analysis
• Interest to find out if area generation or tie-line capability are adequate to serve load
• Consider thousands of nodes then simplify the system to small workable nodes (areas)
• Generator and load from different nodes within the same area are grouped into one.
• Tie-line capability between areas
47EE5712 Power System Reliability 12/27/2010

Distribution System Reliability
• Interest to find out the reliability level at load point
• Network configuration/ topology
• Analysis takes into account reliability of the following low-voltage components,– Transformers
– Circuit breakers
http://www.tpub.com/content/construction/14027/css/14027_63.htm
48EE5712 Power System Reliability 12/27/2010
POWER SYSTEMS RELIABILITY INDEXES AND CRITERION
Reliability indexes
Reliability criterion
49EE5712 Power System Reliability 12/27/2010
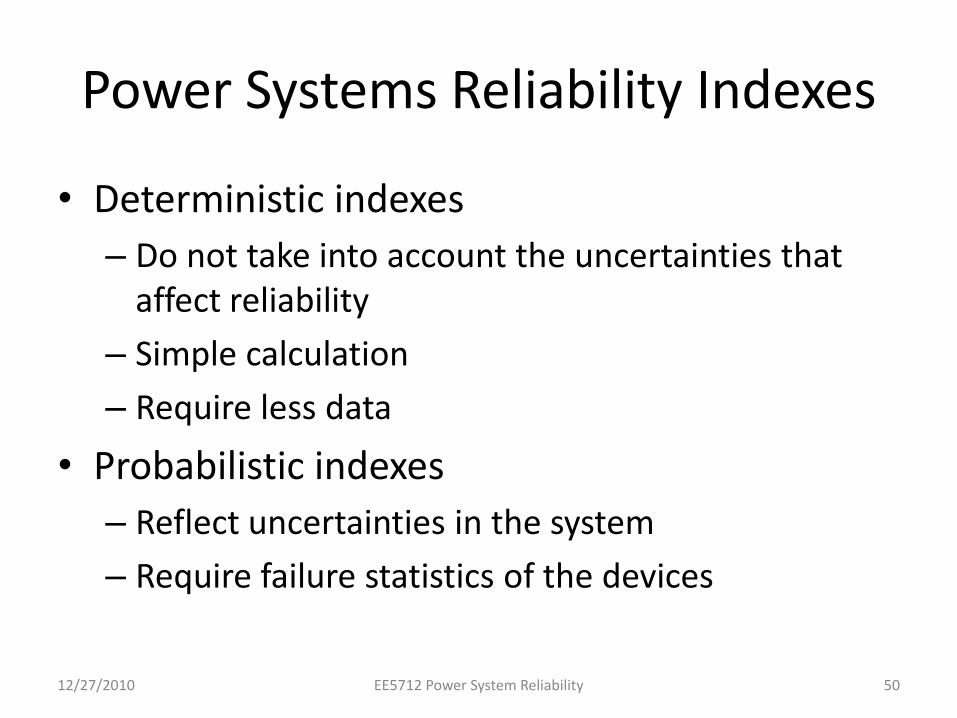
Power Systems Reliability Indexes
• Deterministic indexes
– Do not take into account the uncertainties that affect reliability
– Simple calculation
– Require less data
• Probabilistic indexes
– Reflect uncertainties in the system
– Require failure statistics of the devices
50EE5712 Power System Reliability 12/27/2010
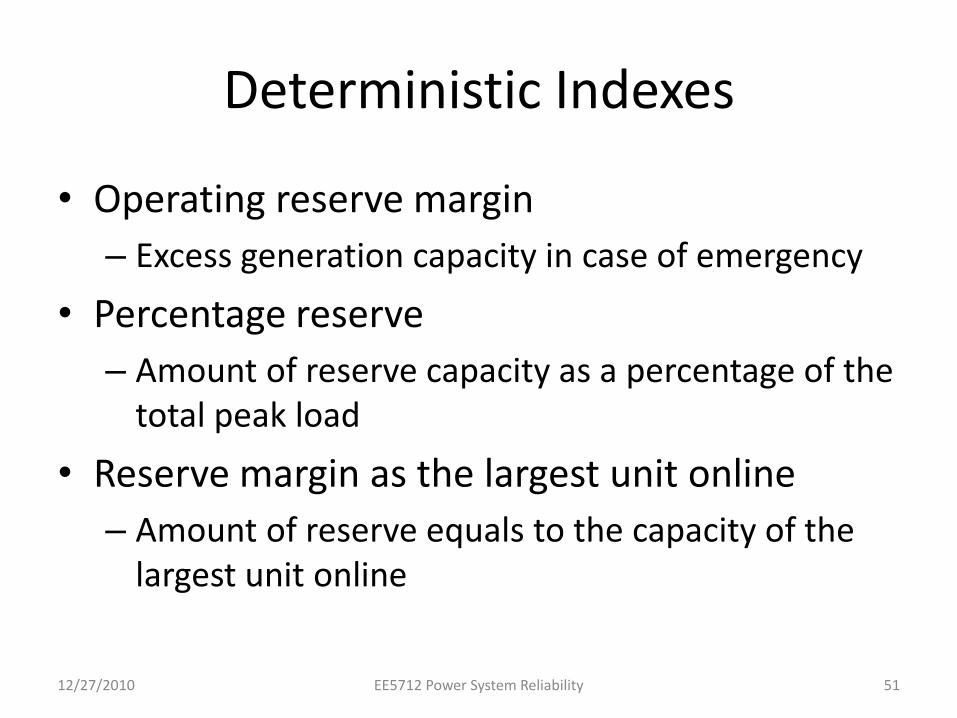
Deterministic Indexes
• Operating reserve margin
– Excess generation capacity in case of emergency
• Percentage reserve
– Amount of reserve capacity as a percentage of the total peak load
• Reserve margin as the largest unit online
– Amount of reserve equals to the capacity of the largest unit online
51EE5712 Power System Reliability 12/27/2010
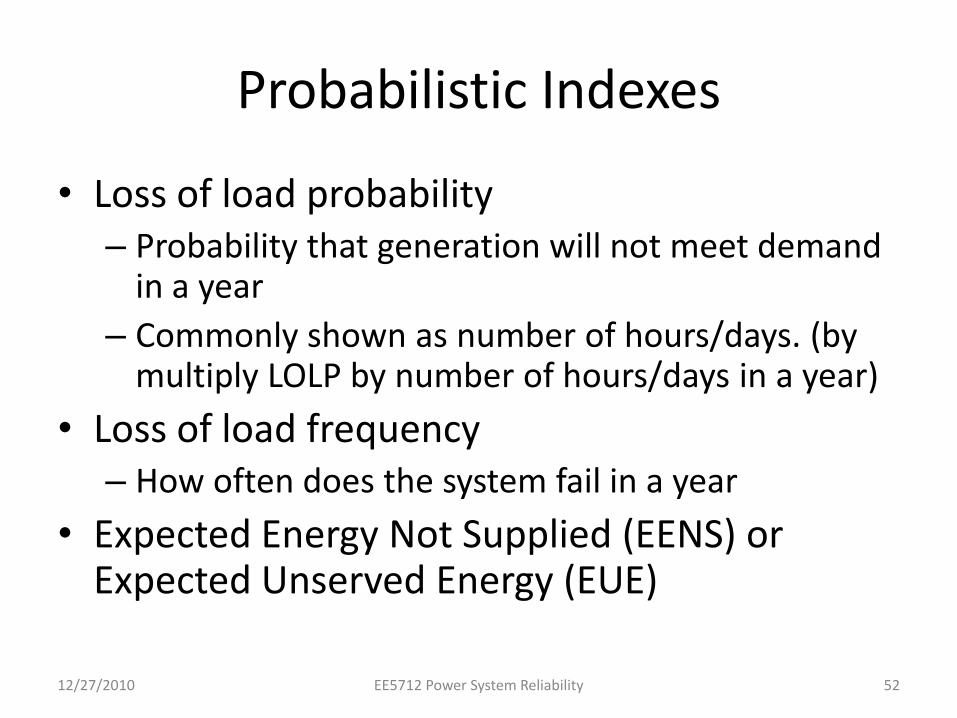
Probabilistic Indexes
• Loss of load probability– Probability that generation will not meet demand
in a year
– Commonly shown as number of hours/days. (by multiply LOLP by number of hours/days in a year)
• Loss of load frequency– How often does the system fail in a year
• Expected Energy Not Supplied (EENS) or Expected Unserved Energy (EUE)
52EE5712 Power System Reliability 12/27/2010
Why need reliability criterion?
• Develop standardized quantity
• Planning and Operation purposes
– To avoid catastrophic failures
• Design problems
53EE5712 Power System Reliability 12/27/2010
Power Systems Reliability Criterion
• Deterministic criteria
– N-m contingency analysis
– System with ‘N’ components should be able to serve peak load when loss ‘m’ components
– Sometimes called security analysis
• Probabilistic criteria
– Loss of load expectation, for example, 1 day in 10 years
54EE5712 Power System Reliability 12/27/2010
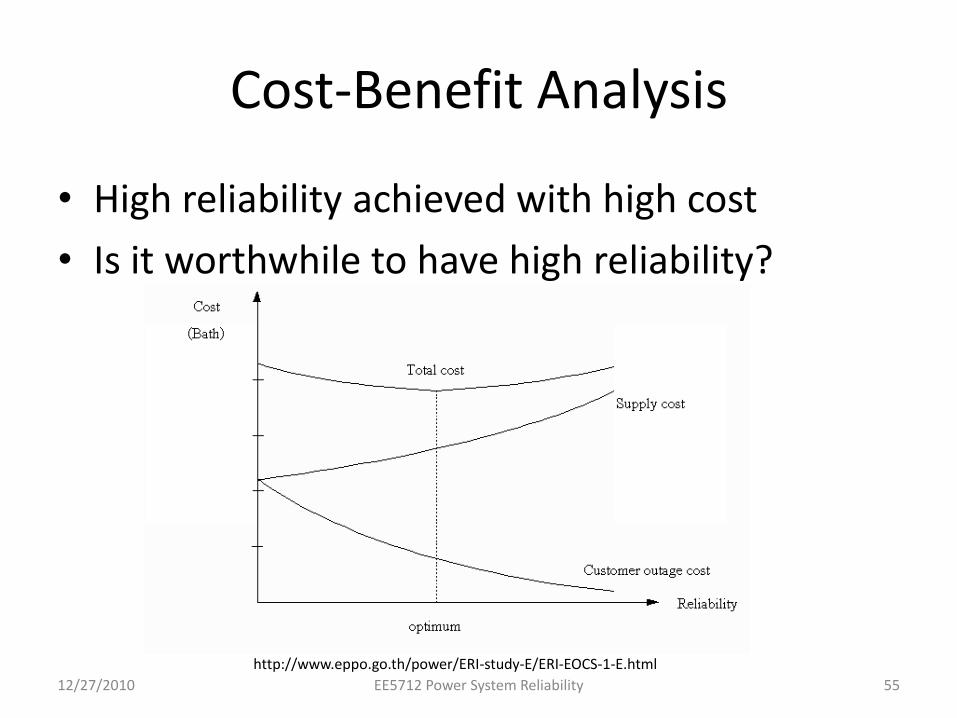
Cost-Benefit Analysis
• High reliability achieved with high cost
• Is it worthwhile to have high reliability?
http://www.eppo.go.th/power/ERI-study-E/ERI-EOCS-1-E.html
55EE5712 Power System Reliability 12/27/2010
Summary
• We know what reliability is
• We know a bit about power system reliability
• We need to know
– Probability theory
– Reliability theory
– Random processes
56EE5712 Power System Reliability 12/27/2010
Reading Materials
• Review basic probability theory
– Random variables
– Probability rules (addition, multiplication,
– Conditional probability
– Probability distribution functions
57EE5712 Power System Reliability 12/27/2010


![Windows introduccion[1]](https://img.pdfslide.us/doc/110x75/55857c61d8b42aac148b4573/windows-introduccion1.jpg)