Embed Size (px)
Citation preview
1
International Trade
2
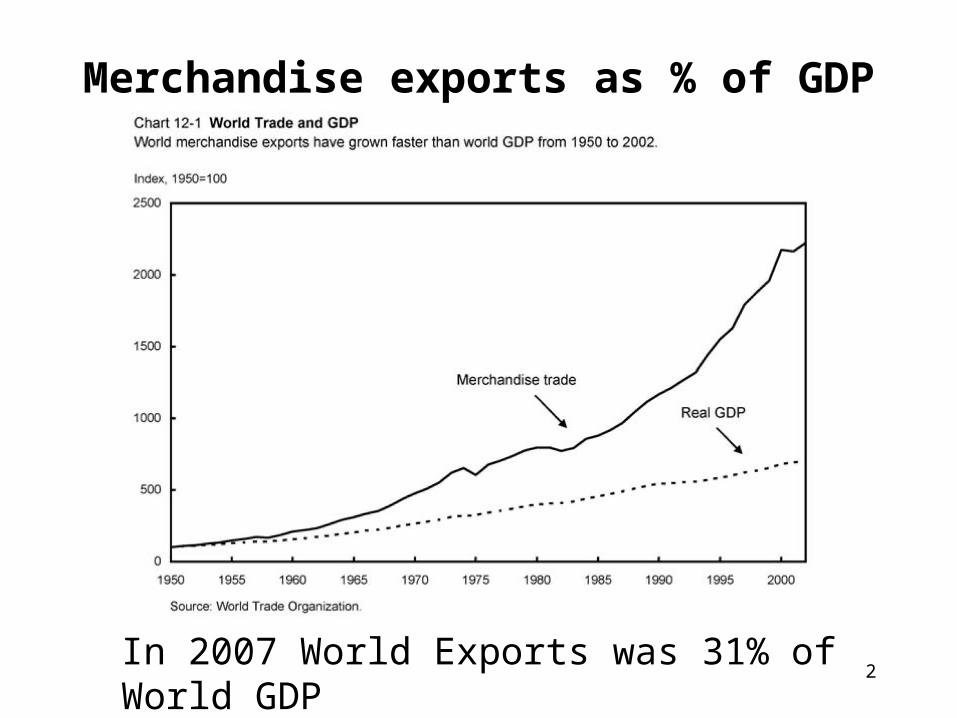
Merchandise exports as % of GDP
In 2007 World Exports was 31% of World GDP

3
Country 1980 1990 2000 2006
United States 11.45 12.37 13.51 9.87
Germany 9.41 10.95 7.90 8.90
China .. 1.33 3.53 7.25
Japan 6.19 7.48 6.67 5.00
United Kingdom 6.15 5.53 5.11 4.66
France 6.45 6.60 4.77 4.11
Italy 4.10 5.08 3.75 3.53
Netherlands 3.81 3.68 3.21 3.20
Canada 3.16 3.46 4.15 3.15
Hong Kong, China .. .. 3.07 2.66
Top Ten Exporting Countries Account for 52% of World Exports
Source: WDI Online, World Bank.
Country Exports as a Fraction of World Exports
Top Ten Exporting Countries
4
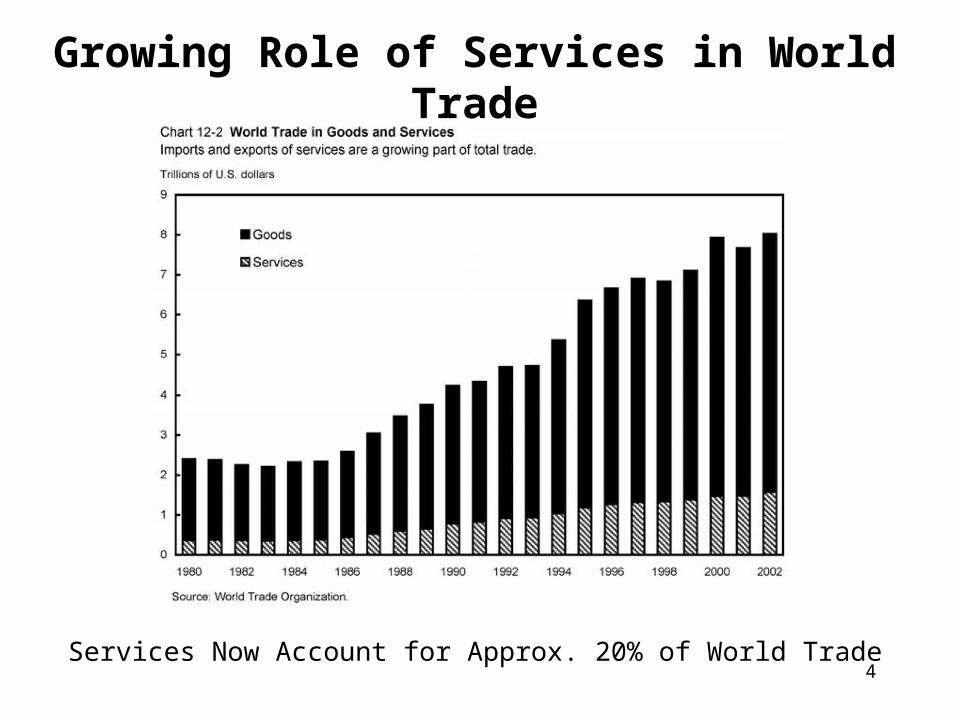
Growing Role of Services in World Trade
Services Now Account for Approx. 20% of World Trade

5
U.S. China
Butter (per pound) 20 5
Wheat (per bushel) 8 4
Total Labor 10 10
Comparative AdvantageExample
Output per Worker
• U.S. is more efficient (higher productivity) than China in producing both goods. Hence the US has a competitive advantage in producing both goods.
• U.S. is relatively more efficient in producing Butter (20/8>5/4) and China is relatively more efficient in producing Wheat, so the U.S. has a comparative advantage in producing Butter and China has a comparative advantage in producing Wheat.
6
Production possibility set for the U.S
Trading Line: 2 Butter = 1 Wheat
Butter
U.S.:comparative advantage in
Butter.
200
80 100
Production possibility set for China
40
Butter
Wheat
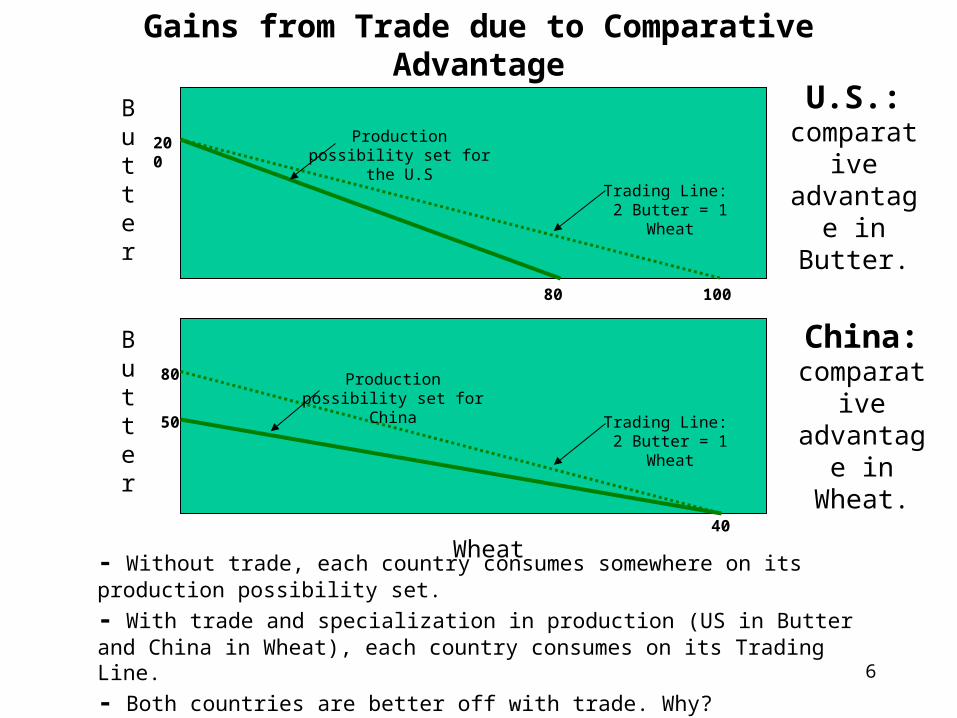
- Without trade, each country consumes somewhere on its production possibility set.
- With trade and specialization in production (US in Butter and China in Wheat), each country consumes on its Trading Line.
- Both countries are better off with trade. Why?
80
50
China:comparative advantage in
Wheat.
Trading Line: 2 Butter = 1 Wheat
Gains from Trade due to Comparative Advantage
7
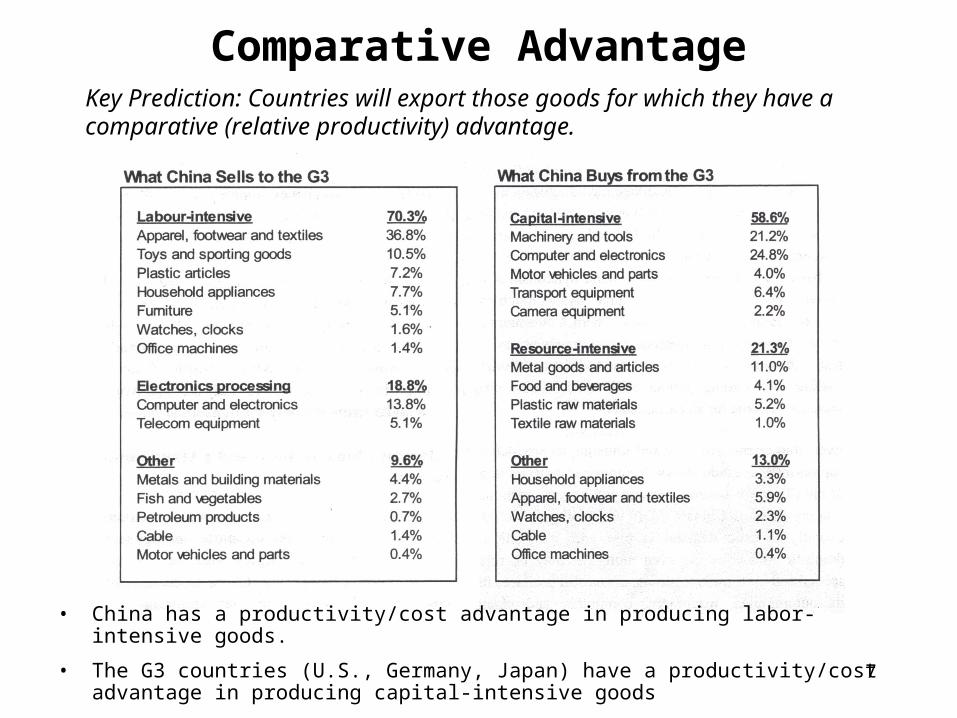
Comparative AdvantageKey Prediction: Countries will export those goods for which they have a comparative (relative productivity) advantage.
• China has a productivity/cost advantage in producing labor-intensive goods.
• The G3 countries (U.S., Germany, Japan) have a productivity/cost advantage in producing capital-intensive goods
8
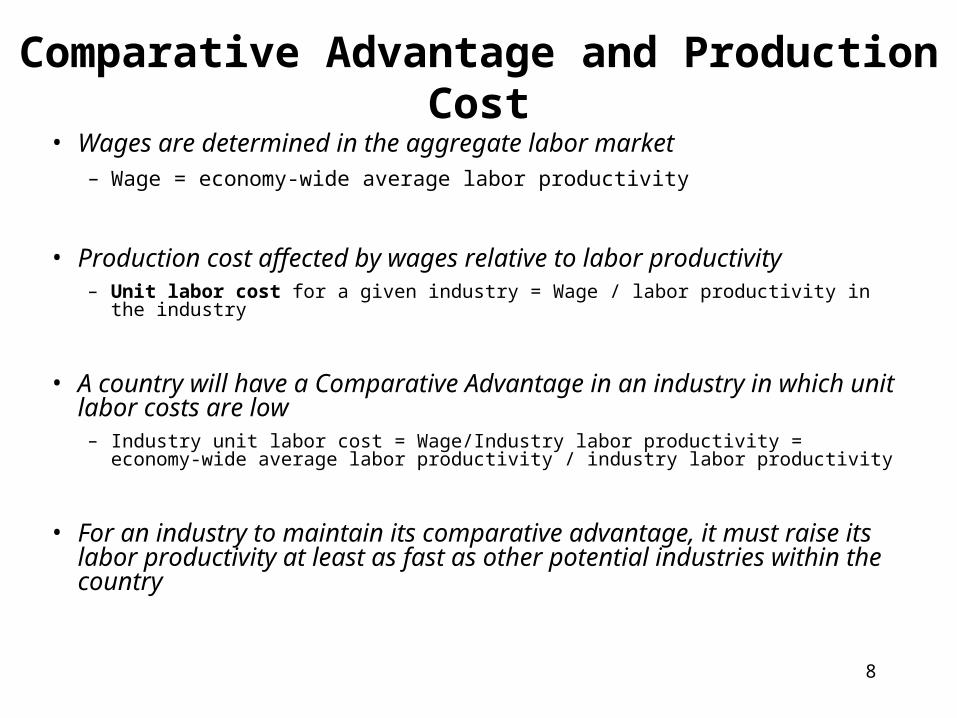
Comparative Advantage and Production Cost
• Wages are determined in the aggregate labor market– Wage = economy-wide average labor productivity
• Production cost affected by wages relative to labor productivity– Unit labor cost for a given industry = Wage / labor productivity in the industry
• A country will have a Comparative Advantage in an industry in which unit labor costs are low
– Industry unit labor cost = Wage/Industry labor productivity = economy-wide average labor productivity / industry labor productivity
• For an industry to maintain its comparative advantage, it must raise its labor productivity at least as fast as other potential industries within the country
9
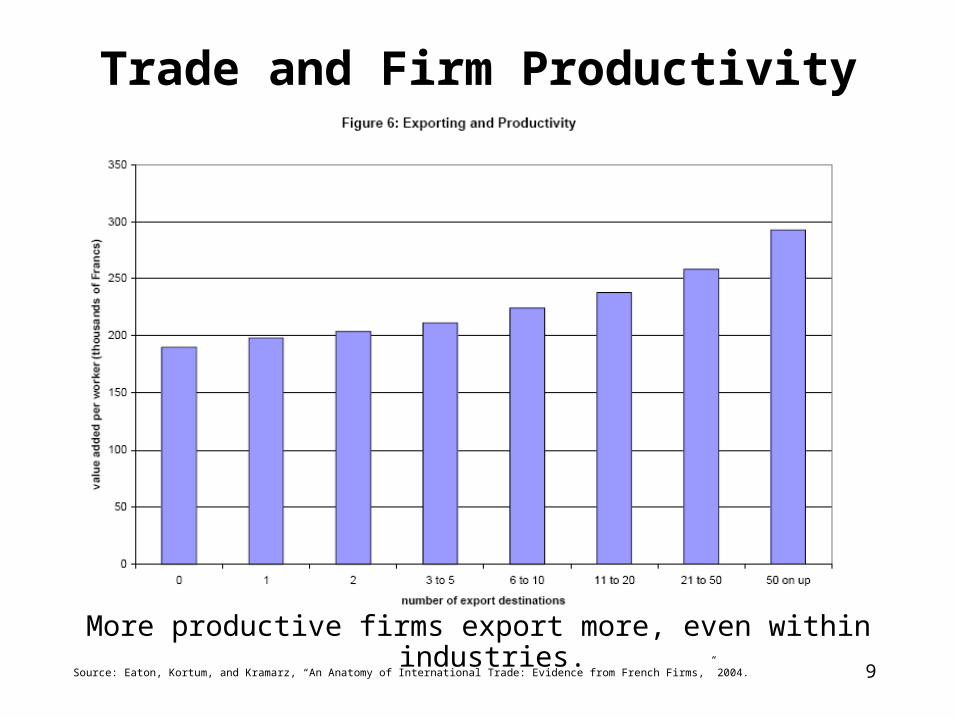
Trade and Firm Productivity
More productive firms export more, even within industries.Source: Eaton, Kortum, and Kramarz, “An Anatomy of International Trade: Evidence from French Firms,” 2004.
10
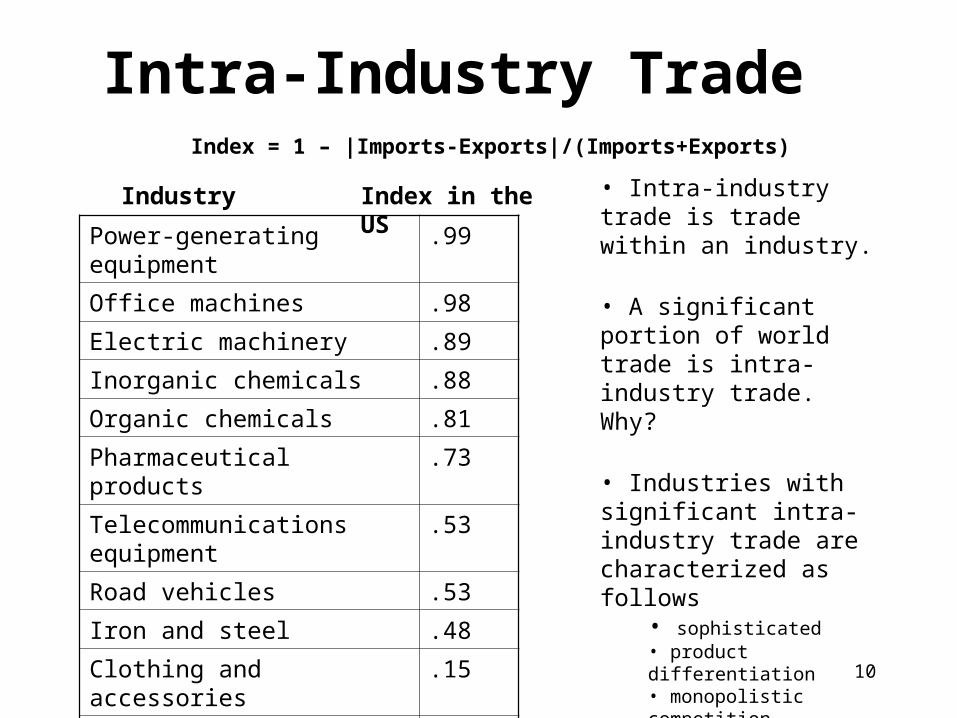
Intra-Industry Trade
Power-generating equipment .99
Office machines .98
Electric machinery .89
Inorganic chemicals .88
Organic chemicals .81
Pharmaceutical products .73
Telecommunications equipment .53
Road vehicles .53
Iron and steel .48
Clothing and accessories .15
Footwear .00
Index = 1 – |Imports-Exports|/(Imports+Exports)
Industry Index in the US • Intra-industry trade is trade within an industry.
• A significant portion of world trade is intra-industry trade. Why?
• Industries with significant intra-industry trade are characterized as follows
• sophisticated• product differentiation• monopolistic competition• Krugman Nobel Prize
• Fixed costs leads to economies of scale (global brands)
• New Trade Theory

11
Trade and ConflictGiven the gains from trade, why is there so much conflict surrounding trade issues?
• Trade encourages some industries within a country to expand and others to contract
• Factors of production tied to the contracting industries will lose and those tied to the expanding industries will win.– Low-skill workers in the U.S. are hurt from trade– Owner’s of natural resources (e.g., oil) benefit from trade as the
demand for these goods rise– Farmers in the U.S. may be hurt from trade
• Often there are a few big losers and many small winners from trade, so the losers tend to exploit the political system to their advantage
12
The 7 Instruments of Trade Policy
AntidumpingDuties
LocalContent
Requirements
Tariffs
VoluntaryExports
Restraints
Subsidies
AdministrativePoliciesImport
Quotas
13
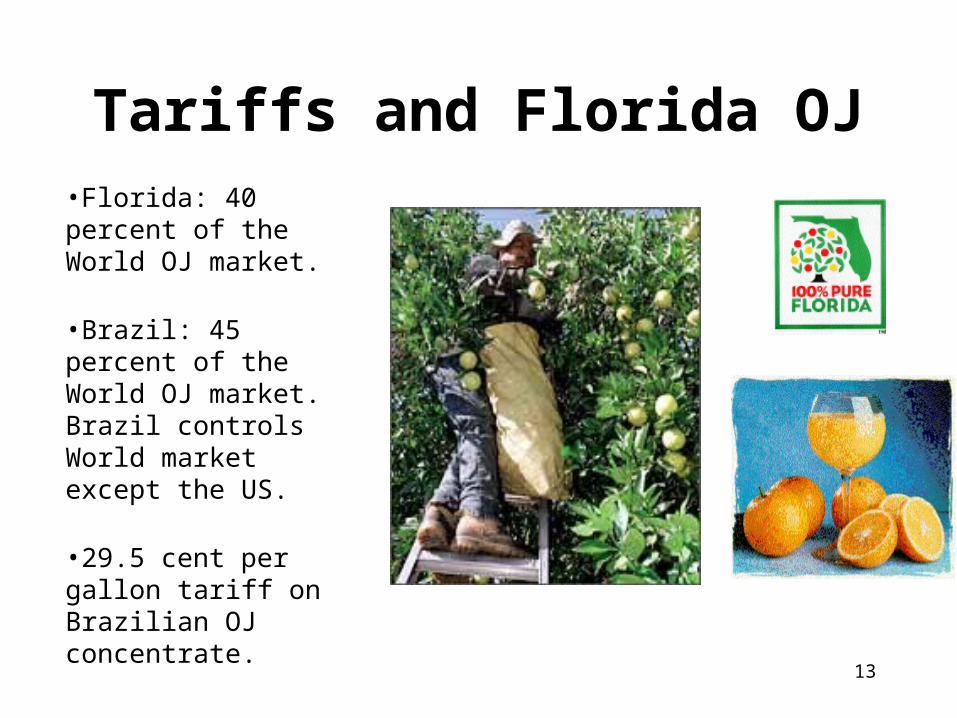
Tariffs and Florida OJ•Florida: 40 percent of the World OJ market.
•Brazil: 45 percent of the World OJ market. Brazil controls World market except the US.
•29.5 cent per gallon tariff on Brazilian OJ concentrate.
14
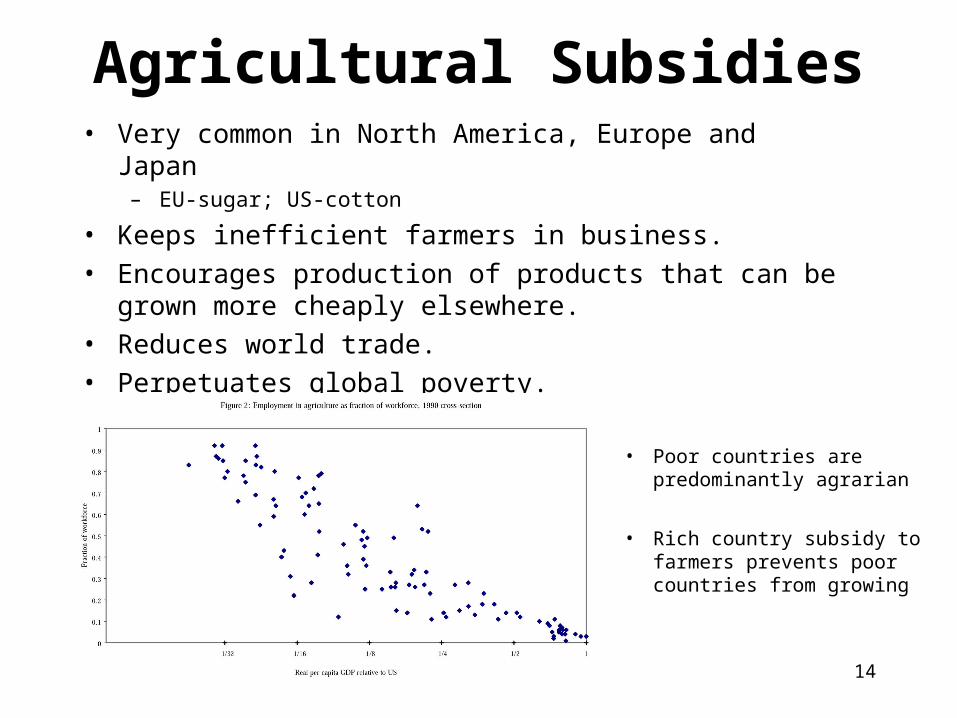
Agricultural Subsidies• Very common in North America, Europe and Japan
– EU-sugar; US-cotton
• Keeps inefficient farmers in business.
• Encourages production of products that can be grown more cheaply elsewhere.
• Reduces world trade.
• Perpetuates global poverty.
• Poor countries are predominantly agrarian
• Rich country subsidy to farmers prevents poor countries from growing
15
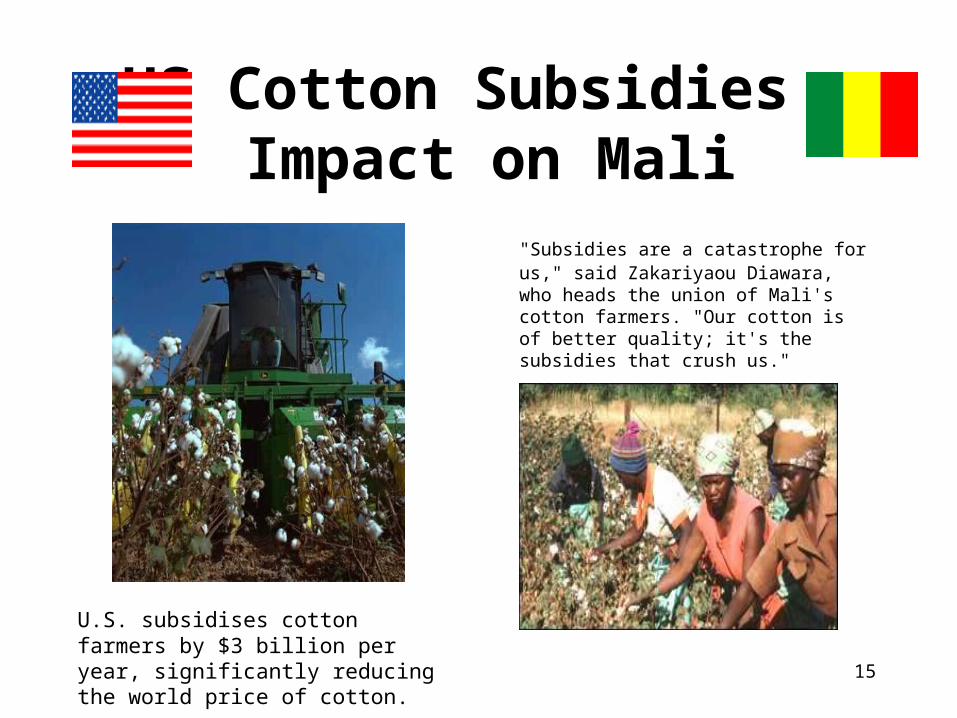
US Cotton Subsidies – Impact on Mali
"Subsidies are a catastrophe for us," said Zakariyaou Diawara, who heads the union of Mali's cotton farmers. "Our cotton is of better quality; it's the subsidies that crush us."
U.S. subsidises cotton farmers by $3 billion per year, significantly reducing the world price of cotton.
16
Development of the World Trading System• Prior to WWI, free trade as government policy
– Britain’s (1846) repeal of the Corn Laws.– Britain continued free trade policy.
• WWI to WWII– Great Depression led to Smoot-Hawley Act (1930) that
started a trade war (US exports tumbled)
• General Agreement on Tariffs and Trade (GATT) proposed by US in 1947.– 19 original members grew to 120 nations
• World Trade Organization (WTO) replaced GATT in 1995– Currently 158 member countries

17
• Tariffs were raised during the global economic depression in the 1930s as an attempt to protect domestic industries
• Trade in second half of century boosted by declining tariffs
History of Tariffs
18
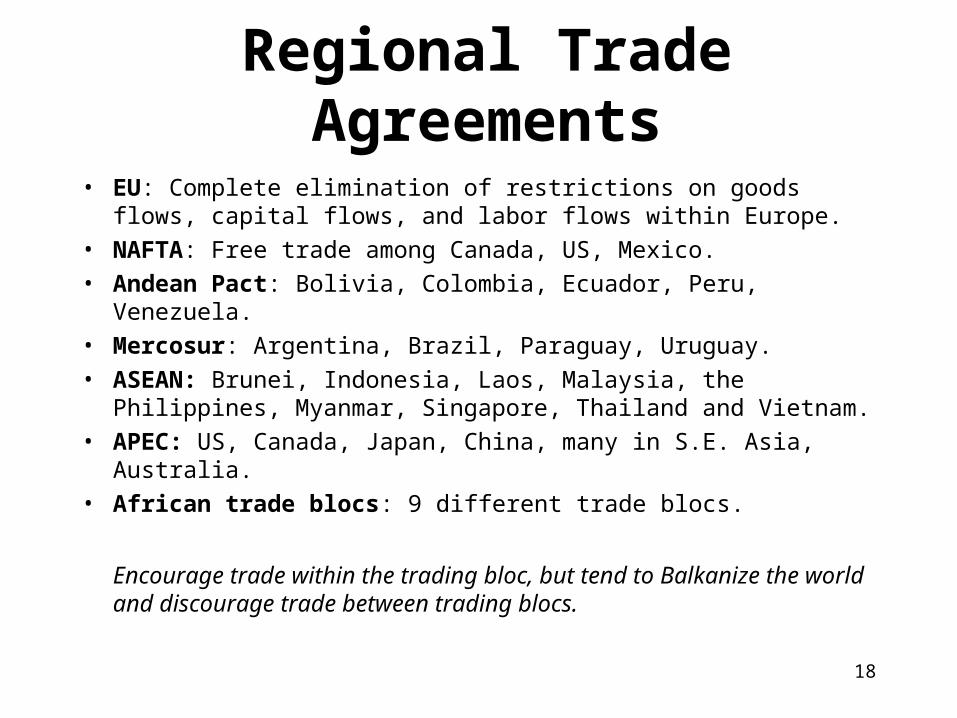
Regional Trade Agreements
• EU: Complete elimination of restrictions on goods flows, capital flows, and labor flows within Europe.
• NAFTA: Free trade among Canada, US, Mexico.
• Andean Pact: Bolivia, Colombia, Ecuador, Peru, Venezuela.
• Mercosur: Argentina, Brazil, Paraguay, Uruguay.
• ASEAN: Brunei, Indonesia, Laos, Malaysia, the Philippines, Myanmar, Singapore, Thailand and Vietnam.
• APEC: US, Canada, Japan, China, many in S.E. Asia, Australia.
• African trade blocs: 9 different trade blocs.
Encourage trade within the trading bloc, but tend to Balkanize the world and discourage trade between trading blocs.