Embed Size (px)
Citation preview
1
Improved Jamming Resilience of GPS Timing forPhasor Measurement Units using
Position-Information-Aided Vector TrackingSriramya Bhamidipati, and Grace Xingxin Gao, Senior Member, IEEE
Abstract—In recent years, there has been a major push bythe power industry to utilize Phasor Measurement Units (PMUs)for wide area monitoring and control. PMUs rely on GlobalPositioning System (GPS) to provide absolute time referencenecessary to obtain synchronized phasor measurements. However,due to the low received signal strength and unencrypted nature ofthe civil GPS signals, PMU reliability is susceptible to both non-malicious and malicious interference. To ensure the power gridstability, we aim to develop a robust GPS time transfer techniquefor PMUs.
In this paper, we propose our Position-Information-AidedVector Tracking (PIAVT), which leverages the inherent staticproperties of the GPS receiver to aid the underlying vectortracking loop. Vector tracking evaluates the closed feedbackloop based navigation solution estimation thereby enhancing thetracking capability of the weak satellite channels. To demonstratethe impact of external jamming attack and accidental receivermalfunction on PMUs, we firstly conduct validation tests usingReal-Time Digital Simulator (RTDS) with IEEE C37.118 Stan-dard as reference. We then conduct field experiments to verifythat the proposed PIAVT approach 1) enhances the robustnessof GPS receiver against jamming and interference; and 2) is ableto account for the satellite data anomalies and receiver errors.Later, we mimic the setup of power grid using Universal SoftwareRadio Peripheral (USRP), hardware PMUs, RTDS to validate theincreased robustness of PIAVT against external GPS attacks ascompared to the conventional approach.
Keywords—Phasor Measurement Unit, Real time Digital Simu-lator, Power Systems, GPS, Jamming, Vector Tracking.
I. INTRODUCTION
Currently, power grids employ Supervisory Control AndData Acquisition (SCADA) system for collecting and monitor-ing the electrical wave observations for Wide Area MonitoringSystems (WAMS) [1]-[2]. The SCADA system generally pollsthe information from remote sites once every few secondsfor critical systems and up to a few minutes for non-criticalsystems [3]. During system disturbances, the information col-lected by SCADA does not accurately represent the systemand therefore the states cannot be precisely estimated [4].
A. Phasor Measurement UnitsWhile the current power grids depend on SCADA, the
upcoming smart grid require more advanced devices withimproved state estimations and sampling rates. Phasor Mea-surement Units (PMUs) are the devices that provide precisevoltage and current measurements at frequencies up to 60 Hz.
The high frequency measurements collected by PMUs arecapable of providing the control stations with informationat sub-second time frames, thereby allowing dynamic statemeasurements of the power system [5]-[6].
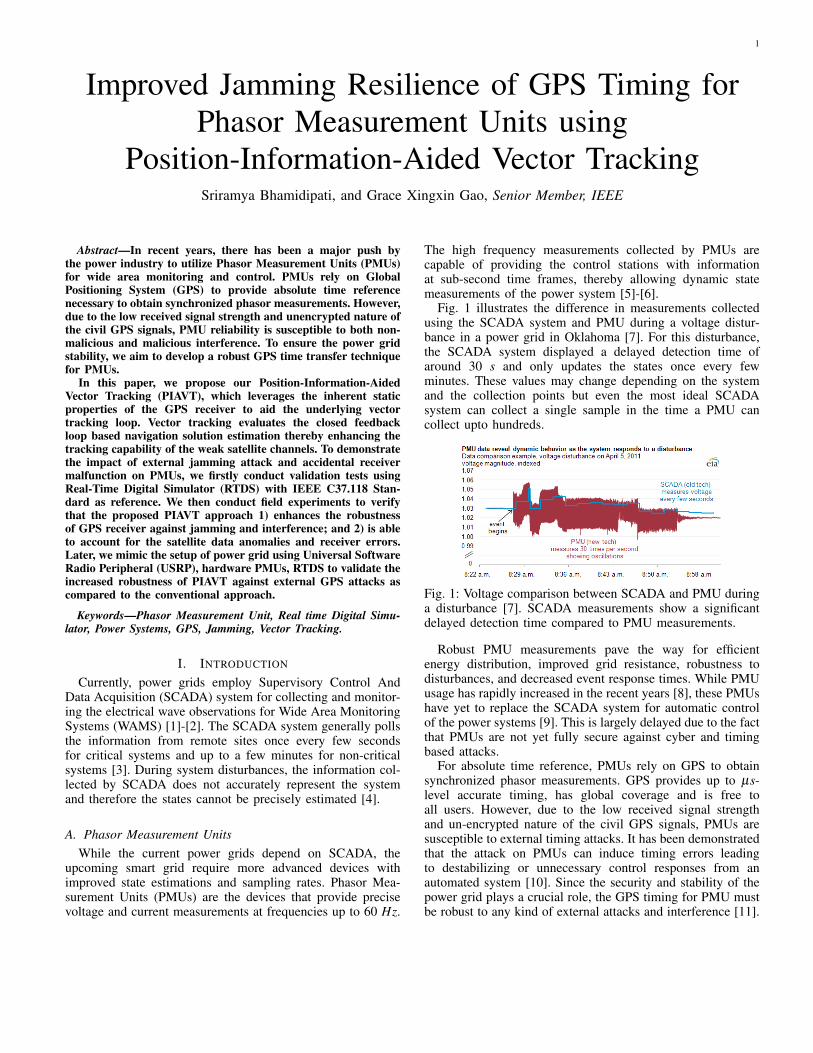
Fig. 1 illustrates the difference in measurements collectedusing the SCADA system and PMU during a voltage distur-bance in a power grid in Oklahoma [7]. For this disturbance,the SCADA system displayed a delayed detection time ofaround 30 s and only updates the states once every fewminutes. These values may change depending on the systemand the collection points but even the most ideal SCADAsystem can collect a single sample in the time a PMU cancollect upto hundreds.
Fig. 1: Voltage comparison between SCADA and PMU duringa disturbance [7]. SCADA measurements show a significantdelayed detection time compared to PMU measurements.
Robust PMU measurements pave the way for efficientenergy distribution, improved grid resistance, robustness todisturbances, and decreased event response times. While PMUusage has rapidly increased in the recent years [8], these PMUshave yet to replace the SCADA system for automatic controlof the power systems [9]. This is largely delayed due to the factthat PMUs are not yet fully secure against cyber and timingbased attacks.
For absolute time reference, PMUs rely on GPS to obtainsynchronized phasor measurements. GPS provides up to µs-level accurate timing, has global coverage and is free toall users. However, due to the low received signal strengthand un-encrypted nature of the civil GPS signals, PMUs aresusceptible to external timing attacks. It has been demonstratedthat the attack on PMUs can induce timing errors leadingto destabilizing or unnecessary control responses from anautomated system [10]. Since the security and stability of thepower grid plays a crucial role, the GPS timing for PMU mustbe robust to any kind of external attacks and interference [11].
2
B. Background of GPS
GPS is designed as a satellite-based radio navigationsystem that provides Position, Velocity, and Time (PVT)information to any GPS receiver [12]. Each satellite inthe GPS constellation is equipped with multiple networksynchronized atomic clocks. Given this, the user receivercan effectively synchronize to the satellite atomic clocksfor near µs level accurate time, without incurring the costof owning an atomic clock [13]. GPS receivers requirea minimum of four or more satellites in view to calculatethe unknown 3-Dimensional (3D) user position and clock bias.
1) Estimation of PVT navigation solution
Most commonly used civilian GPS signals broadcast atL1= 1575.42 MHz frequency and are modulated with publiclyknown pseudo-random noise (PRN) codes and the naviga-tion message. By tracking the code frequency ( f i
code) andphase (φ i
code) of the ith satellite, the corresponding signals aredecoded and used to determine the signal travel time (t i
travel),satellite positions (Si), and the satellite clock biases (T i
b). Thepseudorange (ρ i) which represents the distance between theuser receiver and the ith satellite can then be calculated asρ i = c∗ t i
travel .Once the pseudorange, satellite positions, and satellite clock
biases are known, we implement tri-lateration [14] usingNewton-Raphson method or least-squares technique to deter-mine the user location:
ρi =√
((xis− x)2 +(yi
s− y)2 +(zis− z)2 + c(Tb−T i
b)+ εi (1)
where Si = (xis,y
is,z
is) is the 3D position of the ith satellite,
X = (x,y,z) is the 3D position of the user receiver, Tb is thereceiver clock bias and ε i is the range measurement error.Given that we have 4 or more satellites in view, the fourunknowns (X and Tb) can be solved by minimizing ε i.
2) Scalar and Vector Tracking Loop
Tracking loops play a critical role in continuously track-ing the dynamically changing code ( f i
code, φ icode) and car-
rier ( f icarr, φ i
carr) parameters of the incoming GPS signal.However, the code and carrier tracking loops are vulnerableto low signal-to-noise ratio (SNR) and high dynamics [15].
In a traditional GPS receiver, acquisition is done first todetermine the satellites in view and their corresponding initialcode phase and carrier Doppler frequency. Based on the initialacquisition, the scalar tracking loops track the satellite signalsindependently and estimate the corresponding pseudoranges. Inscalar tracking, there is no information exchange between thetracking loops and navigation block. Also in scalar tracking,the dependency between the satellite channels based on thesame user position and velocities is neglected [16].
In order to leverage the inherent connections of the system,vector tracking loop was developed by Spilker in 1996 [17].Unlike the scalar tracking loops, a vector tracking loop com-bines the tracking and PVT estimation blocks into a single
loop. Vector tracking enhances performance by enabling closedloop information flow between the channels [18].
C. IEEE-C37.118 Standard for SynchrophasorsPMU measurements are to be synchronized to UTC time
with accuracy that meets the accuracy requirements of IEEE-C37.118 Standard [19]-[21]. A phase error of 0.01 rad (0.57◦)in the PMU measurements causes 1% total vector error (TVE),which is the maximum steady-state error allowed. A 0.01 radphase error corresponds to a time error of ±26 µs for a 60 Hzsystem, and ±31 µs for a 50 Hz system.
D. Effect of GPS Vulnerabilities on PMUsGPS vulnerabilities have a direct impact on the smooth
functioning of PMUs which in turn effect the stability of thepower grid. The weak signal strength and un-encrypted natureof the civil GPS signals leave receivers at risk for externalinterference which potentially alters the position and timingaccuracy of the GPS receivers. Different types of externaldisturbances are explained as follows:
1) Unintentional interference:
There are many sources of unintentional interference toGPS signals [22], such as naturally occurring electromagnetic(EM) fields [23]-[25], solar flares [26], and other navigationalsystems that shares part of the GPS band [27].
2) Jamming:
As shown in Fig.2(a), a jammer transmits high-poweredsignals in the GPS frequency band which effectively raises thenoise floor and prevents a user receiver from acquiring andtracking the GPS signal [28]-[30]. In the case of jamming andunintentional interference, the GPS time becomes completelyunavailable for PMUs.
(a) (b)
Fig. 2: Types of timing attacks that affect the robustness;(a) broadcast high power noise signals in L1 frequency range;(b) record-and-replay of high power spurious GPS signals.
3) Spoofing:
Since the structure of the civil GPS signals is publiclyknown, a spoofer can generate falsified GPS signals to misleadthe target receiver as in Fig.2(b). There are many types ofspoofing attacks [31]. One type of spoofing is known as
3
meaconing, also known as bent-pipe spoofing and record-and-replay attack. A spoofer employing meaconing attack recordsthe authentic GPS signals in one location and rebroadcaststhem at a later time towards the target receiver with a higherpower [32].
4) Accidental receiver malfunction:
In some cases, a GPS receiver yields significantly incorrecttiming information due to accidental receiver malfunctionsor satellite broadcast data anomalies. According to the GPSstatistics of 2009 [33], 0.34% of the navigation messagesrecorded by the GPS receivers of International GNSS Service(IGS) were incorrect. On 31st July 2006, 29 out of 245 GPSreceivers in the IGS network misinterpreted the navigationmessage [34].
Unlike spoofing which requires the attacker to be smart andpossess sophisticated equipment, GPS receivers are more proneto easy-to-cause vulnerabilities like jamming, unintentionalnoise and external interference [35]-[37]. The jamming attack-ers only require proximity and simple off-the-shelf equipmentto cause disastrous impacts. Therefore, we aim to providereliable GPS-based timing to PMUs which: improve the ro-bustness of GPS against interference and jamming attacks; in-crease the receiver robustness against GPS navigation messageanomalies.
E. Contribution of our workThe contribution of this thesis is in three major aspects:1) We proposed a robust Position-Information-Aided Vec-
tor Tracking (PIAVT) architecture [38] that utilizes thestatic PVT information of the GPS receiver to improveits robustness against external timing attacks. PIAVT isbased on the vector tracking, a closed feedback loopthat combines the tracking and navigation blocks intoa single process thereby enhancing the SNR of weaksatellites.
2) We designed a sophisticated power test-bed in Univer-sity of Illinois at Urbana-Champaign involving PMUs,USRPs and RTDS that mimics the authentic arrange-ment of a power sub-station. We thereby verified thedangerous impacts of jamming attacks on commercialclocks that supply timing to the PMUs.
3) Using our above-designed test-bed, we demonstratedthe violation of the IEEE-C37.118 Standard for Syn-chrophasors using traditional GPS approach while ourPIAVT algorithm supplied attack-resilient GPS timing.Thereby, we validated the improved jamming resilienceand stability of power grid by incorporating our pro-posed PIAVT algorithm.
The rest of the paper is organized as follows: Section IIdescribes our PIAVT algorithm and its underlying conceptsin detail. This section also outlines the initialization of PIAVTand its Kalman Filter tuning. Section III verifies the increasedresilience of our PIAVT using GPS experimental setup againstexternal attacks. Section IV demonstrates the impact of jam-ming attack on commercial clocks and thereafter validates the
improved power grid stability by implementing PIAVT usinga virtual power grid testbed. Section VI concludes the paper.
II. PIAVTFor timing applications in power grids, since the receivers
are static, receiver position information is provided to vectortracking, called PIAVT [38]. Given this, the basic idea is toleverage the known position information of GPS receiversto accurately track the code and carrier measurements. Byprojecting the relative position and velocity between satellitesand the receiver onto the Line of sight (LOS) direction, thesetracking parameters are precisely estimated.
Tracking robustness is also improved through the use ofKalman Filtering. The parameters of the tracking loops areadaptively chosen to narrow the loop filter bandwidth basedon the static position of the GPS receiver. The narrow-bandtracking loop limits receiver noise, which reduces the effectiveradius of any jamming attacks.
A. Defining the ParametersPIAVT is used in conjunction with the existing scalar loops
to enhance the performance of the system. The vector trackingloops loosely depend on scalar tracking for initialization whichis done after the scalar loop gains a strong fix on the signal.
In our PIAVT, the receiver processes the raw GPS signalsfrom N visible satellites. The objective is to improve therobustness of the clock bias and clock drift at any tth timeepoch, so that accurate timing signal is given as input to thePMU.
Xt : 3D position of the receiver at
tth time epoch= [x,y,z]
Vt : 3D velocity of the receiver at
tth time epoch= [x, y, z]
Tt : Clock parameters of the receiver at
tth time epoch= [cδ t,cδ t]
The incoming GPS signal is dependent on four signal parame-ters as defined in the Eq. (2). The parameters in Eq. (3) need tobe estimated accurately at each time epoch to track the satellitesignal continuously.
R : raw received GPS signalY : signal replica of the GPS signal
=N
∑i=1
Y i
Y i : signal replica corresponding to ith satellite
= Di(t) Gi( f icode(t)+φ
icode) e j2π( f i
carr(t)+φ icarr)
Di(t) : Navigation databit from ith satellite
Gi(t) : L1 C/A code chip from ith satellite
(2)
4
φicode : Code phase of the ith satellite signal
=−fC/A
c(||XECI−Si
x,y,z,ECI ||)+(Tb−T ib)
f icode : Code frequency of the ith satellite signal
= fC/A +fC/A
fL1× f i
dcarr
φicarrier : Carrier phase of the ith satellite signal
f icarrier : Carrier frequency of the ith satellite signal
= fIF + f idcarr
losix,y,z : LOS vector for ithsatellite in ECI frame
=−(XECI−Si
x,y,z,ECI)
||XECI−Six,y,z,ECI ||
(3)
f idcarr : Carrier Doppler frequency of the ithsatellite
=− fL1
c(−losi
x,y,z.(VECI−Six,y,z,ECI)+(Td−T i
d))(4)
where,
fC/A : Chiprate of C/A code, 1.023 MHzfL1 : Frequency of L1 signal carrier, 1575.42 MHzfIF : Intermediate frequency (IF), Hz
ECI : Earth Centered Inertial coordinate system.
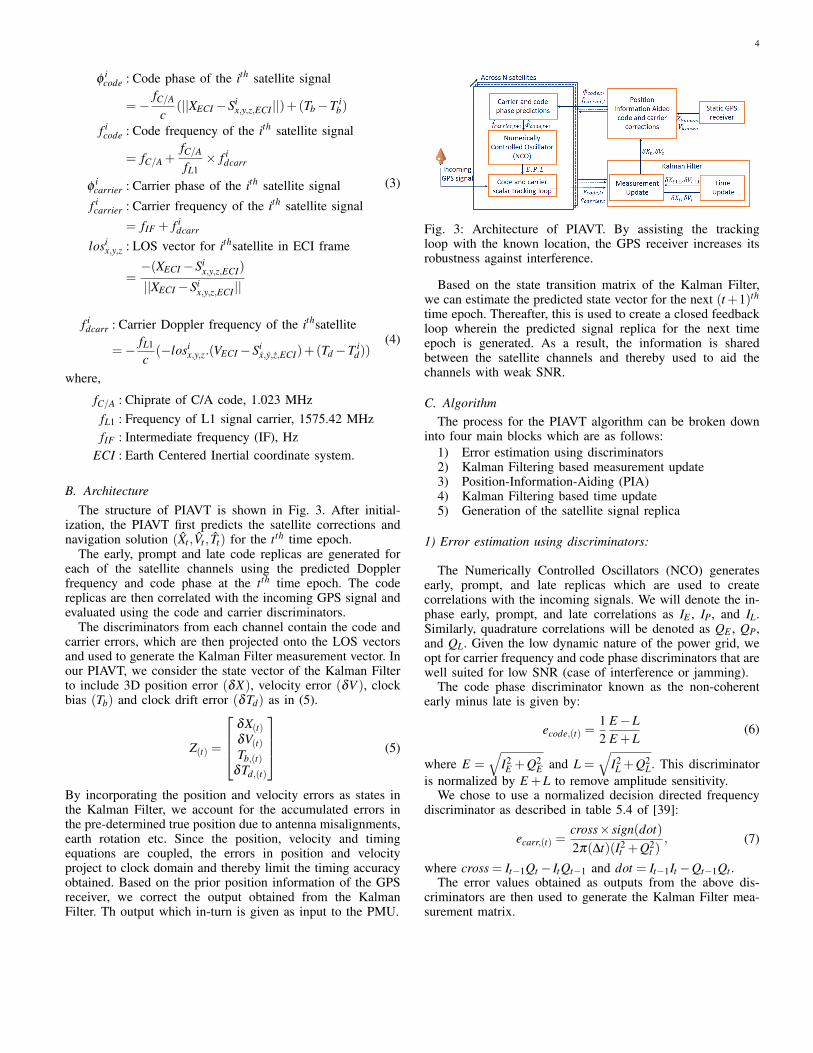
B. ArchitectureThe structure of PIAVT is shown in Fig. 3. After initial-
ization, the PIAVT first predicts the satellite corrections andnavigation solution (Xt ,Vt , Tt) for the tth time epoch.
The early, prompt and late code replicas are generated foreach of the satellite channels using the predicted Dopplerfrequency and code phase at the tth time epoch. The codereplicas are then correlated with the incoming GPS signal andevaluated using the code and carrier discriminators.
The discriminators from each channel contain the code andcarrier errors, which are then projected onto the LOS vectorsand used to generate the Kalman Filter measurement vector. Inour PIAVT, we consider the state vector of the Kalman Filterto include 3D position error (δX), velocity error (δV ), clockbias (Tb) and clock drift error (δTd) as in (5).
Z(t) =
δX(t)δV(t)Tb,(t)
δTd,(t)
(5)
By incorporating the position and velocity errors as states inthe Kalman Filter, we account for the accumulated errors inthe pre-determined true position due to antenna misalignments,earth rotation etc. Since the position, velocity and timingequations are coupled, the errors in position and velocityproject to clock domain and thereby limit the timing accuracyobtained. Based on the prior position information of the GPSreceiver, we correct the output obtained from the KalmanFilter. Th output which in-turn is given as input to the PMU.
Fig. 3: Architecture of PIAVT. By assisting the trackingloop with the known location, the GPS receiver increases itsrobustness against interference.
Based on the state transition matrix of the Kalman Filter,we can estimate the predicted state vector for the next (t+1)th
time epoch. Thereafter, this is used to create a closed feedbackloop wherein the predicted signal replica for the next timeepoch is generated. As a result, the information is sharedbetween the satellite channels and thereby used to aid thechannels with weak SNR.
C. AlgorithmThe process for the PIAVT algorithm can be broken down
into four main blocks which are as follows:1) Error estimation using discriminators2) Kalman Filtering based measurement update3) Position-Information-Aiding (PIA)4) Kalman Filtering based time update5) Generation of the satellite signal replica
1) Error estimation using discriminators:
The Numerically Controlled Oscillators (NCO) generatesearly, prompt, and late replicas which are used to createcorrelations with the incoming signals. We will denote the in-phase early, prompt, and late correlations as IE , IP, and IL.Similarly, quadrature correlations will be denoted as QE , QP,and QL. Given the low dynamic nature of the power grid, weopt for carrier frequency and code phase discriminators that arewell suited for low SNR (case of interference or jamming).
The code phase discriminator known as the non-coherentearly minus late is given by:
ecode,(t) =12
E−LE +L
(6)
where E =√
I2E +Q2
E and L =√
I2L +Q2
L. This discriminatoris normalized by E +L to remove amplitude sensitivity.
We chose to use a normalized decision directed frequencydiscriminator as described in table 5.4 of [39]:
ecarr,(t) =cross× sign(dot)2π(∆t)(I2
t +Q2t )
, (7)
where cross = It−1Qt − ItQt−1 and dot = It−1It −Qt−1Qt .The error values obtained as outputs from the above dis-
criminators are then used to generate the Kalman Filter mea-surement matrix.
5
The discriminators output the code phase and carrier fre-quency errors which contain the corresponding LOS projec-tions of the discrepancies between the estimated position andvelocity and the known true position and velocity. By utilizingthe calculated LOS projections (los(i)
(t)), we rewrite Eq. (8)-(9)as functions of the clock bias and change in clock drift:
eicode,(t) = φ
i(t)−φ
i(t)
= Tb,(t)+δX(t) . losi(t)
(8)
eicarrier,(t) = f i
carrier,(t)− f icarrier,(t)
= ∆Td,(t)+δV(t) . losi(t)
(9)
where eicode,(t) and φ i
(t) are in m, and eicarrier,(t), and f i
carrier,(t)are in m/s.
2) Kalman Filtering based measurement update:
The Kalman Filter measurement update equations are definedas follows:
H(t) : Observation matrix, 2N×8
=
los1(t) 0 1 0
0 los1(t) 0 1
: : : :: : : :
losN(t) 0 1 0
0 losN(t) 0 1
e(t) : Measurement error vector
=
e1code,(t)
e1carrier,(t)
::
eNcode,(t)
eNcarrier,(t)
K(t) : Kalman gain matrix
= P(t)HT(t)(H(t)P(t)H
T(t)+R(t))
−1,
whereP(t) : Predicted state error covariance matrixR(t) : measurement noise covariance matrix.
(10)
∆Z(t) : State error vector= K(t)e(t)
Z(t) : Corrected state vector
= Z(t)+∆Z(t)
P(t) : Corrected state error covariance matrix
= (I−K(t)H(t))P(t)
(11)
Since the states of the Kalman filter were chosen to be errorof the position, velocity, clock bias, and clock drift, we can
then correct our predictions as:
X(t) = X(t)+δX(t)
= Xknown +δX(t)(12)
V(t) = V(t)+δV(t)
=Vknown +δV(t)(13)
3) Position-Information-Aiding:
Once the position and velocity predictions have been cor-rected by the Kalman Filter, we compare the corrected predic-tions with the known receiver position and velocity to estimatethe corrected signal parameters for the same time epoch usingEq. (14).
φicode,(t) = φ
icode,(t)+δX(t) . losi
(t)+Tb,(t)
f icode,(t) = f i
code,(t)
+(
Td,(t)+δV(t) . losi(t)
) fC/A
cf icarr,(t) = f i
carr,(t)
+(Td,(t)+δV(t) . losi(t))
fL1
c
(14)
The corrected predictions shown here are then output asour navigation solutions. Based on this, we can accuratelycalculate the clock bias of the receiver as a weighted average ofthe difference between the calculated pseudorange and actualrange [29]:
Tb,(t) =1
σNi=1ωi
N
∑i=1
ωi(ρ i−|Si−Xknown|), (15)
where ω i is the weighting term calculated by ω i =1
var(ε i), ε i
is the noise in the channel corresponding to (i)th satellite, andρ(i) is the calculated pseudorange between the user and the(i)th satellite. This corrected clock bias is obtained as theoverall output from PIAVT, which is then given as input tothe PMUs in power grid.
4) Kalman Filtering based time update:
We linearly propagate the clock parameters based on thefirst order state transition matrix to predict the receiver statesfor the next time epoch (t + 1). Given this, the time updateequations of the Kalman Filter are formulated as follows:
δ X(t+1)δV(t+1)Tb,(t+1)
δ Td,(t+1)
= F
δX(t)δV(t)Tb,(t)
δTd,(t)
(16)
6
The time update equations are as follows:
∆T : Update intervalF : State transition matrix, 8×8
=
0 0 0 ∆t 0 0 0 00 0 0 0 ∆t 0 0 00 0 0 0 0 ∆t 0 00 0 0 0 0 0 0 00 0 0 0 0 0 0 00 0 0 0 0 0 0 00 0 0 0 0 0 1 ∆t0 0 0 0 0 0 0 0
Q(t) : State process noise covariance matrix
Z(t+1) : Predicted state vector for the (t +1)th instant= FZ(t)
P(t+1) : Predicted state error covariance matrix
= FP(t)FT +Q(t)
(17)
These corrected values serve as a reference to predict the signalparameters using NCO for the next time epoch and therebyPIAVT loop continues.
5) Generation of satellite signal replica:
The function of NCO in our PIAVT is to generate thesignal replica based on four signal parameters. We observethat the carrier Doppler frequency and code phase are directlydependent on the geometry and relative motion of the satelliteswith respect to the GPS receiver. Therefore, these signalcharacteristics are predicted using the 3D satellite position andvelocity as well as the known position and velocity of the staticGPS receiver.
The ephemeris values are decoded from either the scalartracking results or obtained through external sources. Thepredicted position and velocity are given by the followingequations:
X(t+1) = Xknown
V(t+1) =Vknown = 0(18)
where (t+1)th denotes the time epoch for which the clock biasand clock drift parameters are being calculated. Also, Xknownand Vknown denotes the pre-determined 3D position and velocityof the static GPS receiver.
The signal parameters from the (t)th time epoch and thechange in the satellite position and velocity projections arecollectively used for the calculation of the predicted signal
parameters at the (t +1)th time epoch as in (19).
φicode,(t+1) = φ
icode,(t)+ c ∆t
+[(
Six,y,z,(t+1)−Si
x,y,z,(t)
)−∆t δV i
(t)
]Tlosi
(t)
f icode,(t+1) =
[1+Td,(t)+
(Si
x,y,z,(t)−δV i(t)
)Tlosi
(t)
]×
f icode,(t)
c
f icarr,(t+1) =
[1+Td,(t)+
(Si
x,y,z,(t)−δV i(t)
)Tlosi
(t)
]× fL1
cTd,(t+1) = Td,(t)+∆Td,(t),
(19)
where δV(t) is the velocity error and ∆t is the time interval forupdate.
From these estimated code phase and carrier Doppler fre-quency, signal replicas are generated and then correlated withthe incoming GPS signal.
D. InitializationAt a specific time epoch, the following are extracted from
the scalar tracking results and used to initialize the PIAVT:code phase, code frequency, carrier frequency, signal transmittime, clock bias, and clock drift. Since the PIAVT is looselydependent on these initial values, we choose to initialize ourtracking loop after the scalar loop has gained a strong fix onthe signal.
In PIAVT, bandwidth is controlled by Kalman Filter whichmakes it difficult to quote the exact bandwidth used to setthe adaptive Kalman filter gain (K), which is proportionalto the bandwidth. Thus, in this work, the bandwidth was setempirically by controlling the Kalman filter Q and R matriceswhich represent the uncertainty in the dynamics of the user andthe noise in the discriminator outputs. Q and R are defined as:
Q = diag(σ2x ,σ
2y ,σ
2z ,σ
2vx σ
2vy ,σ
2vz ,σ
2tb)
R = diag(σ2code,1,σ
2carrier,1, ...,σ
2code,n,σ
2carrier,n),
where, σ2 is the covariance of the process noise, σ2code and
σ2carrier are the covariances of the noise for code and carrier
measurements, respectively.To compare the scalar and PIAVT results, the tracking
loop bandwidths should be relatively similar. Therefore, weempirically adjusted the Q and R matrices such that the basicvector tracking loop’s performance closely matched that of thescalar tracking with 5 Hz loop bandwidths, due to the receiverbeing static, and then used these Q and R values as constantsthroughout our PIAVT.
III. GPS EXPERIMENTS
In order to compare the performance of PIAVT with thatof traditional tracking, we conducted field tests using anoff-the-shelf GPS receiver. We collected raw GPS signals
7
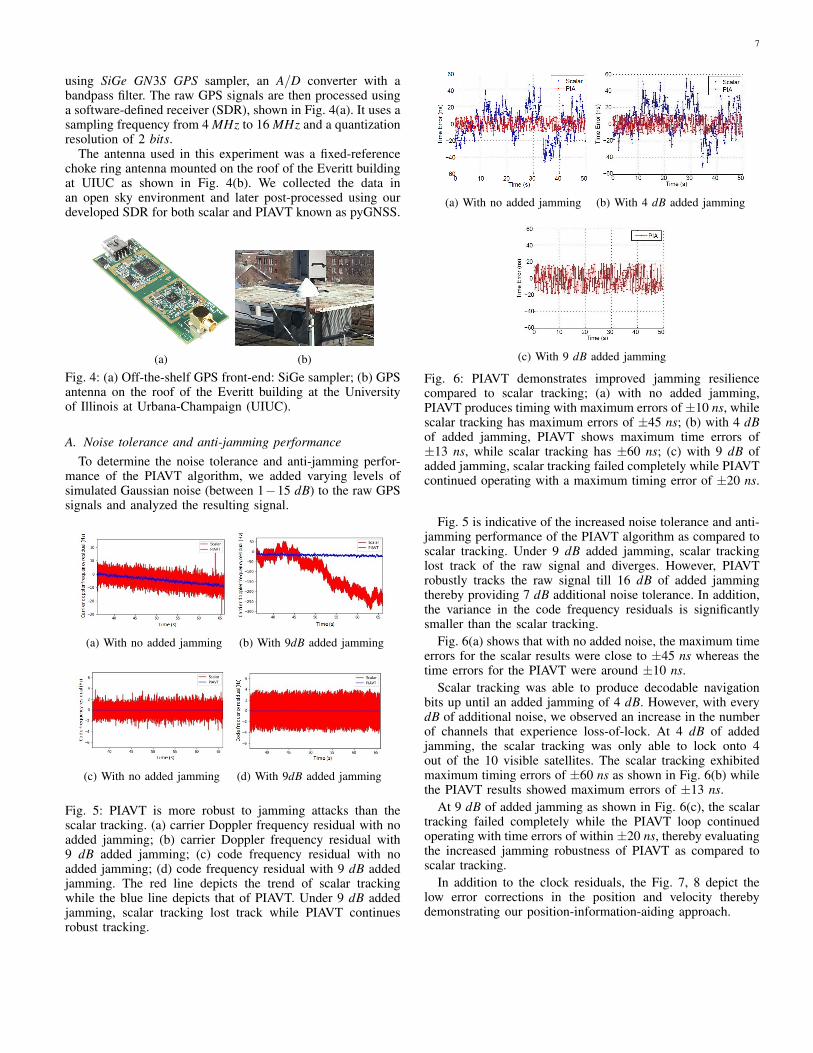
using SiGe GN3S GPS sampler, an A/D converter with abandpass filter. The raw GPS signals are then processed usinga software-defined receiver (SDR), shown in Fig. 4(a). It uses asampling frequency from 4 MHz to 16 MHz and a quantizationresolution of 2 bits.
The antenna used in this experiment was a fixed-referencechoke ring antenna mounted on the roof of the Everitt buildingat UIUC as shown in Fig. 4(b). We collected the data inan open sky environment and later post-processed using ourdeveloped SDR for both scalar and PIAVT known as pyGNSS.
(a) (b)
Fig. 4: (a) Off-the-shelf GPS front-end: SiGe sampler; (b) GPSantenna on the roof of the Everitt building at the Universityof Illinois at Urbana-Champaign (UIUC).
A. Noise tolerance and anti-jamming performanceTo determine the noise tolerance and anti-jamming perfor-
mance of the PIAVT algorithm, we added varying levels ofsimulated Gaussian noise (between 1−15 dB) to the raw GPSsignals and analyzed the resulting signal.
(a) With no added jamming (b) With 9dB added jamming
(c) With no added jamming (d) With 9dB added jamming
Fig. 5: PIAVT is more robust to jamming attacks than thescalar tracking. (a) carrier Doppler frequency residual with noadded jamming; (b) carrier Doppler frequency residual with9 dB added jamming; (c) code frequency residual with noadded jamming; (d) code frequency residual with 9 dB addedjamming. The red line depicts the trend of scalar trackingwhile the blue line depicts that of PIAVT. Under 9 dB addedjamming, scalar tracking lost track while PIAVT continuesrobust tracking.
(a) With no added jamming (b) With 4 dB added jamming
(c) With 9 dB added jamming
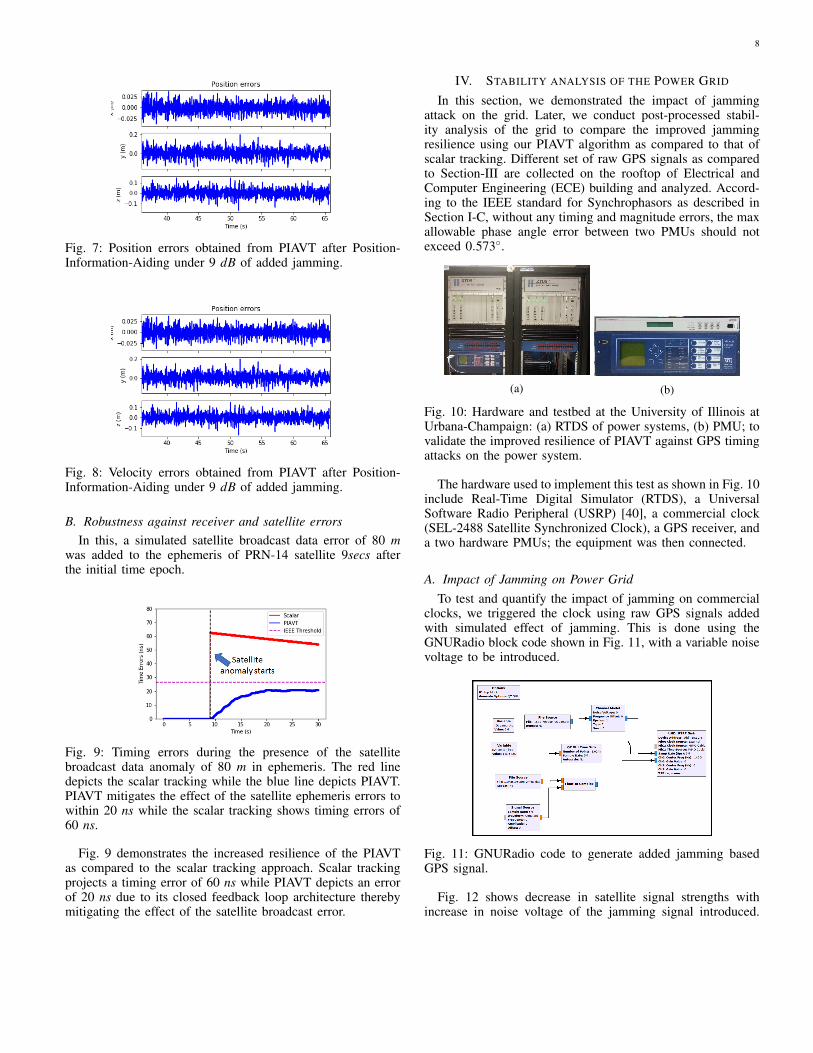
Fig. 6: PIAVT demonstrates improved jamming resiliencecompared to scalar tracking; (a) with no added jamming,PIAVT produces timing with maximum errors of ±10 ns, whilescalar tracking has maximum errors of ±45 ns; (b) with 4 dBof added jamming, PIAVT shows maximum time errors of±13 ns, while scalar tracking has ±60 ns; (c) with 9 dB ofadded jamming, scalar tracking failed completely while PIAVTcontinued operating with a maximum timing error of ±20 ns.
Fig. 5 is indicative of the increased noise tolerance and anti-jamming performance of the PIAVT algorithm as compared toscalar tracking. Under 9 dB added jamming, scalar trackinglost track of the raw signal and diverges. However, PIAVTrobustly tracks the raw signal till 16 dB of added jammingthereby providing 7 dB additional noise tolerance. In addition,the variance in the code frequency residuals is significantlysmaller than the scalar tracking.
Fig. 6(a) shows that with no added noise, the maximum timeerrors for the scalar results were close to ±45 ns whereas thetime errors for the PIAVT were around ±10 ns.
Scalar tracking was able to produce decodable navigationbits up until an added jamming of 4 dB. However, with everydB of additional noise, we observed an increase in the numberof channels that experience loss-of-lock. At 4 dB of addedjamming, the scalar tracking was only able to lock onto 4out of the 10 visible satellites. The scalar tracking exhibitedmaximum timing errors of ±60 ns as shown in Fig. 6(b) whilethe PIAVT results showed maximum errors of ±13 ns.
At 9 dB of added jamming as shown in Fig. 6(c), the scalartracking failed completely while the PIAVT loop continuedoperating with time errors of within ±20 ns, thereby evaluatingthe increased jamming robustness of PIAVT as compared toscalar tracking.
In addition to the clock residuals, the Fig. 7, 8 depict thelow error corrections in the position and velocity therebydemonstrating our position-information-aiding approach.
8
Fig. 7: Position errors obtained from PIAVT after Position-Information-Aiding under 9 dB of added jamming.
Fig. 8: Velocity errors obtained from PIAVT after Position-Information-Aiding under 9 dB of added jamming.
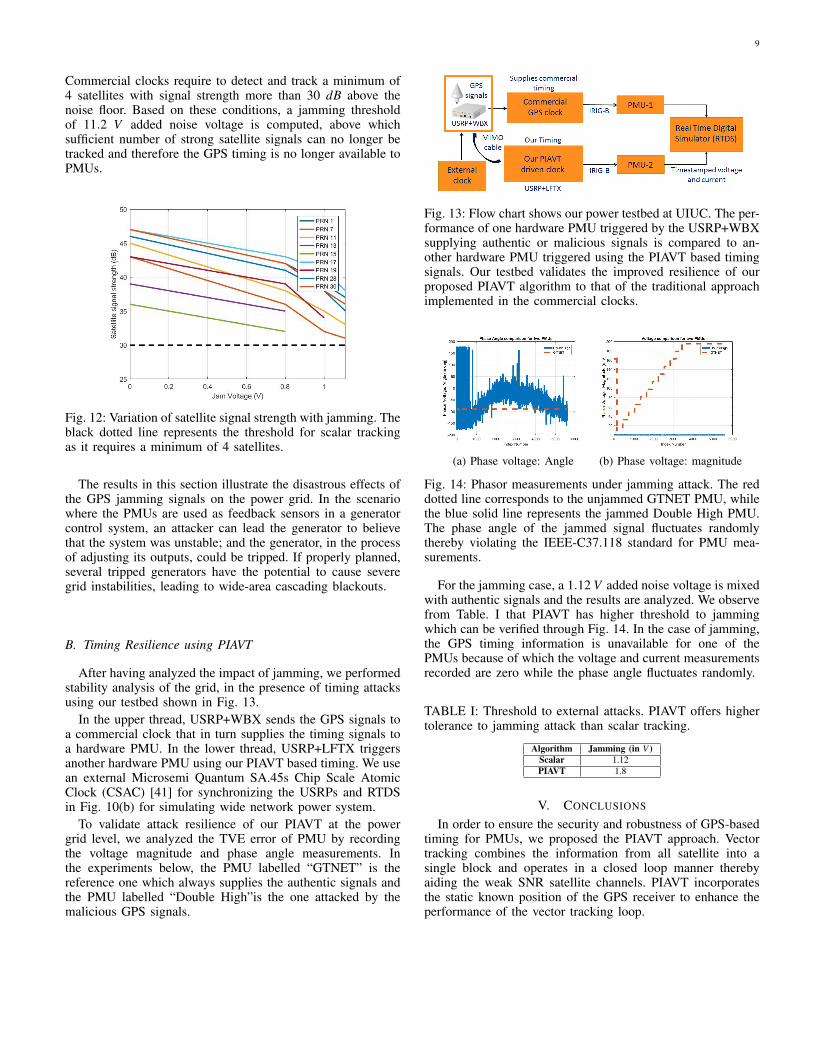
B. Robustness against receiver and satellite errorsIn this, a simulated satellite broadcast data error of 80 m
was added to the ephemeris of PRN-14 satellite 9secs afterthe initial time epoch.
Fig. 9: Timing errors during the presence of the satellitebroadcast data anomaly of 80 m in ephemeris. The red linedepicts the scalar tracking while the blue line depicts PIAVT.PIAVT mitigates the effect of the satellite ephemeris errors towithin 20 ns while the scalar tracking shows timing errors of60 ns.
Fig. 9 demonstrates the increased resilience of the PIAVTas compared to the scalar tracking approach. Scalar trackingprojects a timing error of 60 ns while PIAVT depicts an errorof 20 ns due to its closed feedback loop architecture therebymitigating the effect of the satellite broadcast error.
IV. STABILITY ANALYSIS OF THE POWER GRID
In this section, we demonstrated the impact of jammingattack on the grid. Later, we conduct post-processed stabil-ity analysis of the grid to compare the improved jammingresilience using our PIAVT algorithm as compared to that ofscalar tracking. Different set of raw GPS signals as comparedto Section-III are collected on the rooftop of Electrical andComputer Engineering (ECE) building and analyzed. Accord-ing to the IEEE standard for Synchrophasors as described inSection I-C, without any timing and magnitude errors, the maxallowable phase angle error between two PMUs should notexceed 0.573◦.
(a) (b)
Fig. 10: Hardware and testbed at the University of Illinois atUrbana-Champaign: (a) RTDS of power systems, (b) PMU; tovalidate the improved resilience of PIAVT against GPS timingattacks on the power system.
The hardware used to implement this test as shown in Fig. 10include Real-Time Digital Simulator (RTDS), a UniversalSoftware Radio Peripheral (USRP) [40], a commercial clock(SEL-2488 Satellite Synchronized Clock), a GPS receiver, anda two hardware PMUs; the equipment was then connected.
A. Impact of Jamming on Power GridTo test and quantify the impact of jamming on commercial
clocks, we triggered the clock using raw GPS signals addedwith simulated effect of jamming. This is done using theGNURadio block code shown in Fig. 11, with a variable noisevoltage to be introduced.
Fig. 11: GNURadio code to generate added jamming basedGPS signal.
Fig. 12 shows decrease in satellite signal strengths withincrease in noise voltage of the jamming signal introduced.
9
Commercial clocks require to detect and track a minimum of4 satellites with signal strength more than 30 dB above thenoise floor. Based on these conditions, a jamming thresholdof 11.2 V added noise voltage is computed, above whichsufficient number of strong satellite signals can no longer betracked and therefore the GPS timing is no longer available toPMUs.
Fig. 12: Variation of satellite signal strength with jamming. Theblack dotted line represents the threshold for scalar trackingas it requires a minimum of 4 satellites.
The results in this section illustrate the disastrous effects ofthe GPS jamming signals on the power grid. In the scenariowhere the PMUs are used as feedback sensors in a generatorcontrol system, an attacker can lead the generator to believethat the system was unstable; and the generator, in the processof adjusting its outputs, could be tripped. If properly planned,several tripped generators have the potential to cause severegrid instabilities, leading to wide-area cascading blackouts.
B. Timing Resilience using PIAVT
After having analyzed the impact of jamming, we performedstability analysis of the grid, in the presence of timing attacksusing our testbed shown in Fig. 13.
In the upper thread, USRP+WBX sends the GPS signals toa commercial clock that in turn supplies the timing signals toa hardware PMU. In the lower thread, USRP+LFTX triggersanother hardware PMU using our PIAVT based timing. We usean external Microsemi Quantum SA.45s Chip Scale AtomicClock (CSAC) [41] for synchronizing the USRPs and RTDSin Fig. 10(b) for simulating wide network power system.
To validate attack resilience of our PIAVT at the powergrid level, we analyzed the TVE error of PMU by recordingthe voltage magnitude and phase angle measurements. Inthe experiments below, the PMU labelled “GTNET” is thereference one which always supplies the authentic signals andthe PMU labelled “Double High”is the one attacked by themalicious GPS signals.
Fig. 13: Flow chart shows our power testbed at UIUC. The per-formance of one hardware PMU triggered by the USRP+WBXsupplying authentic or malicious signals is compared to an-other hardware PMU triggered using the PIAVT based timingsignals. Our testbed validates the improved resilience of ourproposed PIAVT algorithm to that of the traditional approachimplemented in the commercial clocks.
(a) Phase voltage: Angle (b) Phase voltage: magnitude
Fig. 14: Phasor measurements under jamming attack. The reddotted line corresponds to the unjammed GTNET PMU, whilethe blue solid line represents the jammed Double High PMU.The phase angle of the jammed signal fluctuates randomlythereby violating the IEEE-C37.118 standard for PMU mea-surements.
For the jamming case, a 1.12 V added noise voltage is mixedwith authentic signals and the results are analyzed. We observefrom Table. I that PIAVT has higher threshold to jammingwhich can be verified through Fig. 14. In the case of jamming,the GPS timing information is unavailable for one of thePMUs because of which the voltage and current measurementsrecorded are zero while the phase angle fluctuates randomly.
TABLE I: Threshold to external attacks. PIAVT offers highertolerance to jamming attack than scalar tracking.
Algorithm Jamming (in V )Scalar 1.12PIAVT 1.8
V. CONCLUSIONS
In order to ensure the security and robustness of GPS-basedtiming for PMUs, we proposed the PIAVT approach. Vectortracking combines the information from all satellite into asingle block and operates in a closed loop manner therebyaiding the weak SNR satellite channels. PIAVT incorporatesthe static known position of the GPS receiver to enhance theperformance of the vector tracking loop.
10
Our PIAVT allows continued operation in the presence of9 dB of added jamming while complying with the IEEE-C37.118 standard for PMU measurements. We designed apower grid testbed using RTDS, USRP, PMU and a com-mercial GPS clock to showcase the impact of external timingattacks. Later, by incorporating emulated timing attacks to theGPS signals collected, we validated the improved jammingresilience of our PIAVT approach in maintaining the powergrid stability.
ACKNOWLEDGMENT
I would also like to thank Cyber Resilient Energy DeliveryConsortium (CREDC) team members at University of Illinois:Alfonso Valdes, Prosper Panumpabi, Jeremy Jones, DavidEmmerich for helping me in setting up the power grid testbedand also in collecting and analyzing the data.
This material is based upon work supported by the Depart-ment of Energy under Award Number DE-OE0000780.
This report was prepared as an account of work sponsoredby an agency of the United States Government. Neither theUnited States Government nor any agency thereof, nor any oftheir employees, makes any warranty, express or implied, orassumes any legal liability or responsibility for the accuracy,completeness, or usefulness of any information, apparatus,product, or process disclosed, or represents that its use wouldnot infringe privately owned rights. Reference herein to anyspecific commercial product, process, or service by tradename, trademark, manufacturer, or otherwise does not neces-sarily constitute or imply its endorsement, recommendation,or favoring by the United States Government or any agencythereof. The views and opinions of authors expressed hereindo not necessarily state or reflect those of the United StatesGovernment or any agency thereof.
REFERENCES
[1] Office of the Press Secretary, ”Presidential policy directive-critical infrastructure security and resilience,” https://www.whitehouse.gov/thepress-office/2013/02/12/presidential-policy-directive-criticalinfrastructure-security-and-resil, 2012.
[2] P. Kundur, N. J. Balu, and M. G. Lauby, “Power system stabilityand control,” McGraw-hill New York, 1994, vol. 7.
[3] D. Hart, ”Use of SCADA data for failure detection in windturbines,” in IEEE Power and Energy Society General Meeting-Conversion and Delivery of Electrical Energy in the 21st Cen-tury, July 2008.
[4] H. Bentarzi, ”Improving monitoring, control and protection ofpower grid using wide area synchro-phasor measurements,” inProceedings of the 12th WSEAS international conference onAutomatic control, modelling and simulation. World Scientificand Engineering Academy and Society (WSEAS), 2010, pp.93-98.
[5] A. G. Phadke and J. S. Thorp, “Synchronized phasor measure-ments and their applications,” Springer Science and BusinessMedia, 2008.
[6] M. Patel, S. Aivaliotis, E. Ellen et al., “Real-time applicationof synchrophasors for improving reliability,” NERC Report,October 2010.
[7] United States Energy Information Administration, “Today inenergy,” http://www.eia.gov/todayinenergy/detail. cfm?id=5630,March 2012.
[8] A. Silverstein, ”An update on synchrophasor tech across Amer-ica,” Intelligent Utility Magazine, November 2014.
[9] D. Shi, D. J. Tylavsky, K. M. Koellner, N. Logic, “An Adap-tive Method for Detection and Correction of Errors in PMUMeasurements,” Ieee Trans. on Smart Grid, vol. 3, no. 4, pp.1575-1583, Dec. 2012.
[10] P. Shepard, T. E. Humphreys, and A. A. Fansler, ”Evaluation ofthe vulnerability of phasor measurement units to GPS spoofingattacks,” International Journal of Critical Infrastructure Protec-tion, vol. 5, no. 3, pp. 146-153, 2012.
[11] L. Heng, J. J. Makela, A. D. Dominguez-Garcia, R. B. Bobba,W. H. Sanders, and G. X. Gao, ”Reliable GPS-based timing forpower systems: A multi-layered multi-receiver architecture,” inPower and Energy Conference at Illinois (PECI), 2014. IEEE,2014, pp. 1-7.
[12] G. Wing, Interface Specification IS-GPS-200E, June 2010.[13] Misra and P. Enge, “Global Positioning System: Signals, Mea-
surements and Performance,” Second Edition. Lincoln, MA:Ganga-Jamuna Press, 2006.
[14] B. W. Parkinson and J. J. Spilker, “Progress In Astronautics andAeronautics: Global Positioning System: Theory and Applica-tions,” AIAA, 1996.
[15] A. Dierendonck, P. Fenton, and T. Ford, “Theory and per-formance of narrow correlator spacing in a GPS receiver,”Navigation, vol. 39, no. 3, pp. 265-283, 1992.
[16] M. Lashley, D. M. Bevly, and J. Y. Hung, “Performance analysisof vector tracking algorithms for weak GPS signals in highdynamics,” Selected Topics in Signal Processing, IEEE Journalof, vol. 3, no. 4, pp. 661-673, 2009.
[17] S. Zhao and D. Akos, “An open source GPS/GNSS vectortracking loop-implementation, filter tuning, and results,” inProceedings of the 2011 International Technical Meeting of TheInstitute of Navigation, January 2011, pp. 1293-1305.
[18] Z. Sun, X. Wang, S. Feng, H. Che, J. Zhang, “Design ofan adaptive GPS vector tracking loop with the detection andisolation of contaminated channels,” GPS Solutions (2017) 21:701. doi:10.1007/s10291-016-0558-5.
[19] “IEEE Standard for Synchrophasors for Power Systems,” IEEEStd C37.118-2005 (Revision of IEEE Std 1344-1995) , vol., no.,pp.0 1-57, 2006.
[20] K.E Martin, D.Hamai, M.G Adamiak, S. Anderson, M. Begovic,G. Benmouyal, G. Brunello, J. Burger, J. Y. Cai, B. Dickerson,V. Ghapure, B. Kennedy, D. Karlsson, A.G. Phadke, J. Salj,V. Skendizic, J. Sperr, Y. Song, C. Huntley, B. Kastennyand E. Price, “Exploring the IEEE Standard C37.118-2005Synchrophasors for Power Systems,” IEEE Trans. on PowerDel.,Vol. 23, no. 4, pp 1805-1811, Oct, 2008.
[21] M. Lixia, C. Muscas, and S. Sulis, “On the accuracy specifi-cations of phasor measurement units,” in Proc. IEEE I2MTC,May 2010, pp. 14351440.
[22] N. D. Pham, “The economic benefits of commercial GPS use inthe US and the costs of potential disruption,” NDP Consulting,Tech. Rep., June 2011.
[23] GPS.gov, “GPS spectrum and interference issues,” http://www.gps.gov/spectrum/, March 2012.
[24] Federal Communications Commission, “Deere submission:Light- Squared Interference to GPS and StarFire,” May 2011.
[25] C. H. Kang, S. Y. Kim, C. G. Park, “A GNSS interferenceidentification using an adaptive cascading IIR notch filter,” GPSSolut (2014) 18: 605. doi:10.1007/s10291-013-0358-0.
[26] R. B. Langley, “GPS, the Ionosphere, and the Solar Maximum,”GPS World, vol. 11, no. 7, pp. 44-49, 2000.
11
[27] G. X. Gao, H. Denks, A. Steingassnd, M. Meurer, T. Walter,and P. Enge, “DME Interference Mitigation Based on FlightTest Data Over European Hot Spot,” GPS Solutions, vol. 17,issue 1, January 2013.
[28] J. Warburton and C. Tedeschi, “GPS Privacy Jammers and RFIat Newark: Navigation Team AJP-Results,” in 12th InternationalGBAS Working Group Meeting (I-GWG-12), Atlantic City,New Jersey, November 2011.
[29] C. Tedeschi, “The Newark Liberty International Airport (EWR)GBAS Experience,” in 12th International GBAS Working GroupMeeting (IGWG-12), Atlantic City, New Jersey, November2011.
[30] A. Pinker, C. Smith, “Vulnerability of the GPS Signal to Jam-ming,” GPS Solutions (1999) 3: 19. doi:10.1007/PL00012788.
[31] X. Jiang, J. Zhang, B. J. Harding, J. J. Makela, and A. D.Dominguez-Garcia, “Spoofing GPS receiver clock offset of pha-sor measurement units,” IEEE Transactions on Power Systems,vol. 28, no. 3, p. 3253-3262, 2013.
[32] J. S. Warner and R. G. Johnston, “A simple demonstration thatthe Global Positioning System (GPS) is vulnerable to spoofing,”Journal of Security Administration, vol. 25, no. 2, pp. 19-27,2002.
[33] G. X. Gao, H. Tang, J. Blanch, J. Lee, T. Walter and P.Enge, “Methodology and Case Studies of Signal-in-Space ErrorCalculation Top-down Meets Bottom-up,” ION Global Navi-gation Satellite Systems Conference 2009, Savannah, Georgia,September 2009.
[34] L. Heng, G. X. Gao, T. Walter and P. Enge, “GPS Signal-in-Space Performance Evolution: Data Mining 400 Million Navi-gation Messages of the Last Decade from a Global Network of360 receivers,” IEEE Transactions on Aerospace and ElectronicSystems, vol. 48, no. 4, October 2012.
[35] Y. Fan, Z. Zhang, M. Trinkle, A. D. Dimitrovski, J.B. Song, H.Li, “A Cross-Layer Defense Mechanism Against GPS SpoofingAttacks on PMUs in Smart Grids,” IEEE Trans. Smart Grid2015, 6, 26592668.
[36] Z. Zhang, S. Gong, A. Dimitrovski and H. Li, “Time syn-chronization attack in smart grid: impact and analysis,” IEEETransactions on Smart Grid, vol. 4, no. 1, pp. 87-98, Mar. 2013.
[37] M. T. Gamba, M. D. Truong, B. Motella, E. Falletti, T. H.Ta, “Hypothesis testing methods to detect spoofing attacks: Atest against the TEXBAT datasets,” GPS Solutions; Springer:Berlin/Heidelberg, Germany, 2016; pp. 113.
[38] D. Chou, L. Heng, and G. X. Gao, “Robust GPS-Based Timingfor Phasor Measurement Units: A Position-Information-AidedVector Tracking Approach,” in Proceedings of the ION GNSS+conference, Tampa, 2014.
[39] E. D. Kaplan and C. J. Hegarty, “Understanding GPS: Principlesand Applications,” 2nd ed. Artech House Inc, MA, 2006.
[40] ”Ettus Research”, [Online]. Available: ”https://www.ettus.com/content/files/
[41] “Microsemi”, [Online]. Available: https://www.microsemi.com/document-portal/docview/133305-quantum-sa-45s-csac
Sriramya Bhamidipati is a graduate student underProf. Grace Gao in the Department of AerospaceEngineering at the University of Illinois at Urbana-Champaign. She received her M.S degree inAerospace Engineering from University of Illinoisat Urbana-Champaign in 2017. She received herB.Tech. with honors in Aerospace Engineering andminor in Systems and Controls Engineering fromIndian Institute of Technology Bombay, India in2015. Her research interests include GPS, power andcontrol systems, computer vision and UAVs.
Grace Xingxin Gao received the B.S. degree inmechanical engineering and the M.S. degree in elec-trical engineering from Tsinghua University, Bei-jing, China in 2001 and 2003. She received thePhD degree in electrical engineering from StanfordUniversity in 2008. From 2008 to 2012, she was aresearch associate at Stanford University. Since 2012,she has been with University of Illinois at Urbana-Champaign, where she is presently an assistant pro-fessor in the Aerospace Engineering Department.


![[07] Ept 2008 - Impact of GPS Jamming on the Safety of Navigation](https://img.pdfslide.us/doc/110x75/577d37d81a28ab3a6b968568/07-ept-2008-impact-of-gps-jamming-on-the-safety-of-navigation.jpg)