Embed Size (px)
Citation preview
Non paper on complementary economic modelling undertaken by DG ENER regarding different energy policy scenarios including updated renewable energy technology costs in the context of Council and Parliament discussions of the recast of the renewable energy directive and the revision of the energy efficiency directive
Detailed modelling analysis
This non-paper contains the results of an update of the modelling analysis performed by the European Commission in 2016, for the Impact Assessments underpinning the Clean Energy for all Europeans package.
This update encompasses: i/ a revision of assumptions on renewable energy technology costs (for onshore wind, offshore wind, solar PV and solar thermal); and ii/ the impacts of higher RES targets (30%, 33%, 35%, 45%, with efforts taken across all sectors, electricity, heating & cooling and transport) coupled with the energy efficiency targets of 30%, 33%, 35% and 40%.
1. Impacts of lower renewable energy technology costs on reaching a 27% renewable energy target
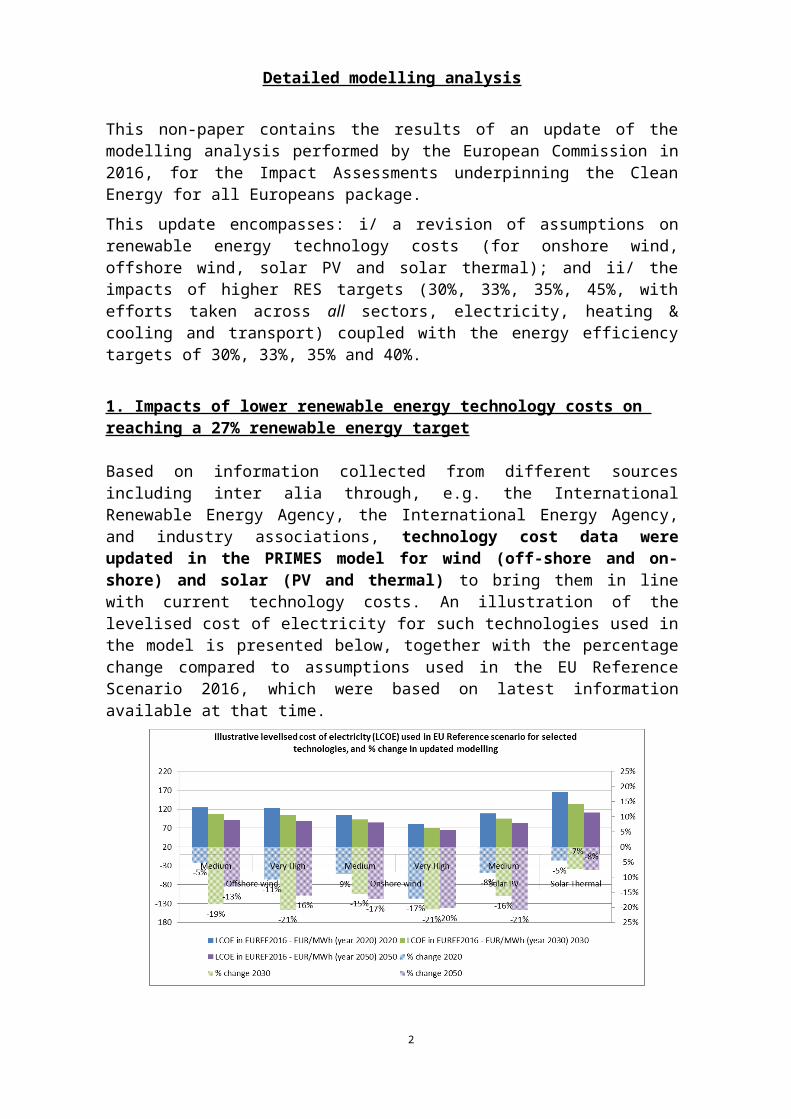
Based on information collected from different sources including inter alia through, e.g. the International Renewable Energy Agency, the International Energy Agency, and industry associations, technology cost data were updated in the PRIMES model for wind (off-shore and on-shore) and solar (PV and thermal) to bring them in line with current technology costs. An illustration of the levelised cost of electricity for such technologies used in the model is presented below, together with the percentage change compared to assumptions used in the EU Reference Scenario 2016, which were based on latest information available at that time.
The levelised cost of electricity (LCOE) for offshore wind in medium potential areas1 in 2020 is now €125/MWh, 5% lower than estimated in the 2016 Reference Scenario. The same technology in 2030 has an estimated cost of €108/MWh, 19% lower than previously estimated. And by 2050, the estimated cost would be €91/MWh, 13% lower than previously estimated.
Lower technology costs make the achievement of a 27% RES target by 2030 (coupled with 40% GHG emission reductions and 30% energy efficiency) cheaper by 2.9 billion EUR per year in the period 2021-30 and by 6.9 billion EUR per year for the period 2021-2050.
1 "Medium" and "Very high" in the chart refer to the wind resource; higher resource often but not necessarily translates into lower LCOE because exploiting them also requires higher investments (e.g. turbines need to be larger).
2
This is achieved via greater offshore wind and solar power deployment that benefit from lower technology costs in this exercise, while onshore wind and biomass power generation capacity is decreased for the same overall RES deployment level.
Such lower costs for the energy system are explained by lower investment needs for the same renewable electricity capacity. Overall, total investment savings in all power generation amount to 14 billion EUR over the period 2021-2030. Instead of investing 394 billion EUR over the 2021-2030 period, only 380 billion EUR is necessary to reach a similar renewable energy target.
This, in turn, translates into renewable energy support costs passed on to final electricity consumers and electricity prices that are lower by respectively 4% and 0.5%.
2. Impacts of higher renewable energy targets
(a) Evolution of renewable energy across sectors
The higher renewable targets are achieved by efforts spread across all sectors (power, heating & cooling and transport).
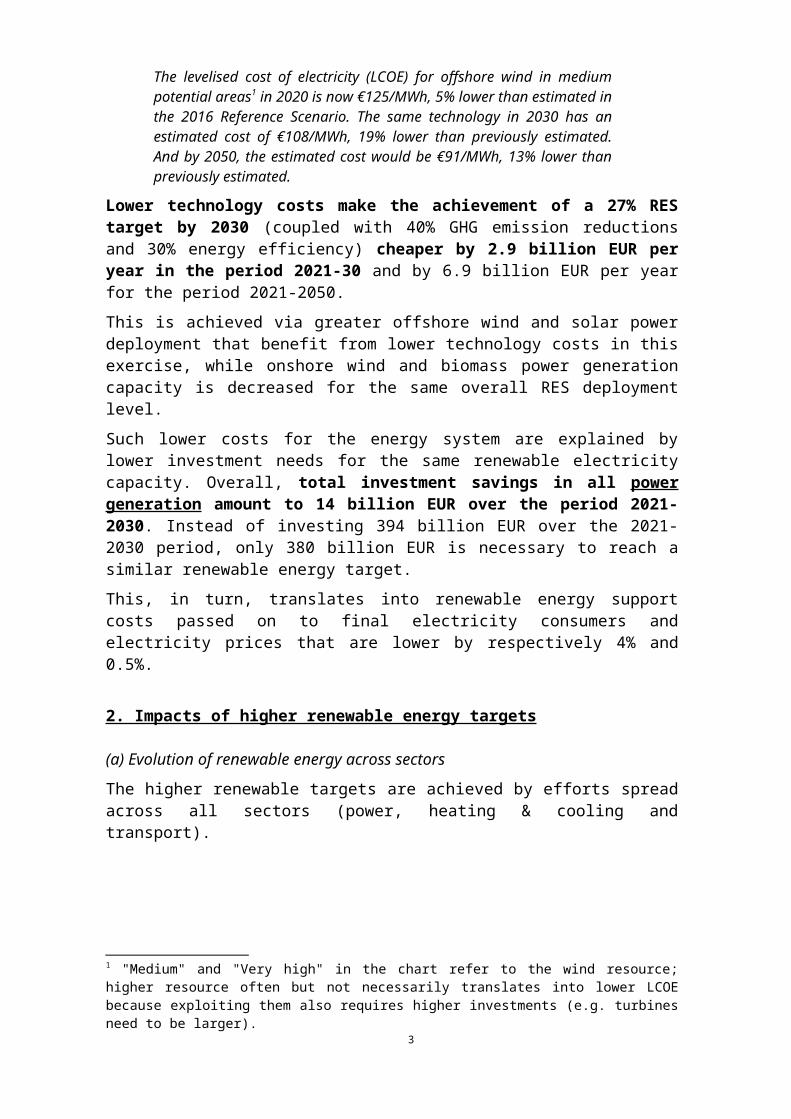
In power generation, additional investments in renewable energy technologies are projected in scenarios with higher targets, leading to an increase in the use of wind (both onshore and offshore), and to a lesser extent solar, in the electricity mix. The biomass share is stable across the scenarios (until 35%RES/35%EE). Nevertheless, the biomass share increases in the 45%/40% scenario, most likely leading to sharp increases in import needs.
3
In the residential sector, heat pumps deployment is a key contributor to combined renewable energy and energy efficiency efforts. Renewable energy produced by heat pumps for heating & cooling significantly increases compared to a scenario with 27% RES with the level of ambition: from +13% in a scenario with 30% RES/30% EE to +122% in a scenario with 45% RES/40% EE. In addition, biomass used in heating (especially in CHP district heating) increases its penetration.
On the transport side, consumption of biofuels overall slightly increases with higher targets scenarios. More importantly, a shift takes place between food-based biofuels and advanced biofuels, from the 30% RES/30% EE scenario onward. Both the overall renewable energies in transport mandate (6.8% by 2030 in the RES Directive proposal) and the specific mandate for advanced biofuels (3.6% by 2030 in the proposal), are met at the EU28 level2. Conversely, the share of food-based biofuels decreases below the proposed cap of 3.8%, to 2.4%. Transport electrification (number of electric vehicles) slightly increases with the level of ambition as well, with the share of electric vehicles in the total fleet of light-duty vehicles increasing.
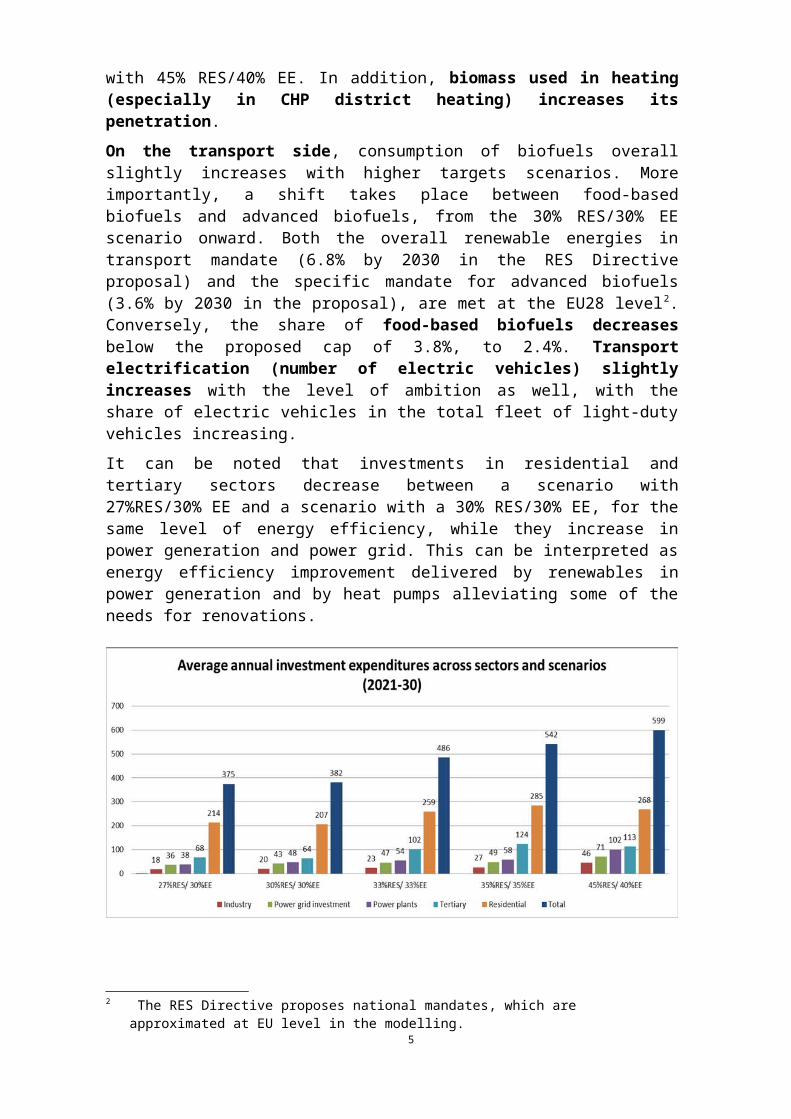
It can be noted that investments in residential and tertiary sectors decrease between a scenario with 27%RES/30% EE and a scenario with a 30% RES/30% EE, for the same level of energy efficiency, while they increase in power generation and power grid. This can be interpreted as energy efficiency improvement delivered by renewables in power generation and by heat pumps alleviating some of the needs for renovations.
2 The RES Directive proposes national mandates, which are approximated at EU level in the modelling.4
(b) Impacts on energy system costsLower RES technology costs, and a different deployment path of renewable technologies allow reaching a 30% RES and 30% EE target at system costs comparable (1.6 billion EUR higher per year which translates to an increase in 0.1% of the total system costs expenditure) with those estimated in the 2016 Impact Assessment for a 27% target, while generating additional benefits in terms of GHG emissions and security of supply. The cost is actually €3.5bn lower per year when looking over 2021-2050.
More specifically, although investment needs in power generation are projected to increase compared to a scenario with only 27% renewable energy, this increase is somehow balanced by lower technology costs per unit of investment. In addition, the need for public support to promote such investments is also lower. As such, electricity prices remain stable compared to what was estimated in the 2016 Impact Assessment for a 27% renewable energy target, which avoids negative consequences for final electricity users. Costs also decrease in the industrial sector, notably because the ETS carbon price projected is slightly lower. In the residential sector, additional renewable energy technologies options, notably the use of heat pumps, also contribute to limiting the increase in costs.
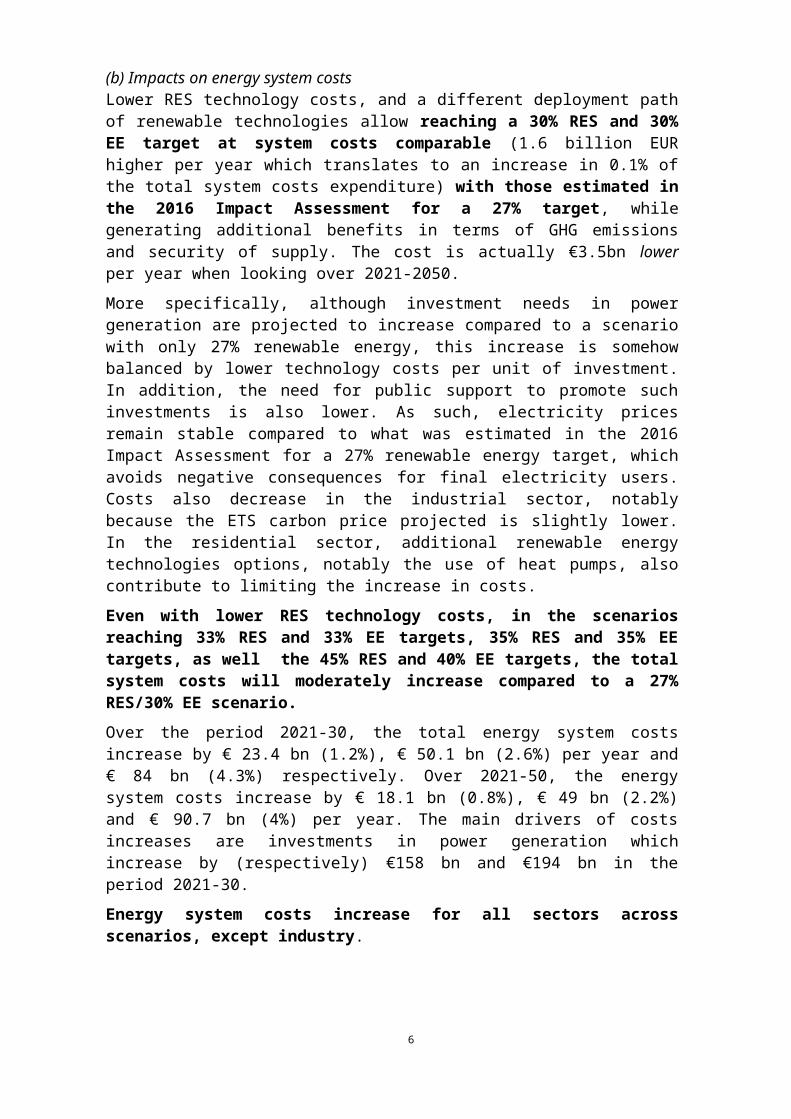
Even with lower RES technology costs, in the scenarios reaching 33% RES and 33% EE targets, 35% RES and 35% EE targets, as well the 45% RES and 40% EE targets, the total system costs will moderately increase compared to a 27% RES/30% EE scenario.
Over the period 2021-30, the total energy system costs increase by € 23.4 bn (1.2%), € 50.1 bn (2.6%) per year and € 84 bn (4.3%) respectively. Over 2021-50, the energy system costs increase by € 18.1 bn (0.8%), € 49 bn (2.2%) and € 90.7 bn (4%) per year. The main drivers of costs increases are investments in power generation which increase by (respectively) €158 bn and €194 bn in the period 2021-30.
Energy system costs increase for all sectors across scenarios, except industry.
5
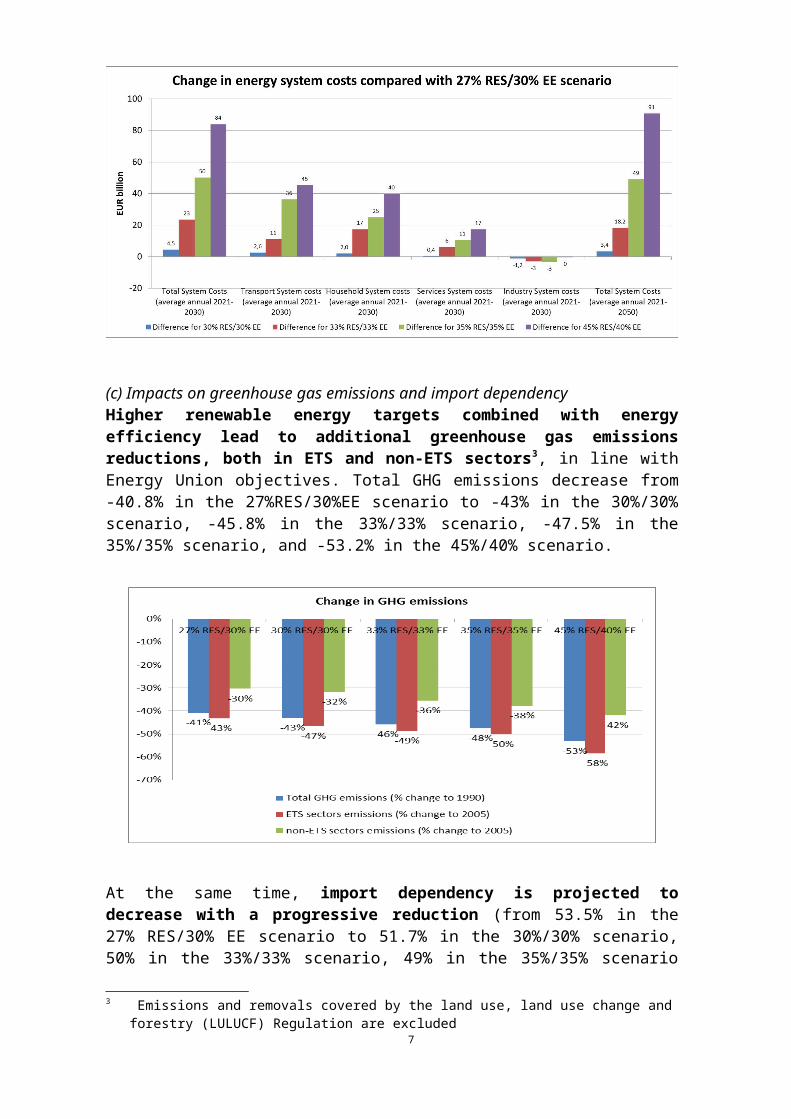
(c) Impacts on greenhouse gas emissions and import dependencyHigher renewable energy targets combined with energy efficiency lead to additional greenhouse gas emissions reductions, both in ETS and non-ETS sectors3, in line with Energy Union objectives. Total GHG emissions decrease from -40.8% in the 27%RES/30%EE scenario to -43% in the 30%/30% scenario, -45.8% in the 33%/33% scenario, -47.5% in the 35%/35% scenario, and -53.2% in the 45%/40% scenario.
At the same time, import dependency is projected to decrease with a progressive reduction (from 53.5% in the 27% RES/30% EE scenario to 51.7% in the 30%/30% scenario, 50% in the 33%/33% scenario, 49% in the 35%/35% scenario and 47% in the 45%/40% scenario), with an important reduction in gas imports (27% decrease in the 35% RES/35% EE scenario compared to 27% RES/30% EE, and even 42% decrease in the 45%/40% scenario).
3. Macroeconomic impacts
3 Emissions and removals covered by the land use, land use change and forestry (LULUCF) Regulation are excluded
6
An analysis was also performed to assess the macroeconomic impacts of a revision of assumptions on renewable energy technology costs (for onshore wind, offshore wind, solar PV and solar thermal) together with higher RES targets (30%, 33%, 35%, 45%) coupled with energy efficiency targets (30%, 33%, 35% and 40%).
Similarly to what was done in the 2016 impact assessments of the clean energy package, two macroeconomic models were used (E3ME and GEM-E3). and, for each model, two variants were considered. The two variants considered as more realistic are the E3ME "partial crowding-out"4 and the GEME3 "loan-based"5 ones and they are the ones presented below.
The expected impacts on GDP of moving to 30% renewables are expected to be overall fairly neutral. For a 30% RES target combined with 30% EE target, both the E3ME model and the GEM-E3 model show a neutral macroeconomic impact, with marginal changes in GDP.
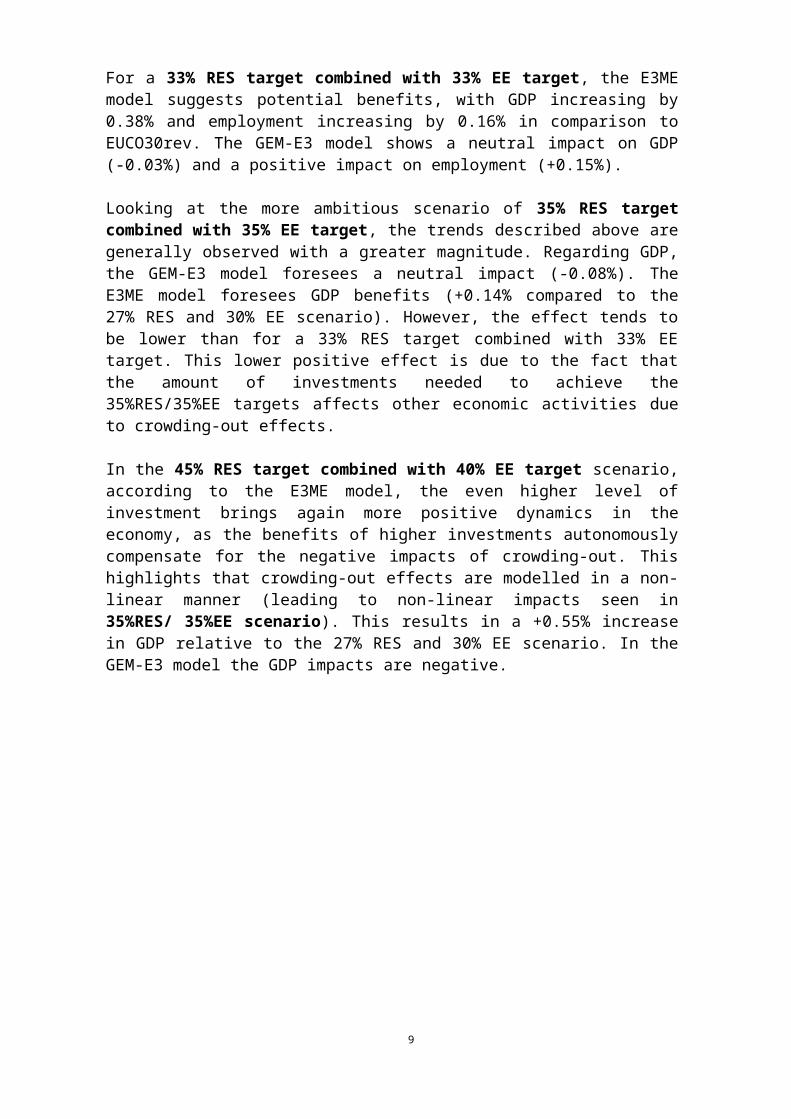
For a 33% RES target combined with 33% EE target, the E3ME model suggests potential benefits, with GDP increasing by 0.38% and employment increasing by 0.16% in comparison to EUCO30rev. The GEM-E3 model shows a neutral impact on GDP (-0.03%) and a positive impact on employment (+0.15%). Looking at the more ambitious scenario of 35% RES target combined with 35% EE target, the trends described above are generally observed with a greater magnitude. Regarding GDP, the GEM-E3 model foresees a neutral impact (-0.08%). The E3ME model foresees GDP benefits (+0.14% compared to the 27% RES and 30% EE scenario). However, the effect tends to be lower than for a 33% RES target combined with 33% EE target. This lower positive effect is due to the fact that the amount of investments needed to achieve the 35%RES/35%EE targets affects other economic activities due to crowding-out effects.
In the 45% RES target combined with 40% EE target scenario, according to the E3ME model, the even higher level of investment brings again more positive dynamics in the economy, as the benefits of higher investments autonomously compensate for the negative impacts of crowding-out. This highlights that crowding-out effects are modelled in a non-linear manner (leading to non-linear impacts seen in 35%RES/ 35%EE scenario). This results in a +0.55% increase in GDP relative to the 27% RES and 30% EE scenario. In the GEM-E3 model the GDP impacts are negative.
4 The "no crowding out" represents the standard approach in E3ME and its usual treatment of investment dynamics, whereby there is no maximum level imposed on production growth. Industries can grow by absorbing investments without negatively impacting other sectors (e.g. drawing on spare capacity or unutilised physical capital). The "partial crowding out" imposes a constraint on activity expansion by introducing a rule that would set a maximum amount that the sectors would be allowed to increase by, without adversely affecting other economic activities. 5 In the "loan-based" finance version, by assumption, an energy efficiency investment in 2020 would be financed via a loan which would cover 90% of total expenditure in 2020. This share is assumed to decrease after 2020, reaching 70% of total expenditure in 2035. Afterwards the percentage remains constant. The loan lasts for 10 years and repayment starts one period after it is issued. In the "self-financing" version, GEM-E3 excludes the possibility of firm and household indebtedness and assumes that all expenditures are self-financed by the sectors undertaking the energy efficiency investments, e.g. firms increase prices, households reduce other expenditures.
7
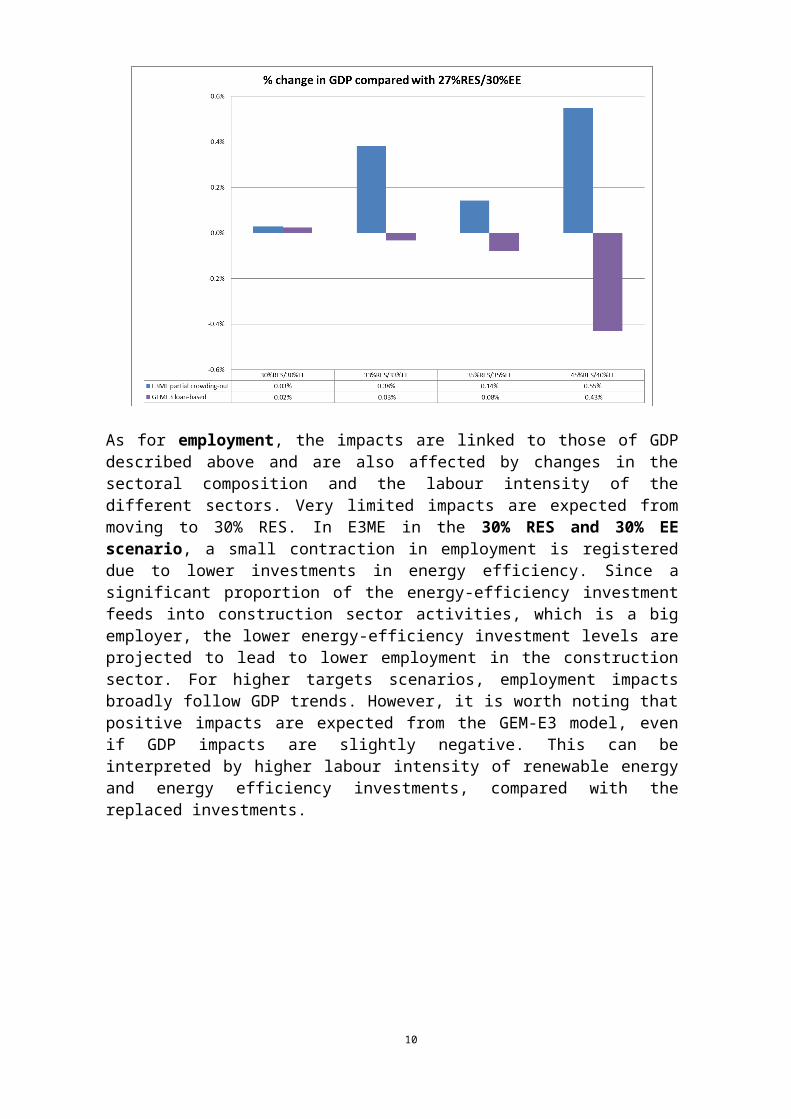
As for employment, the impacts are linked to those of GDP described above and are also affected by changes in the sectoral composition and the labour intensity of the different sectors. Very limited impacts are expected from moving to 30% RES. In E3ME in the 30% RES and 30% EE scenario, a small contraction in employment is registered due to lower investments in energy efficiency. Since a significant proportion of the energy-efficiency investment feeds into construction sector activities, which is a big employer, the lower energy-efficiency investment levels are projected to lead to lower employment in the construction sector. For higher targets scenarios, employment impacts broadly follow GDP trends. However, it is worth noting that positive impacts are expected from the GEM-E3 model, even if GDP impacts are slightly negative. This can be interpreted by higher labour intensity of renewable energy and energy efficiency investments, compared with the replaced investments.
8
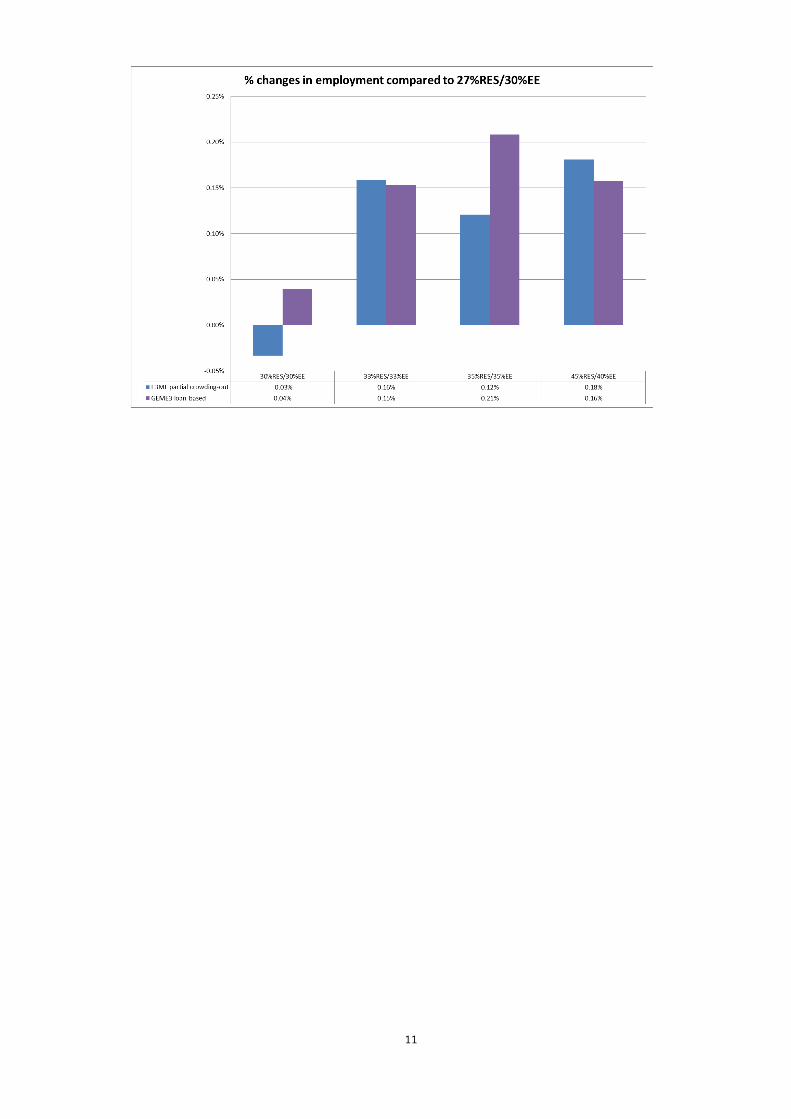
Detailed table of comparative benefits and costs of different scenarios(Impacts of lower technology costs and more ambitious RES targets)
New modelling analysis Modelling presented in 2016 Impact Assessments
Key indicators Unit 27% RES/30% EE
30% RES/30% EE
33% RES/ 33% EE
35% RES/35 % EE
45% RES/40%EE
EUCO30 EUCO+33 EUCO+35 EUCO+40
Year 2030 2030 2030 2030 2030 2030 2030 2030 2030GDP[E3ME model, partial crowding out]
€2013m18,104,906 18,110,107 18,174,250 18,130,657 18,204,13
4 18,115,362 18,280,150 18,330,147 18,442,966
GDP[GEM-E3 model, loan-based]
€2013m17,006,550 17,010,567 17,001,086 16,993,297 16,933,35
7 17,006,442 16,997,648 16,988,938 16,971,617
Employment[E3ME model, partial crowding out]
th. persons234,071 233,993 234,442 234,354 234,495 233,946 235,011 235,535 236,804
Employment[GEM-E3 model, loan-based]
th. persons216,974 217,060 217,307 217,426 217,316 217,024 217,193 217,366 217,792
Investments[E3ME model, partial crowding out] €2013m 4,203,154 4,210,227 4,291,166 4,311,145 4,342,121 4,200,675 4,329,468 4,410,835 4,597,140
Investments[GEM-E3 model, loan-based] €2013m 3,025,340 3,032,289 3,112,764 3,165,845 3,225,788 3,025,862 3,129,886 3,216,105 3,453,054
Distributional impacts for income by socio-economic group, % change in average real income compared to Reference [E3ME model, partial crowding out]
All households
0.9 0.8 0.9 0.8 1.1 0.7 1.2 1.4 1.8
1st (lowest income) quintile
1.2 1.0 1.3 1.2 1.2 0.9 1.7 1.9 2.6
2nd quintile 1.1 1.0 1.2 1.1 1.2 0.9 1.6 1.8 2.43rd quintile 1.0 0.9 1.1 1.0 1.1 0.8 1.4 1.5 2.04th quintile 0.9 0.8 0.9 0.8 0.9 0.7 1.1 1.3 1.75th (highest income) quintile
0.7 0.6 0.7 0.6 0.7 0.5 0.8 0.9 1.5
Public budget impacts as % of GDP - difference 0.23 0.18 0.24 0.10 0.09 0.08 0.5 0.8 1.2
New modelling analysis Modelling presented in 2016 Impact Assessments
Key indicators Unit 27% RES/30% EE
30% RES/30% EE
33% RES/ 33% EE
35% RES/35 % EE
45% RES/40%EE
EUCO30 EUCO+33 EUCO+35 EUCO+40
Year 2030 2030 2030 2030 2030 2030 2030 2030 2030from Reference, 2030 (current prices)[E3ME model, partial crowding out]
%
Annual health cost impacts, difference from Reference - Mortality & morbidity / cost savings NOx, SOx, PM10 and PM2.5 in 2030 [E3ME model, partial crowding out]
m€ / year
-97,599 -104,797 -162,262 -178,116 -280,783 -125,730 -137,018 -147,122 -188,974
Overall RES share % 27.1% 30.1% 33.0% 35.0% 45.4% 27.1% 28.1% 27.9% 28.4%
RES-E share % 48.9% 53.3% 56.2% 58.5% 79.2% 48.7% 48.9% 48.4% 51.1%
RES-H&C share % 26.2% 29.6% 33.7% 36.0% 41.6% 26.3% 28.6% 28.5% 28.3%
RES-T share % 19.0% 25.3% 28.1% 31.7% 52.6% 19.0% 19.2% 20.0% 22.4%
Total GHG emissions (% change to 1990) % -40.8% -43.0% -45.8% -47.5% -53.2% -40.8% -43.0% -43.9% -47.2%
ETS sectors emissions (% change to 2005) % -43.2% -46.5% -48.7% -50.1% -58.4% -43.1% -44.3% -44.2% -48.3%
non-ETS sectors (excl. LULUCF) emissions (% change to 2005)
%-30.3% -31.7% -35.5% -37.7% -41.9% -30.3% -33.7% -35.5% -38.7%
International oil prices (compared to EUCO 27; average 2020-2030) Source: POLES, JRC
%-0.3% -0.6% -1.0% -1.4%
International gas prices (compared to EUCO 27; average 2020-2030) Source: POLES, JRC
%-1.1% -2.3% -3.0% -4.3%
International coal prices (compared to EUCO 27; average 2020-2030) Source: POLES, JRC
%0.02% 0.01% 0.01% -0.03%
Carbon price ETS sectors €'13/ t of CO2 27 24 23 20 22 27 27 20 14
EE PEC target (2007 baseline: 1887 Mtoe in 2030) % -30.0% -30.3% -33.3% -35.1% -40.2% -30.0% -33.2% -35.3% -40.1%
Primary Energy Consumption (Mtoe) Mtoe 1321 1315 1257 1225 1101 1321 1260 1220 1129
EE FEC target (2007 baseline: 1415 Mtoe in 2030) % -30.2% -30.1% -33.7% -35.6% -37.9% -30.3% -34.3% -36.9% -41.7%
Final energy consumption Mtoe 988 989 939 912 879 987 929 893 825
10
New modelling analysis Modelling presented in 2016 Impact Assessments
Key indicators Unit 27% RES/30% EE
30% RES/30% EE
33% RES/ 33% EE
35% RES/35 % EE
45% RES/40%EE
EUCO30 EUCO+33 EUCO+35 EUCO+40
Year 2030 2030 2030 2030 2030 2030 2030 2030 2030Total import dependency % 53.5% 51.7% 50.0% 49.0% 46.6% 53.4% 52.6% 52.3% 51.8%
Net natural gas imports bcm 273.5 264.2 220.7 200.7 152.5 272.7 236.7 220.2 181.5
Net Electricity Generation (TWh) TWh 3291501 3342917 3358932 3356407 3428921 3285630 3215512 3122930 2921332
Renewable energy share in electricity generation % 42.3% 46.7% 49.4% 51.1% 67.8% 41.8% 42.1% 41.8% 44.3%
of which wind onshore % 15.6% 17.6% 18.4% 19.1% 25.3% 17.1% 17.1% 16.6% 17.3%
of which wind offshore % 5.6% 7.2% 8.3% 9.0% 15.3% 3.9% 3.9% 3.9% 4.1%
of which solar % 9.7% 10.6% 11.4% 11.6% 15.9% 9.3% 9.4% 9.2% 10.0%
of which Biomass & waste % 7.5% 7.7% 8.0% 8.5% 11.3% 7.7% 7.4% 7.5% 8.0%
Average Electricity prices € 156.7 157.5 159.2 160.7 181.1 157.5 158.0 156.9 159.0
RES supporting costs passed on to consumers € 19.4 19.5 19.5 19.7 19.5 20.3 20.7 21.3 23.0
Overall biomass-waste consumption ktoe 169933 186690 185345 191882 239407 178930 163012 155309 144161
Renewable energy from Heat pumps ktoe 20737 23503 35905 39587 46088 20466 26657 24894 22077
Total System Costs in bn €'13 (average annual 2021-30)
bn €'131948.9 1953.4 1972.3 1999.0 2032.8 1951.8 1977.2 2014.0 2076.7
Total Energy System Costs (average annual 2021-2050)
bn €'132247.8 2251.2 2266.0 2296.8 2338.5 2254.7 2289.9 2323.7 2384.5
Transport System costs (average annual 2021-30)
bn €'13673.9 676.5 685.0 710.2 719.1 674.1 682.0 705.2 710.4
Household System costs (average annual 2021-30)
bn €'13709.8 711.8 727.2 734.7 749.7 710.8 728.9 741.9 770.4
Services System costs (average annual 2021-30)
bn €'13315.3 315.7 321.4 325.9 332.6 316.6 324.6 331.8 354.3
Industry System costs (average annual 2021-30)
bn €'13303.5 302.3 300.5 300.1 303.1 306.6 305.3 303.7 307.2
Investment expenditures in power generation (2021-2030 period)
bn €'13380 478 538 575 992 394 379 350 341
11
New modelling analysis Modelling presented in 2016 Impact Assessments
Key indicators Unit 27% RES/30% EE
30% RES/30% EE
33% RES/ 33% EE
35% RES/35 % EE
45% RES/40%EE
EUCO30 EUCO+33 EUCO+35 EUCO+40
Year 2030 2030 2030 2030 2030 2030 2030 2030 2030Investment expenditure (energy related, average annual)
bn €'13377 384 488 544 602 379 503 591 825
Industry bn €'13 18 20 23 27 46 19 24 29 51
Residential bn €'13 214 207 259 285 268 214 286 337 455
Tertiary bn €'13 68 64 102 124 113 68 119 157 257
Power grid investment bn €'13 36 43 47 49 71 36 34 31 26
Power plants bn €'13 38 48 54 58 102 40 38 35 34
All biofuels6 ktoe 20297 22917 25075 26598 42643 20304 20179 19698 19610
Food-based biofuels ktoe 14442 6260 6260 6260 6260 14442 14442 14442 14442
Advanced biofuels ktoe 5855 16657 18815 20338 36383 5862 5736 5256 5168
Mandate 6,8% % 3.3% 8.3% 9.1% 10.1% 16.2% 3.3% n.a. n.a. n.a.
Mandate 3,6% % 1.0% 4.2% 4.8% 5.3% 9.5% 1.0% na. na. na.
Food-based cap (3,8%) % 6.0% 2.4% 2.4% 2.5% 2.5% 6.0% na. na. na.
6 The mandates for renewable transport fuels and advanced biofuels and the cap for food-based biofuels as per the Commission's proposal are reflected in the new analysis for all scenarios except 27% RES/30% EE, to allow comparison with the 27% RES/30% EE scenario of the 2016 impact assessment.
12


![Anti-Windup Implementation of Projected Dynamics · dynamical systems that encompasses projected gradient ow [17], projected New-ton ow [16], subgradient ow [9] and projected saddle-ows](https://img.pdfslide.us/doc/110x75/60294d1aac77a707331df610/anti-windup-implementation-of-projected-dynamics-dynamical-systems-that-encompasses.jpg)