Embed Size (px)
Citation preview

1
If you do not have a copy of the Stage 1 DBPR handouts, a copy can be downloaded from the Encounter Collaborative meeting page:https://ei.e2c.com/enc/enc-pc.pmtg

2
Stage 1 Disinfectants & Disinfection Byproducts Rule
U.S. EPA
Webcast Training Session
April 27, 2005

Poll: Are you responsible for implementing Poll: Are you responsible for implementing Stage 1 DBPR?Stage 1 DBPR? [PlaceWare Multiple Choice Poll. Use PlaceWare >
Edit Slide Properties... to edit.] Yes No Not applicable
4
State Request Stage 1
Training for . . .
EPA Oversight Visits Identified
Problems with . . .
Why Stage 1 DBPR? Why Now?

5
State Request Stage 1
Training for . . .
EPA Oversight Visits Identified
Problems with . . .
Calculating Compliance
Why Stage 1 DBPR? Why Now?
Routine, Reduced, and Increased Monitoring
Understanding TOC Requirements

6
Stage 1 DBPR Purpose and Scope
Purpose: Increase public protection from disinfection by products (DBPs) by reducing the exposure to TTHMs, HAA5, bromate, and chlorite.
Scope:• Applies to all public water systems that add a
chemical disinfectant Except for transient systems that add a
disinfectant other than chlorine dioxide
• Addresses both acute and non-acute health effects

7
A Delicate Balance
Risk: microbial contamination vs. DBP formation
U.S. EPA’s solution: control health risks from microbials, disinfectants, and DBPs
Result: M-DBP suite of rules
Microbials Byproducts

8
Outline
Compliance & Reporting – TTHM, HAA5, Chlorine, Chloramines
Overview
Case Studies
Monitoring – TTHM, HAA5, Chlorine, Chloramines
DBP Precursors (DBPP)
Q & AQuestion and answer sections through out the presentation

9
Presenters
Maria Lopez, U.S. EPA
Rudd Coffey, The Cadmus Group, Inc.
Ed Moriarty, U.S. EPA
Tom Grubbs, U.S. EPA
Katie Porter, U.S. EPA
Panelists
Overview

10
Disclaimer The examples included in this presentation are intended for discussion
purposes only. Throughout this presentation, the terms “state” or “states” are used to refer to all types of primacy agencies including U.S. territories, Indian tribes, and EPA Regions. The statutory provisions and EPA regulations described in this document contain legally binding requirements. This presentation is not a regulation itself, nor does it change or substitute for those provisions and regulations. Thus, it does not impose legally binding requirements on EPA, states, or public water systems. This guidance does not confer legal rights or impose legal obligations upon any member of the public. While EPA has made every effort to ensure the accuracy of the discussion in this presentation, the obligations of the regulated community are determined by statutes, regulations, or other legally binding requirements. In the event of a conflict between the discussion in this presentation and any statute or regulation, this presentation would not be controlling.
Overview

11
Overview
Review the Stage 1 DBPR requirements
Overview

12
Acronyms and Definitions
A list of acronyms and definitions for the terms used in this presentation can be found in the handouts
Overview

13
Public Health & Disinfectants
Disinfectants: Kill disease-causing
microorganisms React with substances
naturally found in water to form harmful DBPs
Produce negative health effects when present in excessive levels
Overview

14
Public Health & Disinfectants
Disinfectants: Kill disease-causing
microorganisms React with substances
naturally found in water to form harmful DBPs
Produce negative health effects when present in excessive levels
In excess amounts: Eye and nose irritation Stomach discomfort Anemia Other acute short-term
health effects
Overview
15
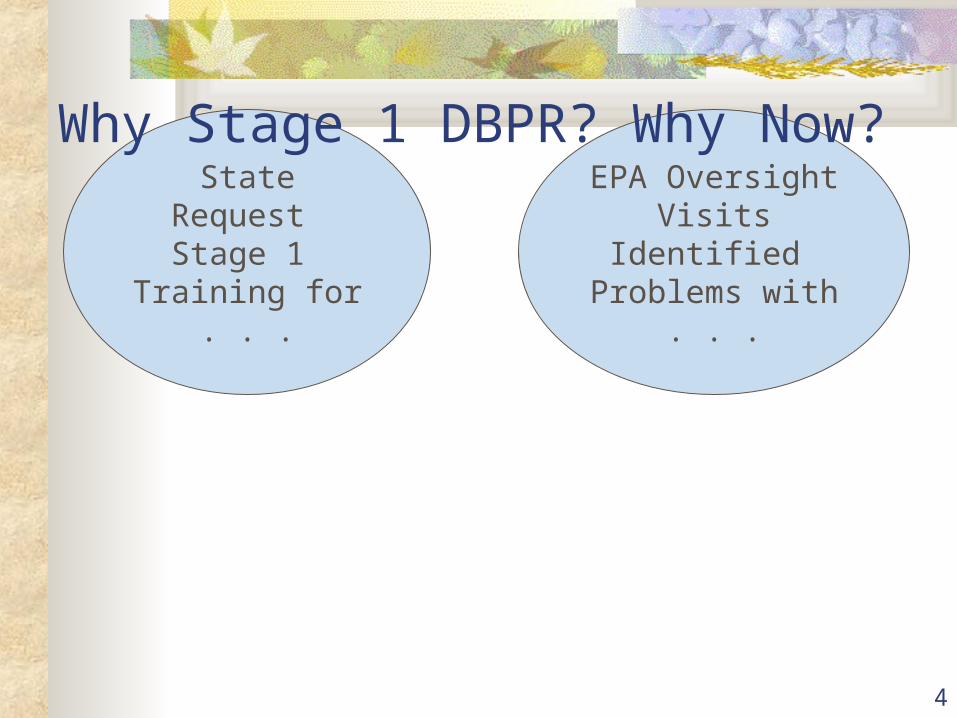
Precursor in Water
NOMBromide
How Are DBPs Formed?
+
Overview

16
Precursor in Water
NOMBromide
Added Disinfectant
Chlorine Ozone
ChloraminesChlorine Dioxide
How Are DBPs Formed?
+ =
Overview

17
Precursor in Water
NOMBromide
Added Disinfectant
Chlorine Ozone
ChloraminesChlorine Dioxide
How Are DBPs Formed?
TTHMHAA5
BromateChlorite
DBPs
+ =
Overview

18
Precursor in Water
NOMBromide
Added Disinfectant
Chlorine Ozone
ChloraminesChlorine Dioxide
How Are DBPs Formed?
Health Effects: Some DBPs may cause adverse reproductive or development effects:
• Low birth weight
• Early term miscarriage Some studies suggest a connection between chlorinated water and:
• Bladder, rectal, and colon cancer
TTHMHAA5
BromateChlorite
DBPs
+ =
Overview

19
MRDL & MCL Overview Maximum Residual Disinfectant Levels (MRDLs)
Disinfectant MRDL
Chlorine 4.0 mg/L
Chloramines 4.0 mg/L
Chlorine Dioxide 0.8 mg/L
Overview
Disinfection Byproduct MCL
TTHM 0.080 mg/L
HAA5 0.060 mg/L
Bromate 0.010 mg/L
Chlorite 1.0 mg/L
Maximum Contaminant Levels (MCLs)

20
TOC Removal Overview
New treatment technique regulations for Total Organic Carbon (TOC)
• Based on source water characteristics, systems must remove specified quantities of TOC.
• Systems can comply through TOC removal or through alternative compliance criteria.
Overview

21
Monitoring Plans Each system must develop and implement a
monitoring plan
• Plan must include: Sample location and schedules
• Representative of entire distribution system
Compliance calculation methodology Plans must have been available for state inspection by
January 2004. Subpart H systems serving > 3,300 must have
submitted monitoring plans to the state by April 2004
Overview

22
Analytical Methods Stage 1 DBPR specifies analytical methods for each
standard
Only certified labs can analyze MCL samples
• Exception: daily chlorite samples
For daily chlorite, disinfectants, and all other non-MCL parameters (e.g., alkalinity, TOC, bromide), analysis may be conducted by a party approved by U.S. EPA or the state
Overview
23
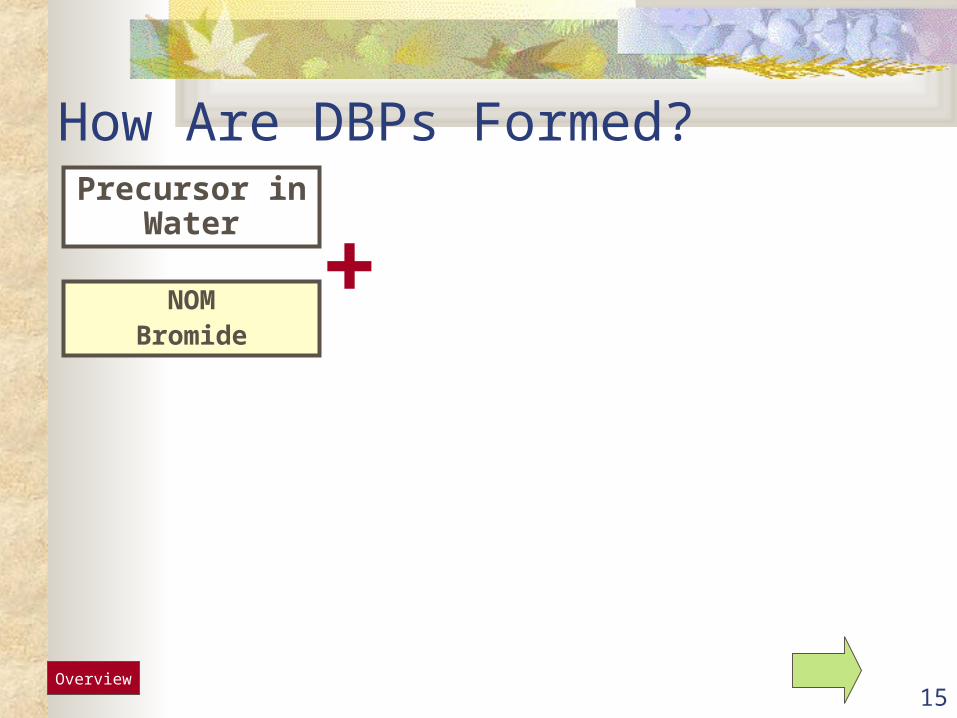
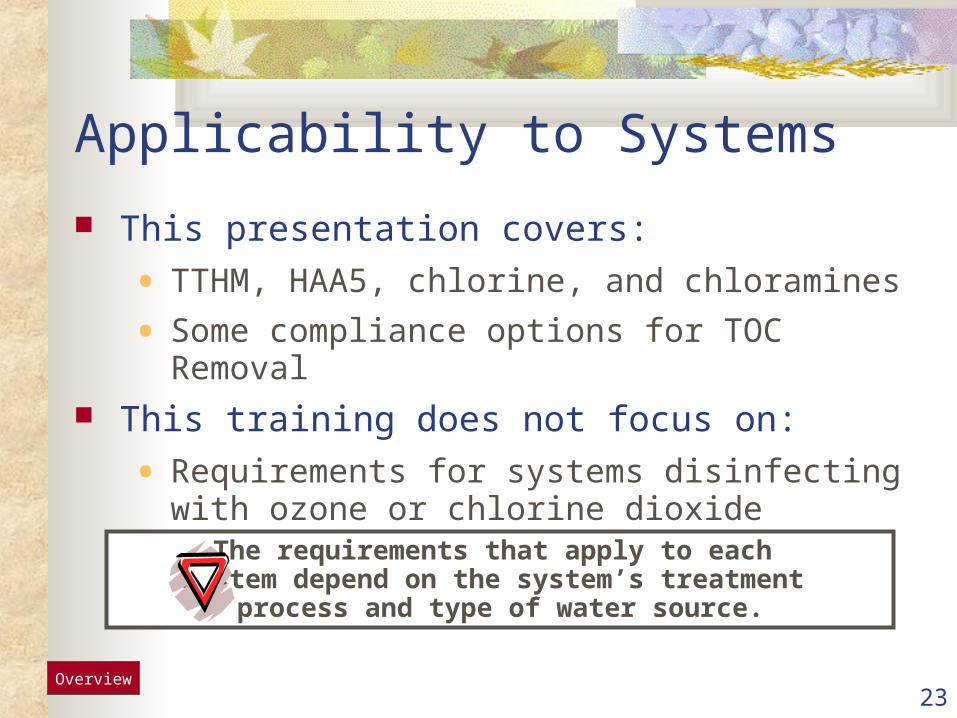
The requirements that apply to each system depend on the system’s treatment
process and type of water source.
Applicability to Systems
This presentation covers:
• TTHM, HAA5, chlorine, and chloramines
• Some compliance options for TOC Removal This training does not focus on:
• Requirements for systems disinfecting with ozone or chlorine dioxide
Overview

Poll: How long have you worked with the Poll: How long have you worked with the Stage 1 DBPR?Stage 1 DBPR? [PlaceWare Multiple Choice Poll. Use PlaceWare > Edit Slide Properties... to
edit.]
0-6 Months 7-12 Months 1-2 Years 2-4 Years 4+ Years

25
Questions
Please send your questions & comments via the web console located on your bottom right.
Q & A

26
Monitoring Overview
Chlorine & Chloramines
TTHM & HAA5

27
General Sampling
When sampling remember to:
• Only take samples under normal operating conditions
• Sample according to the monitoring plan
• Only sample when serving the public
Monitoring

28
Chlorine & Chloramines Monitoring Chlorine and chloramines monitoring based on TCR
monitoring.
• Systems must monitor for chlorine and chloramines every time they sample for total coliform
• Includes repeat total coliform-positive monitoring & reduced TCR monitoring
• Must be taken at same location as TCR samples
• No reduced monitoring 1 TCR sample
=1 chlorine or
chloramines sampleMonitoring

29
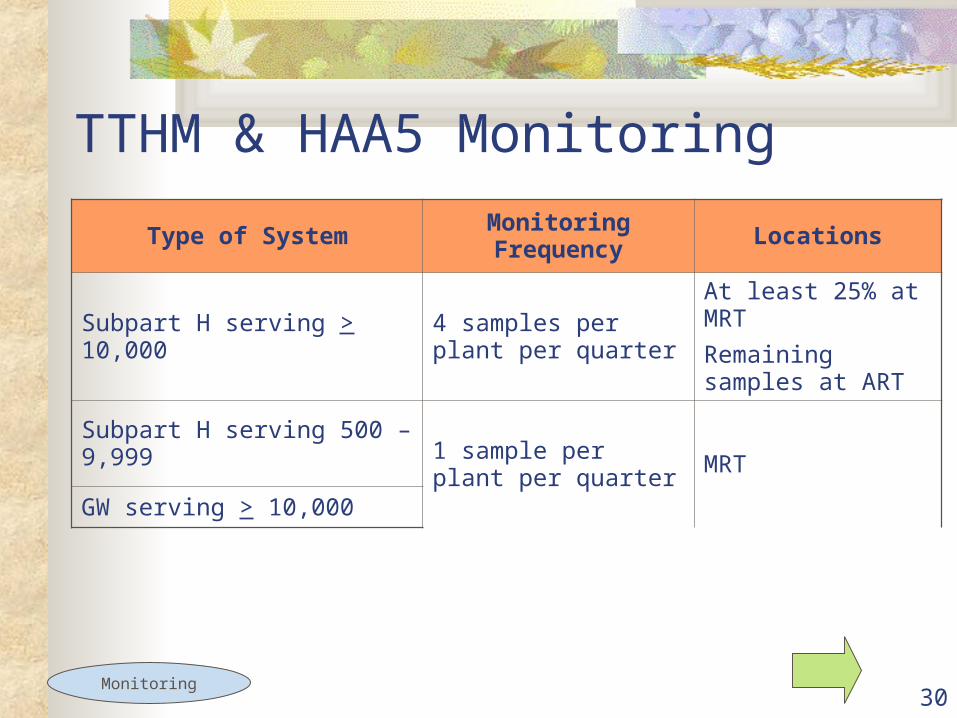
TTHM & HAA5 Monitoring
Type of System Monitoring Frequency Locations
Subpart H serving > 10,0004 samples per plant per quarter
At least 25% at MRT
Remaining samples at ART
MRT = Maximum Residence Time
ART = Average Residence Time
Monitoring
30
TTHM & HAA5 Monitoring
Type of System Monitoring Frequency Locations
Subpart H serving > 10,0004 samples per plant per quarter
At least 25% at MRT
Remaining samples at ART
Subpart H serving 500 – 9,999 1 sample per plant per quarter
MRT
GW serving > 10,000
Monitoring

31
TTHM & HAA5 Monitoring
Type of System Monitoring Frequency Locations
Subpart H serving > 10,0004 samples per plant per quarter
At least 25% at MRT
Remaining samples at ART
Subpart H serving 500 – 9,999 1 sample per plant per quarter
MRT
GW serving > 10,000
Subpart H serving < 5001 sample per plant per year during month of warmest water temperature
MRT
GW serving < 10,000 MRT
Monitoring

32
TTHM & HAA5 Reduced Monitoring
Type of System Requirement Reduced Level
Subpart H serving > 10,000 TTHM RAA < 0.040 mg/L
HAA5 RAA < 0.030 mg/L
Source Water TOC RAA < 4.0 mg/L (subpart H only)
1 sample per plant per quarter at MRT
Subpart H serving
500 – 9,9991 sample per plant per year during month of warmest water temperatureGW serving > 10,000
Monitoring

33
TTHM & HAA5 Reduced Monitoring
Type of System Requirement Reduced Level
Subpart H serving > 10,000 TTHM RAA < 0.040 mg/L
HAA5 RAA < 0.030 mg/L
Source Water TOC RAA < 4.0 mg/L (subpart H only)
1 sample per plant per quarter at MRT
Subpart H serving
500 – 9,9991 sample per plant per year during month of warmest water temperatureGW serving > 10,000
Subpart H serving < 500 N/A N/A
Monitoring

34
TTHM & HAA5 Reduced Monitoring
Type of System Requirement Reduced Level
Subpart H serving > 10,000 TTHM RAA < 0.040 mg/L
HAA5 RAA < 0.030 mg/L
Source Water TOC RAA < 4.0 mg/L (subpart H only)
1 sample per plant per quarter at MRT
Subpart H serving
500 – 9,9991 sample per plant per year during month of warmest water temperatureGW serving > 10,000
Subpart H serving < 500 N/A N/A
GW serving < 10,000
TTHM RAA < 0.040 mg/L
HAA5 RAA < 0.030 mg/L
For 2 years or
TTHM RAA < 0.020 mg/L
HAA5 RAA < 0.015 mg/L
For 1 year
1 sample per treatment plant per 3-year monitoring cycle at MRT
Monitoring

35
TTHM & HAA5 Increased Monitoring
Type of System Trigger Increased Level
Subpart H serving > 10,000
N/A N/ASubpart H serving 500 – 9,999
GW serving > 10,000
Monitoring

36
TTHM & HAA5 Increased Monitoring
Type of System Trigger Increased Level
Subpart H serving > 10,000
N/A N/ASubpart H serving 500 – 9,999
GW serving > 10,000
Subpart H serving < 500Any TTHM or HAA5 result > MCL
1 sample per treatment plant per quarter at MRTGW serving < 10,000
Monitoring

37
Quiz #1:PWS Takes 1 Routine TCR Sample/Month One routine TCR sample Adds chlorine for
disinfection Ground water system
What does this system need to do to comply with the Stage 1 DBPR chlorine monitoring requirements?
Monitoring
38
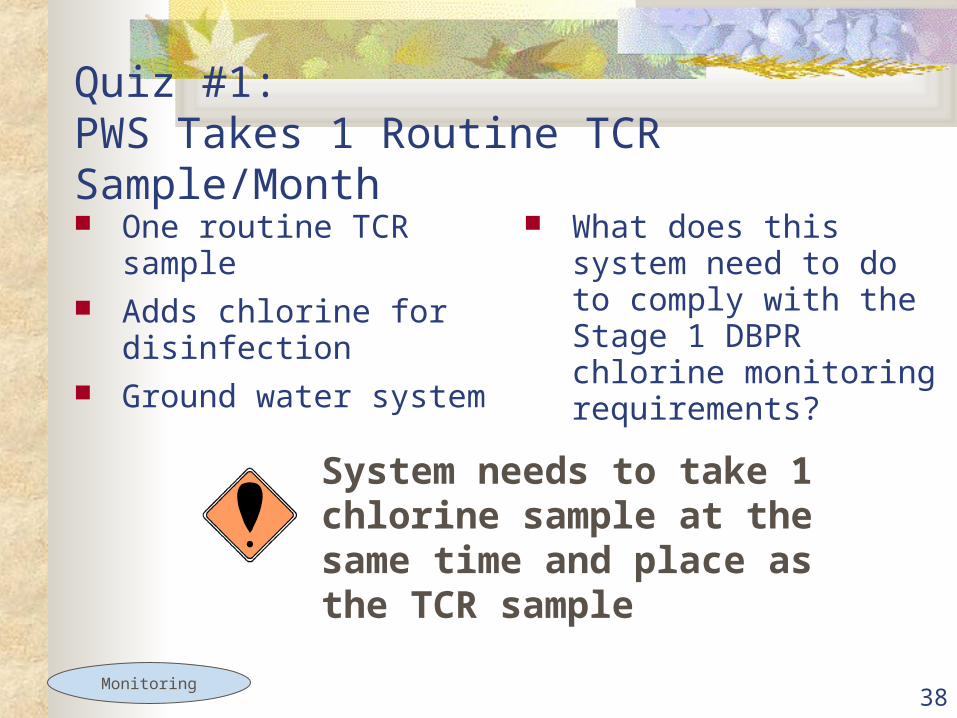
Quiz #1:PWS Takes 1 Routine TCR Sample/Month One routine TCR sample Adds chlorine for
disinfection Ground water system
What does this system need to do to comply with the Stage 1 DBPR chlorine monitoring requirements?
System needs to take 1 chlorine sample at the same time and place as the TCR sample
Monitoring
39
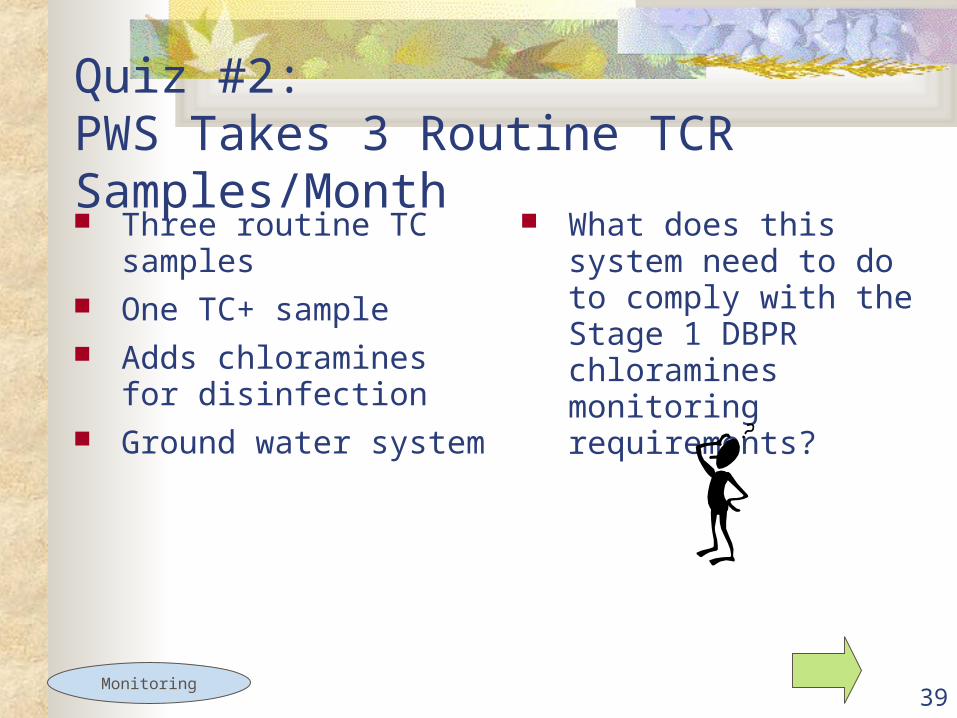
Quiz #2:PWS Takes 3 Routine TCR Samples/Month Three routine TC samples One TC+ sample Adds chloramines for
disinfection Ground water system
What does this system need to do to comply with the Stage 1 DBPR chloramines monitoring requirements?
Monitoring

40
Quiz #2:PWS Takes 3 Routine TCR Samples/Month Three routine TC samples One TC+ sample Adds chloramines for
disinfection Ground water system
What does this system need to do to comply with the Stage 1 DBPR chloramines monitoring requirements?
1. System needs to take 3 chloramines samples at the same time and place as the initial TCR samples.
2. System needs to take 3 chloramines sample at the same time and place as 3 TCR repeat samples.
3. System needs to take 5 repeat TCR and chloramines samples the following month.
Monitoring

41
Quiz #3:PWS on Routine TTHM & HAA5 Sampling
RAAs
• TTHM = 0.035 mg/L
• HAA5 = 0.020 mg/L
GWUDI system serving 9,000 persons
What does this system need to do to comply with the Stage 1 DBPR TTHM and HAA5 monitoring requirement?
Monitoring

42
Quiz #3:PWS on Routine TTHM & HAA5 Sampling
RAAs
• TTHM = 0.035 mg/L
• HAA5 = 0.020 mg/L
GWUDI system serving 9,000 persons
What does this system need to do to comply with the Stage 1 DBPR TTHM and HAA5 monitoring requirement?
If the system stays on routine monitoring it must take 1 sample per plant per quarter. Because the system’s RAA are < 0.040 mg/L for TTHMs and < 0.030 mg/L for HAA5, the system may qualify for reduced monitoring of one sample a year during the month of warmest water temperature. They would need to consult with their state.
Monitoring

43
Questions
Please send your questions & comments via the web console located on your bottom right.
Q & A

44
Compliance and Reporting
Chlorine & Chloramines
TTHM & HAA5
45
General Compliance Calculation When calculating compliance remember to:
• Compare the running annual average (RAA) of the results from last 12 months to standard
• Include all sampling results (unless designated as operational samples in monitoring plans)
• Calculate compliance at the end of every quarter in which system monitors
State can calculate complianceCompliance and
Reporting

46
Chlorine & Chloramines: Compliance Calculation
Based on RAA of monthly results or averages
Calculated each quarter the system serves water to the public
Any RAA that exceeds the MRDL is a violation
Compliance and Reporting

47
TTHM & HAA5:Quarterly Compliance Calculation
Based on RAA of quarterly results or averages
Calculated each quarter the system serves water to the public
Any RAA that exceeds the MCL is a violation
Compliance and Reporting

48
TTHM & HAA5:Annual/Triennial Compliance Calculation
If sample result > MCL:
• Not yet in violation of MCL unless sample result is > 4 times MCL
• Must move to increased monitoring schedule
If on reduced monitoring and sample > 75% of MCL:
• Must return to routine monitoring schedule
Compliance and Reporting

49
Quiz#4: Calculating Compliance for TTHM & HAA5
1: Determine number of samples required
Subpart H system serving 500-9,999
on routine monitoring
Compliance and Reporting

50
Quiz#4: Calculating Compliance for TTHM & HAA5
1: Determine number of samples required
2. Calculate RAA to determine compliance
TTHM sample 3rd quarter of 2005
3Q 2005: 0.070 mg/L
2Q 2005: 0.080 mg/L
1Q 2005: 0.080 mg/L
4Q 2004: 0.090 mg/L
The system is required to take
1 sample per treatment plant
per quarter
Subpart H system serving 500-9,999
on routine monitoring
Compliance and Reporting

51
Quiz#4: Calculating Compliance for TTHM & HAA5
2. Calculate the RAA for TTHM
Example:
Sum of quarterly averages = (0.090 + 0.080 + 0.080 + 0.070) = 0.320 mg/L
Use these results to calculate an RAA
Compliance and Reporting
Subpart H system serving 500-9,999
on routine monitoring

52
Quiz#4: Calculating Compliance for TTHM & HAA5
2. Calculate the RAA for TTHM
Example:
Sum of quarterly averages = (0.090 + 0.080 + 0.080 + 0.070) = 0.320 mg/L
Sum of quarterly averages = 0.320 mg/L
RAA = 0.320/4
RAA = 0.080 mg/L < MCL
Use these results to calculate an RAA
Compliance and Reporting
Subpart H system serving 500-9,999
on routine monitoring

53
Quiz#4: Calculating Compliance for TTHM & HAA5
2. Calculate the RAA for TTHM
Example:
Sum of quarterly averages = (0.090 + 0.080 + 0.080 + 0.070) = 0.320 mg/L
Sum of quarterly averages = 0.320 mg/L
RAA = 0.320/4
RAA = 0.080 mg/L < MCL
Use these results to calculate an RAA
System is in compliance!
Compliance and Reporting
Subpart H system serving 500-9,999
on routine monitoring

54
Quiz#4: Calculating Compliance for TTHM & HAA5
1: Determine number of samples required
GW system serving > 10,000
on routine monitoring
Compliance and Reporting

55
Quiz#4: Calculating Compliance for TTHM & HAA5
1: Determine number of samples required
The system is required to take
1 sample per treatment plant
per quarter
Date Avg. of all samples
Q1: Jan 2004 0.057
Q2: April 2004 0.029
Q3: July 2004 0.064
Q4: Nov 2004 0.081
Q1: Jan 2005 0.037
GW system serving > 10,000
on routine monitoring
Compliance and Reporting

56
Quiz#4: Calculating Compliance for TTHM & HAA5
2. Which samples should the system use for calculating compliance for Q1 2005?
Compliance and Reporting
GW system serving > 10,000
on routine monitoring
Date Avg. of all samples
Q1: Jan 2004 0.057
Q2: April 2004 0.029
Q3: July 2004 0.064
Q4: Nov 2004 0.081
Q1: Jan 2005 0.037
Identify results to calculate HAA5 RAA

57
Quiz#4: Calculating Compliance for TTHM & HAA5
2. Which samples should the system use for calculating compliance for Q1 2005?
Compliance and Reporting
Date Avg. of all samples
Q1: Jan 2004 0.057
Q2: April 2004 0.029
Q3: July 2004 0.064
Q4: Nov 2004 0.081
Q1: Jan 2005 0.037
Identify results to calculate HAA5 RAA
GW system serving > 10,000
on routine monitoring
58
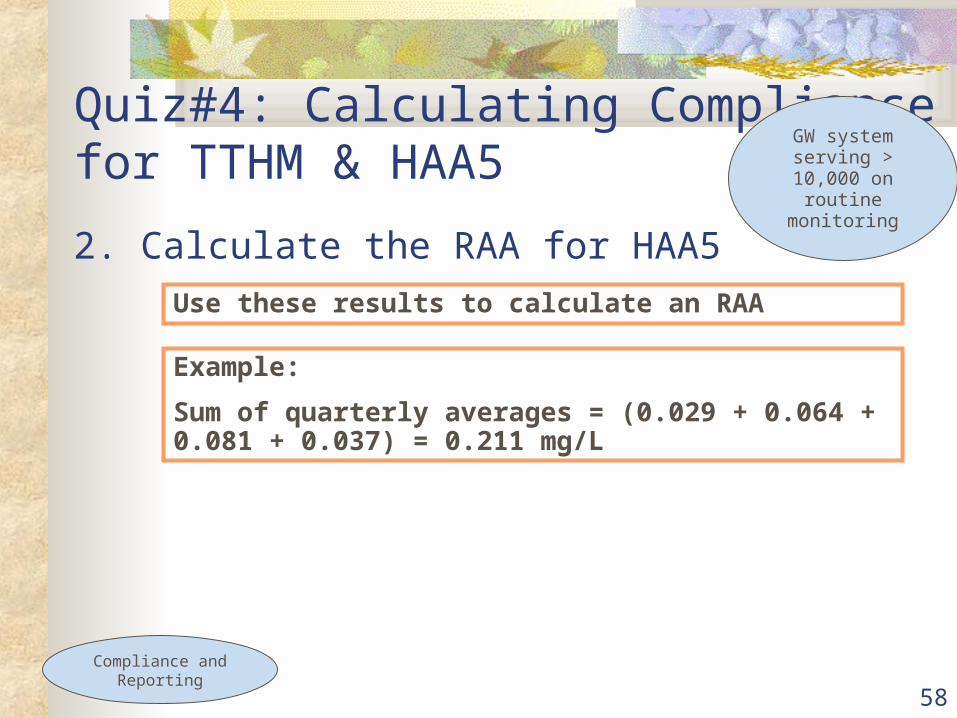
Quiz#4: Calculating Compliance for TTHM & HAA5
2. Calculate the RAA for HAA5
Example:
Sum of quarterly averages = (0.029 + 0.064 + 0.081 + 0.037) = 0.211 mg/L
Use these results to calculate an RAA
Compliance and Reporting
GW system serving > 10,000
on routine monitoring

59
Quiz#4: Calculating Compliance for TTHM & HAA5
2. Calculate the RAA for HAA5
Example:
Sum of quarterly averages = (0.029 + 0.064 + 0.081 + 0.037) = 0.211 mg/L
Sum of quarterly averages = 0.211 mg/L
RAA = 0. 211/4
RAA = 0.053 mg/L < MCL
Use these results to calculate an RAA
Compliance and Reporting
GW system serving > 10,000
on routine monitoring

60
Quiz#4: Calculating Compliance for TTHM & HAA5
2. Calculate the RAA for HAA5
Example:
Sum of quarterly averages = (0.029 + 0.064 + 0.081 + 0.037) = 0.211 mg/L
Sum of quarterly averages = 0.211 mg/L
RAA = 0. 211/4
RAA = 0.053 mg/L < MCL
Use these results to calculate an RAA
Compliance and Reporting
System is in compliance!
GW system serving > 10,000
on routine monitoring

61
Report to State due within 10 days of the end of each quarter.
Remember to include:
Number of samples taken during each month of the last
quarter
Monthly arithmetic average of all samples
taken in each month for the last 12 months
Arithmetic average of the monthly averages for the last 12 months
MRDL violations
Compliance and
Reporting
Chlorine & Chloramines Reporting

62
Number of samples taken during the last
quarter
Location, date and result of each sample taken during the last
quarter
Arithmetic average of all the samples taken in
the last quarter
Annual arithmetic average of the
quarterly averages of the last 4 quarters
MCL violations
Compliance and Reporting
Report to State due within 10 days of the end of each quarter.
Remember to include:
TTHM & HAA5 Reporting

63
Tier 2: Notify the state within 48 hours of the violation!
Notify customers within 30 days
Send a copy of PN to the state within 10 days of notifying customers
PN Rule Requirements
If a system commits a monitoring violation, it must inform the state and its customers
Compliance and Reporting

64
Returning to Compliance
Options for systems with compliance problems:
• BATs
• Source water changes
• Partnership with other system(s)
• Modify treatment
Compliance and Reporting

65
Questions
Please send your questions & comments via the web console located on your bottom right.
Q & A

66
DBP Precursors
Found naturally in water
React with disinfectants to produce DBPs
Reducing DBP precursors limits formation of DBPs
DBP Precursors (DBPP)
67
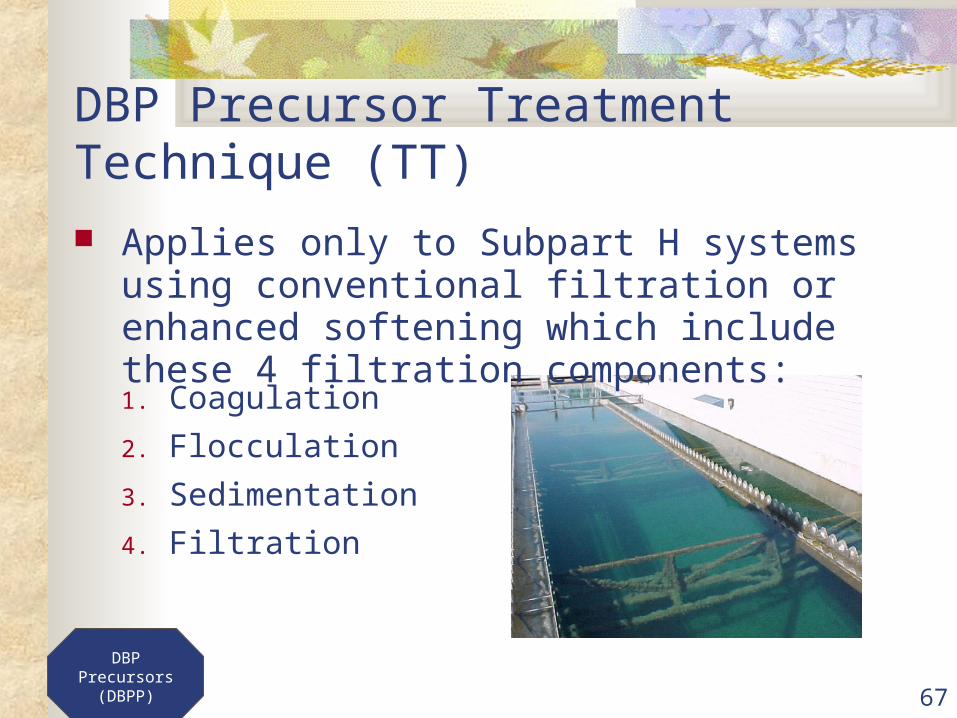
DBP Precursor Treatment Technique (TT)
Applies only to Subpart H systems using conventional filtration or enhanced softening which include these 4 filtration components:
DBP Precursors (DBPP)
1. Coagulation
2. Flocculation
3. Sedimentation
4. Filtration
68
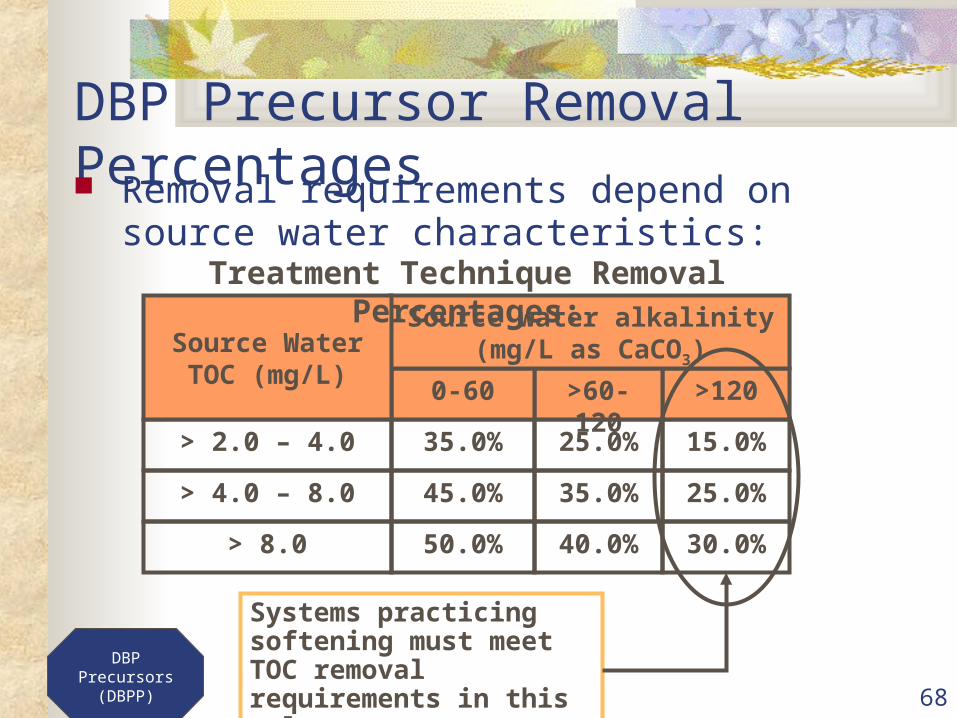
DBP Precursor Removal Percentages Removal requirements depend on source water
characteristics:
30.0%40.0%50.0%> 8.0
25.0%35.0%45.0%> 4.0 – 8.0
15.0%25.0%35.0%> 2.0 – 4.0
>120>60-1200-60
Source water alkalinity(mg/L as CaCO3)Source Water TOC
(mg/L)
Systems practicing softening must meet TOC removal requirements in this column
Treatment Technique Removal Percentages:
DBP Precursors (DBPP)

69
Paired sample
Sourc
e
TOC
Treated
TOC
DBP Precursor Routine Monitoring Requirements 1 sample set per month:
• Source water alkalinity
• Source water TOC
• Treated water TOC
DBP Precursors (DBPP)

70
30.0%40%50.0%> 8.0
25.0%35.0%45.0%> 4.0 – 8.0
15.0%25.0%35.0%> 2.0 – 4.0
>120>60-1200-60
Source water Alkalinity (mg/L as CaCO3
Source Water TOC (mg/L)
Treated water sample determines what percentage of TOC was removed
DBP Precursor Monitoring Results Source water samples determine TOC removal target Example: • Alkalinity 65 mg/L• Source Water TOC 9.0 mg/L
DBP Precursors (DBPP)

71
30.0%40%50.0%> 8.0
25.0%35.0%45.0%> 4.0 – 8.0
15.0%25.0%35.0%> 2.0 – 4.0
>120>60-1200-60
Source water Alkalinity (mg/L as CaCO3
Source Water TOC (mg/L)
Treated water sample determines what percentage of TOC was removed
DBP Precursor Monitoring Results Source water samples determine TOC removal target Example:• Alkalinity 65 mg/L• Source Water TOC 9.0 mg/L• Required Removal Percentage = 40%
DBP Precursors (DBPP)
>60-120
> 8.0 40.0%

72
DBP Precursor Reduced Monitoring
Qualify if average treated water TOC level is:
• Less than 2.0 mg/L for 2 years
OR
• Less than 1.0 mg/L for 1 year Reduced Schedule: 1 sample set per quarter
• Return to routine if RAA of treated water TOC > 2.0 mg/L
DBP Precursors (DBPP)

73
DBP Precursor Compliance Overview
Most systems will be able to comply through alternative compliance criteria or Step 1 TOC removal
DBP Precursors (DBPP)
1. Step 1 TOC Removal Covered in Today’s Presentation

74
DBP Precursor Compliance Overview
Most systems will be able to comply through alternative compliance criteria or Step 1 TOC removal
DBP Precursors (DBPP)
1. Step 1 TOC Removal Covered in Today’s Presentation
2. Alternative Compliance Criteria Briefly Covered in Today’s Presentation
3. Step 2 TOC Removal

75
DBP Precursor Compliance Overview
Most systems will be able to comply through alternative compliance criteria or Step 1 TOC removal
DBP Precursors (DBPP)
1. Step 1 TOC Removal Covered in Today’s Presentation
2. Alternative Compliance Criteria Briefly Covered in Today’s Presentation
3. Step 2 TOC Removal
4. State Waiver Not Covered in Today’s Presentation

76
Step 1 TOC Removal
Systems remove a percentage of TOC based on source water characteristics
Percentage may change on a month-to-month basis Compliance is based on a ratio of the percentage of
TOC actually removed to percentage of TOC that system should have removed
Ratio > 1.00 required to remain in compliance Compliance based on RAA calculated quarterly
DBP Precursors (DBPP)
77
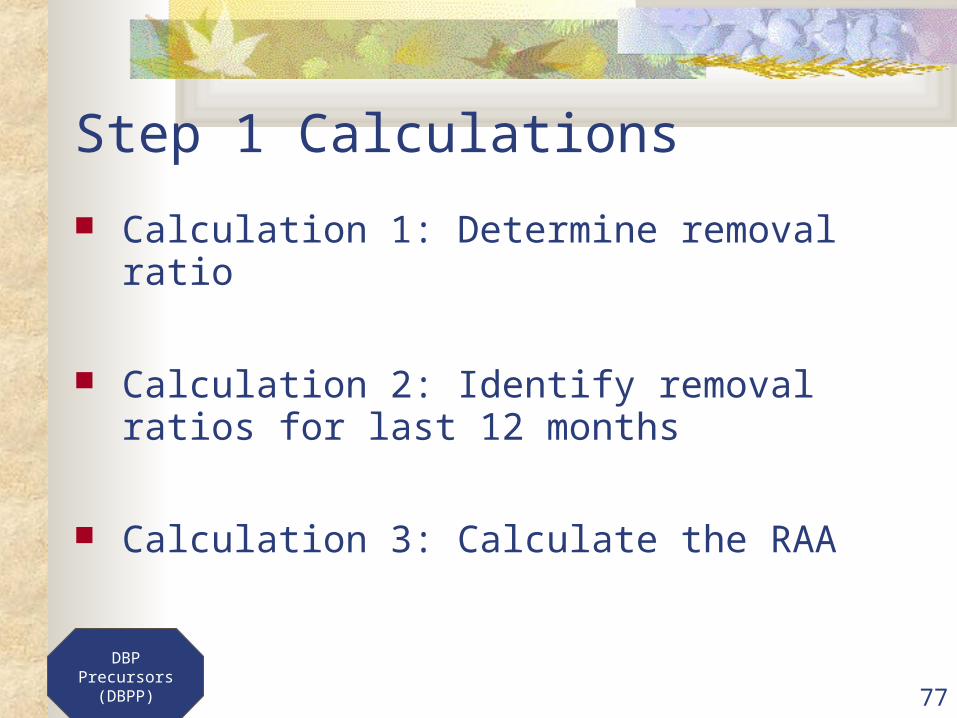
Step 1 Calculations
Calculation 1: Determine removal ratio
Calculation 2: Identify removal ratios for last 12 months
Calculation 3: Calculate the RAA
DBP Precursors (DBPP)

78
Quiz#5: DBP Precursor Calculating Compliance for Step 1
This example is for a system meeting TOC removal requirements using the Step 1 Criteria
• What results does the system need in order to calculate compliance?
DBP Precursors (DBPP)

79
Quiz#5: DBP Precursor Calculating Compliance for Step 1
This example is for a system meeting TOC removal requirements using the Step 1 Criteria
• What results does the system need in order to calculate compliance?
Source Water TOC
Source Water Alkalinity
Treated Water TOC
DBP Precursors (DBPP)

80
Quiz#5: DBP Precursor Calculating Compliance for Step 1
This example is for a system meeting TOC removal requirements using the Step 1 Criteria
• When should the system calculate compliance?
DBP Precursors (DBPP)

81
This example is for a system meeting TOC removal requirements using the Step 1 Criteria
• When should the system calculate compliance?
Quarterly to Determine the RAA
DBP Precursors (DBPP)
Quiz#5: DBP Precursor Calculating Compliance for Step 1

82
Step 1 ExampleA
Source TOC
(mg/L)
8.26.16.2
BSource
Alk. (mg/L)
707580
CRequired TOCRemoval (%)
40.035.035.0
DTreated TOC
(mg/L)
4.64.04.4
E%
Removed(A-D)/A
43.934.429.0
MonthOct.Nov.Dec.Jan.Feb.Mar.Apr.MayJun.Jul.Aug.Sep.
FE/C
1.150.961.311.120.991.231.451.181.001.100.980.83Since average is
1.00, the system is in
compliance
sum column (F) = 13.30 13.33/12= 1.11
DBP Precursors (DBPP)

83
Alternative Compliance Criteria
1. RAA of monthly source water TOC samples < 2.0 mg/L
2. RAA of monthly treated water TOC samples < 2.0 mg/L
3. RAA of source water TOC < 4.0 mg/L, RAA of source water alkalinity > 60 mg/L, and either:
• TTHM RAA < 0.040 mg/L and HAA5 RAA < 0.030 mg/L
• OR System has made a “clear and irrevocable commitment” to installing technology to limit TTHM & HAA5 to those levels
4. TTHM RAA < 0.040 mg/L and HAA5 RAA < 0.030 mg/L, and system uses only chlorine for primary disinfection and maintenance of a residual
DBP Precursors (DBPP)
84
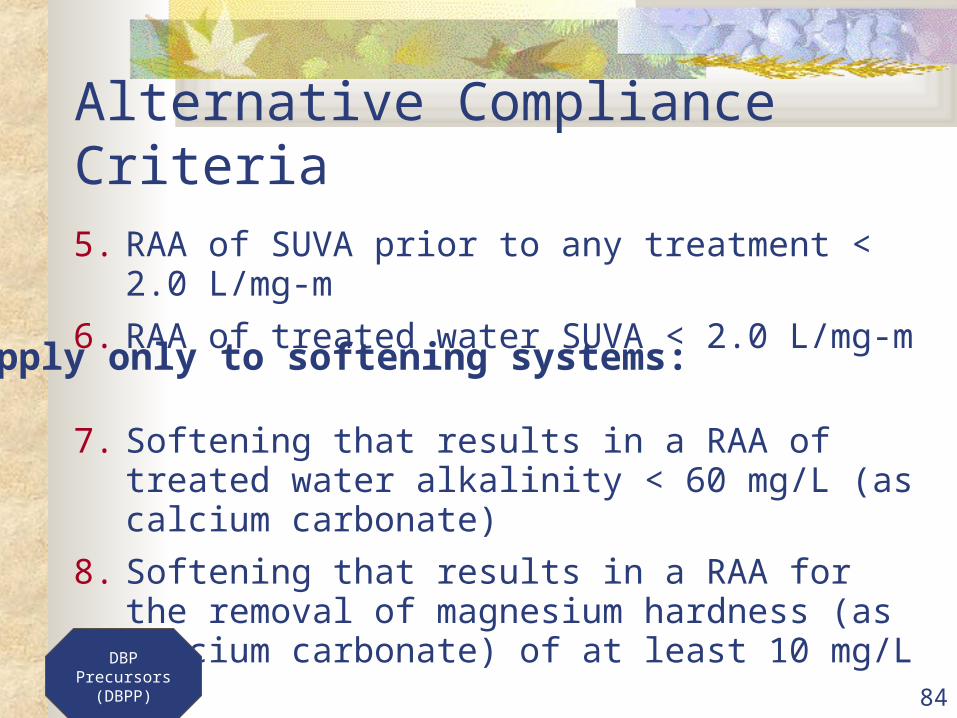
Alternative Compliance Criteria
5. RAA of SUVA prior to any treatment < 2.0 L/mg-m
6. RAA of treated water SUVA < 2.0 L/mg-m
7. Softening that results in a RAA of treated water alkalinity < 60 mg/L (as calcium carbonate)
8. Softening that results in a RAA for the removal of magnesium hardness (as calcium carbonate) of at least 10 mg/L
DBP Precursors (DBPP)
Apply only to softening systems:

85
Step 2 TOC Removal
If a system cannot meet Step 1 removal levels or an alternative compliance criteria, the state can set an alternate minimum TOC removal level (Step 2 removal level)
Compliance calculations are the same, except that systems would use the alternate minimum required removal percentage to calculate their removal ratio
DBP Precursors (DBPP)

86
Step 2 TOC Removal: Determining alternate minimum TOC removal Provide data to the state as evidence that the system cannot
meet the requirements of Step 1 TOC removal Include the results of bench or pilot testing
• Perform Jar Testing: add 10 mg/L increments of alum
• Continue adding alum until pH Step 2 target pH
• Add coagulant until TOC removal 0.3 mg/L for an incremental addition of 10 mg/L of alum or ferric salt at the target pH level
• The percentage of TOC removed at this level will become your “TOC removal vs. coagulant dose” and the system’s minimum TOC removal requirement.
The state will determine an alternate removal level
DBP Precursors (DBPP)

87
Step 1 & 2: Compliance Reporting Reports must be submitted quarterly:
• The number of paired (source water and treated water) samples collected during the last quarter
• The location, date, and results of each paired sample and associated alkalinity taken during the last quarter
• For each month in the reporting period, the arithmetic average of the percent reduction of TOC for each paired sample and the required TOC percent removal
• Calculations for determining compliance with the TOC percent removal requirements
• Whether the system is in compliance with the enhanced coagulation or enhanced softening percent removal requirements for the last four quartersDBP Precursors
(DBPP)

88
PN Rule Requirements A system is out of compliance if it does not comply with
the Step 1 or Step 2 removal requirements and fails to meet an alternative compliance criterion
Notify customers within 30 days
Send a copy of PN to the state within 10 days of notifying customers
If a system commits a monitoring violation, it must inform the state and its customers
Tier 2: Notify the state within 48 hours of the violation!
DBP Precursors (DBPP)

89
Returning to Compliance
Options for systems with compliance problems:
• BATs
• Source water changes
• Partnership with other system(s)
• Modify treatment
DBP Precursors (DBPP)

Poll: How many people are attending at your Poll: How many people are attending at your location?location? [PlaceWare Multiple Choice Poll. Use PlaceWare > Edit Slide Properties... to
edit.]
1 Person 2 - 4 People 5 - 10 People 10 - 20 People More than 20 People

91
Questions?
Please send your questions & comments via the web console located on your bottom right.
Q & A

92
Case Studies: Great View
1. Where, when, & how many chlorine samples should this system take?
2. What is the system’s RAA for chlorine?
3. What is the system required to report to the state within 10 days?
4. Where, when, & how many TTHM & HAA5 samples should this system take?
5. What is the system’s RAA for TTHMs?Case Studies
GW System, serving 300,
taking quarterly TCR samples

93Case Studies
Oct 2006: 1.5 mg/LSept 2006: 1.0 mg/L Aug 2006: 1.0 mg/LJuly 2006: 1.5 mg/LJune 2006: 3.0 mg/LMay 2006: 1.0 mg/L
April 2006: 2.0 mg/LMarch 2006: 1.5 mg/L
Feb 2006: 1.0 mg/LJan 2006: 1.5 mg/LDec 2005: 1.0 mg/LNov 2005: 1.0 mg/L
Chlorine Results for last 12 months:
2006: 0.070 mg/L2005: 0.040 mg/L
TTHM Results for last 2 years:
GW System, serving 300,
taking quarterly TCR samplesCase Studies: Great View

Poll: Where, when, & how many chlorine Poll: Where, when, & how many chlorine samples should this s...samples should this s... [PlaceWare Multiple Choice Poll. Use PlaceWare > Edit Slide Properties... to
edit.]
One per year at MRT Five samples per month and taken 25% at MRT and
75% at ART The same number and at the same time and place as
TCR

95
Answer
Where, when, & how many chlorine samples should this system take?
• The same number and at the same time and place as TCR
GW System, serving 300,
taking quarterly TCR samples
Case Studies
Poll: What is the system’s RAA for Poll: What is the system’s RAA for chlorine?chlorine? [PlaceWare Multiple Choice Poll. Use PlaceWare > Edit Slide Properties... to
edit.]
1.2 mg/L 1.4 mg/L 1.6 mg/L None of the above

97
Answer
What is the system’s RAA for chlorine?
• 1.4 mg/L
• 1 + 1 + 1.5 + 1 + 1.5 + 2 + 1 + 3 + 1.5 + 1 + 1 + 1.5 = 17
• 17/12 = 1.4 mg/L
GW System, serving 300,
taking quarterly TCR samples
Case Studies

Poll: What is the system required to report to Poll: What is the system required to report to the state wit...the state wit... [PlaceWare Multiple Choice Poll. Use PlaceWare > Edit Slide Properties... to
edit.]
Number of samples taken during each month of the last quarter
The monthly arithmetic average of all samples taken in each month for the last 12 months
The arithmetic average of the monthly averages for the last 12 months and whether the MRDL was violated
All of the above

99
Answer
What is the system required to report to the state within 10 days?
• All of the above
GW System, serving 300,
taking quarterly TCR samples
Case Studies

Poll: Where, when, & how many TTHM & Poll: Where, when, & how many TTHM & HAA5 samples should thi...HAA5 samples should thi... [PlaceWare Multiple Choice Poll. Use PlaceWare > Edit Slide Properties... to
edit.]
1 sample per treatment plant; in the month of warmest water temperature; at the MRT
September at the entry point to the distribution system The same number and at the same time and place as
TCR 5 samples per month; 25% at MRT and 75% at ART

101
Answer
Where, when, & how many TTHM & HAA5 samples should this system take?
• 1 sample per treatment plant; in the month of warmest water temperature; at the MRT
GW System, serving 300,
taking quarterly TCR samples
Case Studies
Poll: What is the system’s RAA for Poll: What is the system’s RAA for TTHMs?TTHMs? [PlaceWare Multiple Choice Poll. Use PlaceWare > Edit Slide Properties... to
edit.]
0.040 mg/L 0.055 mg/L 0.070 mg/L None of the above

103
Answer
What is the system’s RAA for TTHMs?
• 0.070 mg/L
GW System, serving 300,
taking quarterly TCR samples
Case Studies

104
Case Studies: Smithville
1. How many chlorine samples should this system take in August 2005?
2. Where and when should the system take chlorine samples?
3. Where, when, & how many TTHM & HAA5 samples should the system take?
4. What is the system’s RAA for TTHMs & HAA5?
5. Does the system have to perform public notification?
6. What does the system need to do to return to compliance?
Case Studies
GW System, serving 11,000, taking monthly
TCR samples due to TC + in July 05

105
Case Studies: Smithville
Case Studies
Q3 2010: 0.09
Q2 2010: 0.05
Q1 2010: 0.08
Q4 2009: 0.04
Q3 2009: 0.04
Q2 2009: 0.08
Q1 2009: 0.06
Q4 2008: 0.07
TTHM Results for last 8 quarters:
Q3 2010: 0.07
Q2 2010: 0.08
Q1 2010: 0.07
Q4 2009: 0.09
Q3 2009: 0.04
Q2 2009: 0.08
Q1 2009: 0.06
Q4 2008: 0.07
HAA5 Results for last 8 quarters:
GW System, serving 11,000, taking monthly
TCR samples due to TC + in July 05
8,501-12,900 10 Samples
Required Routine TCR Monitoring

Poll: How many chlorine samples should Poll: How many chlorine samples should this system take in A...this system take in A... [PlaceWare Multiple Choice Poll. Use PlaceWare > Edit Slide Properties... to
edit.]
15 samples 10 samples 5 samples 1 sample

107
Answer
How many chlorine samples should this system take in August 2005?
• 10 samples – The same as the number of TCR samples required.
GW System, serving 11,000, taking monthly
TCR samples due to TC + in July 05
Case Studies

Poll: Where and when should the system Poll: Where and when should the system take chlorine samples...take chlorine samples... [PlaceWare Multiple Choice Poll. Use PlaceWare > Edit Slide Properties... to
edit.]
In the month of warmest water temperature at the MRT
25% at MRT and 75% at ART Same time and place as TCR Quarterly at MRT

109
Answer
Where and when should the system take chlorine samples?
• Same time and place as TCR
GW System, serving 11,000, taking monthly
TCR samples due to TC + in July 05
Case Studies

Poll: Where, when, & how many TTHM & Poll: Where, when, & how many TTHM & HAA5 samples should thi...HAA5 samples should thi... [PlaceWare Multiple Choice Poll. Use PlaceWare > Edit Slide Properties... to
edit.]
1 sample per treatment plant; in the month of warmest water temperature; at the MRT
1 sample per treatment plant per quarter at MRT The same number and at the same time and place as
TCR 5 samples per month; 25% at MRT and 75% at ART

111
Answer
Where, when, & how many TTHM & HAA5 samples should this system take?
• 1 sample per treatment plant per quarter at MRT
Case Studies
GW System, serving 11,000, taking monthly
TCR samples due to TC + in July 05

Poll: What is the system’s RAA for TTHMs Poll: What is the system’s RAA for TTHMs & HAA5?& HAA5? [PlaceWare Multiple Choice Poll. Use PlaceWare > Edit Slide Properties... to
edit.]
TTHM = 0.085 mg/L & HAA5 = 0.046 mg/L TTHM = 0.013 mg/L & HAA5 = 0.02 mg/L TTHM = 0.065 mg/L & HAA5 = 0.078 mg/L None of the above

113
Answer
What is the system’s RAA for TTHMs & HAA5?
• TTHM = 0.065 mg/L & HAA5 = 0.078 mg/L TTHMs RAA
• 0.09 + 0.05 + 0.08 + 0.04 = 0.26
• 0.26/4 = 0.065 mg/L
HAA5s RAA
• 0.07 + 0.08 + 0.07 + 0.09 = 0.31
• 0.31/4 = 0.078 mg/L
GW System, serving 11,000, taking monthly
TCR samples due to TC + in July 05
Case Studies

Poll: Does the system have to perform Poll: Does the system have to perform public notification?public notification? [PlaceWare Multiple Choice Poll. Use PlaceWare > Edit Slide Properties... to
edit.]
Yes No

115
Answer
Does the system have to perform public notification?Does the system have to perform public notification?
• YesYes MCL violation because the HAA5 RAA of 0.078
mg/L exceeds the MCL of 0.060 mg/L
GW System, serving 11,000, taking monthly
TCR samples due to TC + in July 05
Case Studies

Poll: What does the system need to do to Poll: What does the system need to do to return to complianc...return to complianc... [PlaceWare Multiple Choice Poll. Use PlaceWare > Edit Slide Properties... to
edit.]
RAA in following quarter needs to be equal to or less than 0.060 mg/L
System needs to monitor for 1 year RAA in the following month needs to be equal to or
less than 0.060 mg/L

117
Answer
What does the system need to do to return to compliance?
• RAA in following quarter needs to be less than 0.060 mg/L
GW System, serving 11,000, taking monthly
TCR samples due to TC + in July 05
Case Studies

118
Case Studies: Crystal Lake
1. Where, when, & how many chlorine samples should this system take?
2. What is the system’s RAA for chlorine?
3. Where, when, & how many TTHM & HAA5 samples should the system take?
4. What is the system’s RAA for TTHMs & HAA5?
5. What is the system’s required TOC removal percentage, actual TOC removal percentage, and actual TOC removal ratio?
6. Does the system need to perform public notification?
SW System, serving 550.
System has two conventional
filtration plants
Case Studies

119
Case Studies: Crystal Lake
Case Studies
SW System, serving 550.
System has two conventional
filtration plants
Aug 2007: 1.0
July 2007: 1.5
June 2007: 2.0
May 2007: 2.0
April 2007: 1.0
March 2007: 1.5
Feb 2007: 2.0
Jan 2007: 1.0
Dec 2006: 1.0
Nov 2006: 1.5
Oct 2006: 5.0
Sept 2006: 1.5
Aug 2006: 1.0
July 2006: 1.5
June 2006: 2.0
May 2006: 1.0
April 2006: 3.0
March 2006: 1.5
Feb 2006: 2.0
Jan 2006: 1.5
Dec 2005: 1.0
Nov 2005: 2.0
Oct 2005: 0.5
Sept 2005: 1.0
Chlorine Results for last 24 months:
Source Water Alkalinity 65 mg/L
Source Water TOC 9.0 mg/L
Treated Water TOC 4.0 mg/L
For this example sample set results are the same for each month and are:

120
Case Studies: Crystal Lake
Case Studies
SW System, serving 550.
System has two conventional
filtration plants
0.09
0.05
0.03
0.02
0.04
0.08
0.06
0.07
0.02
0.05
0.03
0.02
TTHM Results for last 6 quarters:
MRT Plant 1
MRT Plant 2
0.02
0.08
0.04
0.02
0.04
0.08
0.04
0.02
0.04
0.08
0.06
0.07
HAA5 Results for last 6 quarters:
MRT Plant 1
MRT Plant 2
Q2 2007
Q1 2007
Q4 2006
Q3 2006
Q2 2006
Q1 2006

Poll: Where, when, & how many chlorine Poll: Where, when, & how many chlorine samples should this s...samples should this s... [PlaceWare Multiple Choice Poll. Use PlaceWare > Edit Slide Properties... to
edit.]
Four per year in month of warmest water temperature 75% at ART and 25% at MRT
Five samples per month and taken 25% at MRT and 75% at ART
The same number and at the same time and place as TCR
None of the above

122
Answer
Where, when, & how many chlorine samples should this system take?
• The same number and at the same time and place as TCR
Case Studies
SW System, serving 550.
System has two conventional
filtration plants

Poll: What is the system’s RAA for Poll: What is the system’s RAA for chlorine?chlorine? [PlaceWare Multiple Choice Poll. Use PlaceWare > Edit Slide Properties... to
edit.]
1.6 mg/L 1.8 mg/L 2.0 mg/L None of the above

124
Answer
What is the system’s RAA for chlorine?
• 1.8 mg/L
• 1 + 1.5 + 2 + 2 + 1 + 1.5 + 2 + 1 + 1 + 1.5 + 5 + 1.5 = 21
• 21/12 = 1.8 mg/L
Case Studies
SW System, serving 550.
System has two conventional
filtration plants

Poll: Where, when, & how many TTHM & Poll: Where, when, & how many TTHM & HAA5 samples should thi...HAA5 samples should thi... [PlaceWare Multiple Choice Poll. Use PlaceWare > Edit Slide Properties... to
edit.]
1 sample per treatment plant; in the month of warmest water temperature; at the MRT
1 sample per treatment plant per quarter at MRT The same number and at the same time and place as
TCR 5 samples per month; 25% at MRT and 75% at ART

126
Answer
Where, when, & how many TTHM & HAA5 samples should this system take?
• 1 sample per treatment plant per quarter at MRT
Case Studies
SW System, serving 550.
System has two conventional
filtration plants

Poll: What is the system’s RAA for Poll: What is the system’s RAA for TTHMs & HAA5?TTHMs & HAA5? [PlaceWare Multiple Choice Poll. Use PlaceWare >
Edit Slide Properties... to edit.] TTHMs = 0.085 mg/L; HAA5 = 0.095 mg/L TTHMs = 0.049 mg/L; HAA5 = 0.043 mg/L TTHMs = 0.035 mg/L; HAA5 = 0.023 mg/L
128
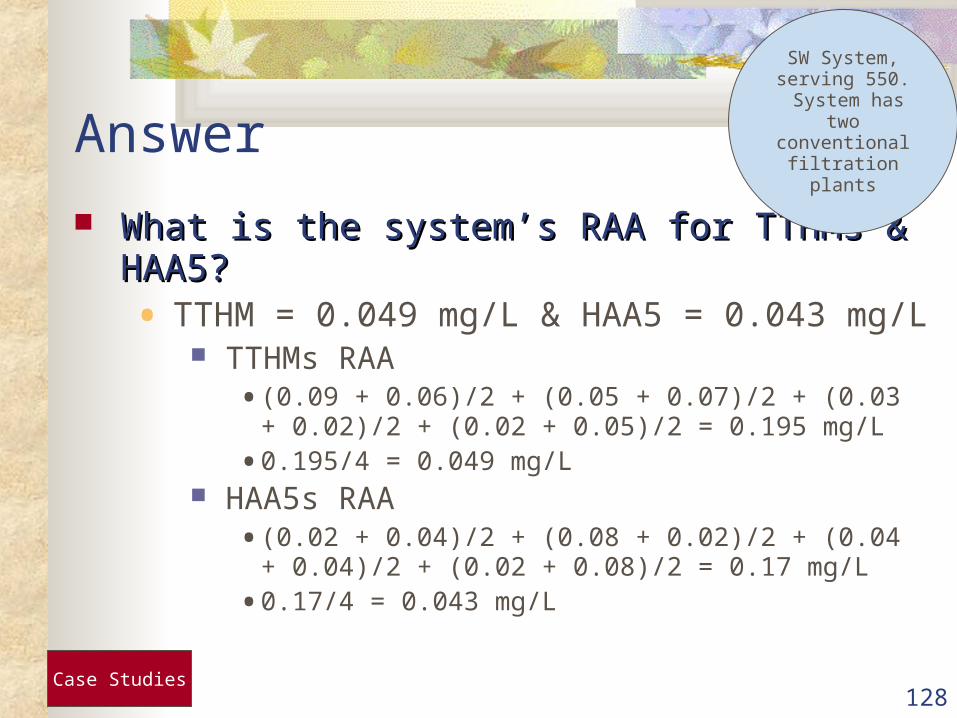
Answer
What is the system’s RAA for TTHMs & HAA5?What is the system’s RAA for TTHMs & HAA5?
• TTHM = 0.049 mg/L & HAA5 = 0.043 mg/L TTHMs RAA• (0.09 + 0.06)/2 + (0.05 + 0.07)/2 + (0.03 + 0.02)/2 + (0.02 +
0.05)/2 = 0.195 mg/L
• 0.195/4 = 0.049 mg/L HAA5s RAA• (0.02 + 0.04)/2 + (0.08 + 0.02)/2 + (0.04 + 0.04)/2 + (0.02 +
0.08)/2 = 0.17 mg/L
• 0.17/4 = 0.043 mg/L
Case Studies
SW System, serving 550.
System has two conventional
filtration plants

Poll: What is the system’s required TOC Poll: What is the system’s required TOC removal percentage, ...removal percentage, ... [PlaceWare Multiple Choice Poll. Use PlaceWare > Edit Slide Properties... to
edit.]
40%; 55.6%; 1.39 45%; 22.5%; 0.5 15%; 50%; 3.33 30%; 40%; 1.33
130
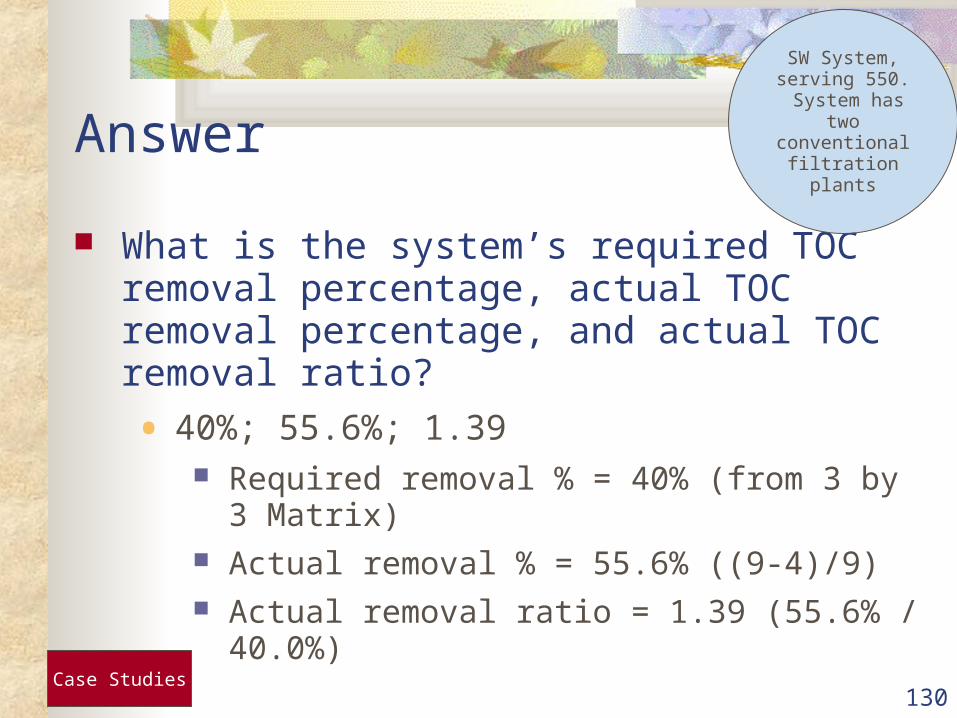
Answer
What is the system’s required TOC removal percentage, actual TOC removal percentage, and actual TOC removal ratio?
• 40%; 55.6%; 1.39 Required removal % = 40% (from 3 by 3 Matrix) Actual removal % = 55.6% ((9-4)/9) Actual removal ratio = 1.39 (55.6% / 40.0%)
Case Studies
SW System, serving 550.
System has two conventional
filtration plants
Poll: Does the system need to perform Poll: Does the system need to perform public notification?public notification? [PlaceWare Multiple Choice Poll. Use PlaceWare > Edit Slide Properties... to
edit.]
Yes No
132
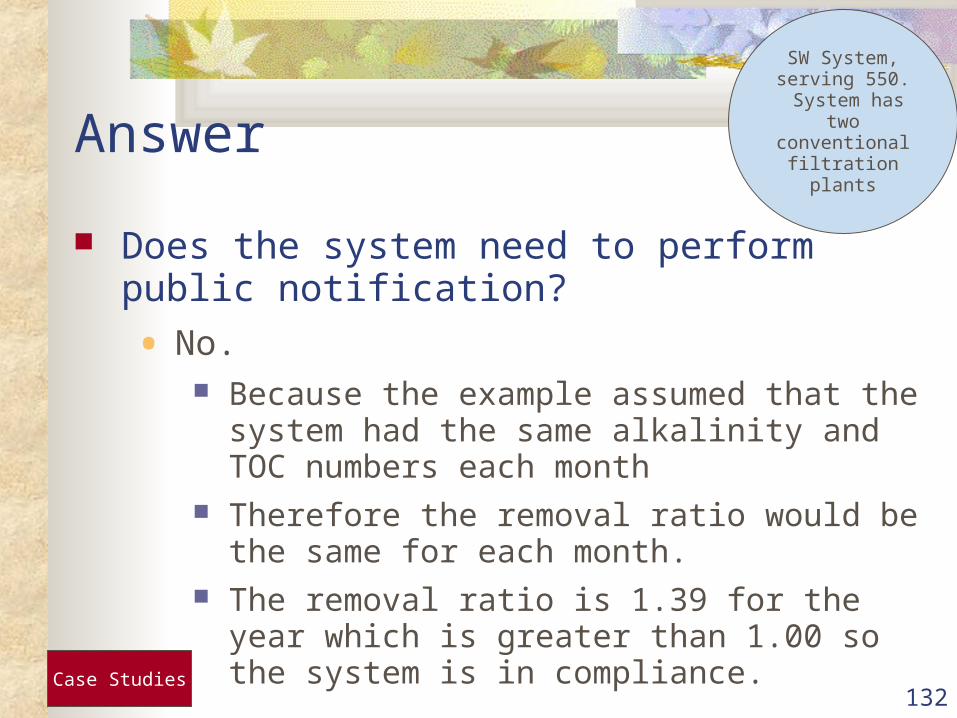
Answer
Does the system need to perform public notification?
• No. Because the example assumed that the system had the
same alkalinity and TOC numbers each month Therefore the removal ratio would be the same for
each month. The removal ratio is 1.39 for the year which is greater
than 1.00 so the system is in compliance.
Case Studies
SW System, serving 550.
System has two conventional
filtration plants

133
Upcoming Regulations
Expected final in December 2005
• Stage 2 DBPR
• LT2ESWTR
• Ground Water Rule
Stage 2

134
Stage 2 DBPR Preview
Applies to CWSs and NTNCWSs Consecutive Systems Designed to reduce peak DBP concentrations Proposed changes to TTHM and HAA5 requirements:
• Monitoring locations
• Method of calculating RAA Importance of data and knowledge from Stage 1
DBPR!
Stage 2

Poll: Does your state require consecutive Poll: Does your state require consecutive systems to comply ...systems to comply ... [PlaceWare Multiple Choice Poll. Use PlaceWare > Edit Slide Properties... to
edit.]
No requirements Monitor and comply independently Monitor as part of a combined distribution system
independently or as part of the combined system
136
Evaluation Form Available in the Handouts Sent to Your Site
Coordinator Please Complete and Then…
• Fax Directly (fax number on the form) or email to [email protected]
Join us for Consumer Confidence Report Web cast Training
Wednesday, May 25, 2005, 2 – 4 PM
Join us for Consumer Confidence Report Web cast Training
Wednesday, May 25, 2005, 2 – 4 PM
Don’t Forget
Additional Resources

137
Questions?
Please send your questions & comments via the web console located on your bottom right.
Q & A
138
Additional Stage 1 DBPR Resources
for Further Study of the Federal Rule

139
Stage 1 DBPR Webcast Materials
Drinking Water Academy Web site: www.epa.gov/safewater/dwa.html
Available – May 16, 2005
• Web cast Presentation Slides
• Written Q&A from Web cast
Additional Resources

140
Additional Stage 1 DBPR Resources
Quick Reference Guides:
• Stage 1 DBPR Rule (EPA 816-F-01-010)
• State 1 DBPR Laboratory Quick Reference Guide (EPA 816-F-02-021)
Technical guidance documents:
• Alternative Disinfectants and Oxidants Guidance Manual (EPA 815-R-99-014)
• Disinfection Profiling and Benchmarking Guidance Manual (EPA 815-R-99-013)
• Enhanced Coagulation and Enhanced Precipitative Softening Guidance Manual (EPA 815-R-99-010)Additional
Resources

141
EPA Resources Available Implementation guidance documents:
• Stage 1 DBPR Final Implementation Guidance
(EPA 816-R-01-012)
• Stage 1 DBPR Plain English Guidance
(EPA 816-R-01-014)
• General M-DBP Fact Sheet
(EPA 816-F-01-012)
• Profiling and Benchmarking Fact Sheet
(EPA 816-F-98-0176)
• Stage 1 DBPR Fact Sheet
(EPA 816-F-01-014) A Small System Guide to the Stage 1 DBPR (in development)
Additional Resources
142
EPA Resources Available
All documents available through EPA’s M-DBP Web site or by calling the Safe Drinking Water Hotline:
• http://www.epa.gov/safewater/mdbp/implement.html
• 1-800-426-4791
Additional Resources

143
For More Questions
Send Your State’s Stage 1 Questions or Situations to:
• Stage 1 DBPR Questions: Call your EPA Regional Office or Ed Moriarty, US EPA HQ 202-564-3864
Additional Resources
144
Next Webcast: Consumer Confidence Report Wednesday, May 25, 2005, 2 – 4 PM (EST)
• Topics to be covered: Report Content Overview Interpreting and Reporting Data Reviewing CCR for Compliance Risk Communication Overview CCRiWriter Demonstration
Additional Resources

145
Webcast Series See Handout or DWA Calendar for Upcoming 2005
Web casts
• http://www.epa.gov/safewater/dwa/calendar.html Future Web casts will:
• Cover a Variety of Subjects and Rules
• Be Held Last Wednesday of the Month from 2-4 PM (Eastern Time)
• Have the Same Registration Process as for Stage 1 DBPR
• Will Open for Registration Six Weeks Prior to Each Webcast
Additional Resources