Embed Size (px)
Citation preview

1
Identifying Students At-Risk for Dropping Out of High School: Overview of a Tool for
Developing Early Warning Systems
April 10, 2009Governor Lynch’s Dropout Prevention Summit
Concord, New Hampshire
Jessica Heppen, Ph.D.Susan Bowles Therriault, Ed.D.
National High School Center

2
Serve as the central source of research and information on high school improvement for the Regional Comprehensive Centers
Identify, summarize and disseminate information on:
latest research and innovations
useful programs, tools, and products
high-quality technical assistance relating to high schools and their diverse student populations
Build capacity of RCCs to promote and support high school improvement at all levels
National High School Center Mission

3
True/ False Quiz
Nearly one-third of all high school students leave the public school system before graduating.
T F
1.2 million students drop out of high school each year – a projected 12 million over the next decade.
T F
Fifteen percent of U.S. high schools produce 50 percent of the country’s dropouts.
T F
It is hard to acquire good data that can predict whether a student is likely to drop out of high school.
T F

4
This Presentation
Overview of early warning systems to identify potential high school dropouts Background on academic indicators of high school
dropout
Lessons from research on “high yield” academic indicators
Demonstration of data tool - Building EWS in schools
Building EWS at the district level
Resources for information on research-based dropout prevention interventions

5
Ninth Grade is a Critical Year
Ninth grade is a “make or break year”
More students fail 9th grade than any other grade in high school
A disproportionate number of students who are held back in 9th grade subsequently drop out
By the end of 9th grade or even during the first semester, powerful indicators exist that can predict whether students will complete high school
Engagement
Course performance
“On-Track” Indicator
Herlihy, C. (2007). State and district-level supports for successful transition into high school. Washington, DC: National High School Center.
Allensworth, E., & Easton, J.Q. (2007). What matters for staying on-track and graduating in Chicago Public High Schools: A close look at course grades, failures and attendance in the freshman year. Chicago: Consortium on Chicago School Research.
6
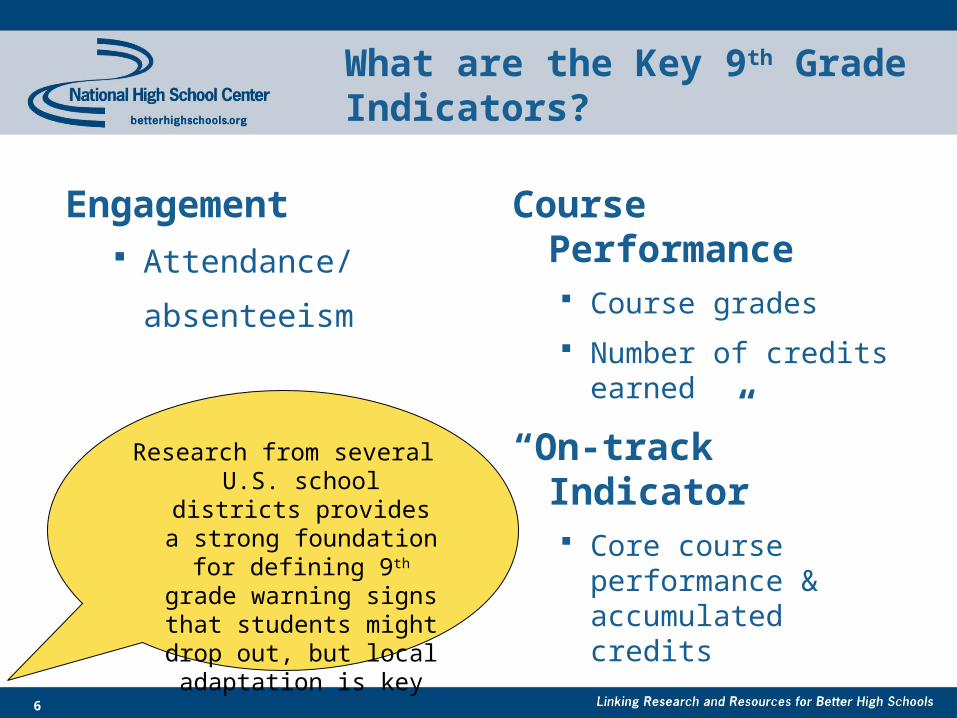
What are the Key 9th Grade Indicators?
Course Performance Course grades
Number of credits earned
“On-track” Indicator Core course
performance & accumulated credits
Engagement Attendance/
absenteeism
Research from several U.S. school districts provides a
strong foundation for defining 9th grade warning signs that students might
drop out, but local adaptation is key

7
“High-Yield” Academic Indicators: Attendance
0-4 5-9 10-14 15-19 20-24 25-29 30-34 35-39 40+0%
20%
40%
60%
80%
100%
87%
63%
41%
21%
9%5%
2% 1% 0%
Four-Year Graduation Rates for CPS Students Entering High School in 2001, by 9th Grade Absences (Allensworth & Easton, 2007)
Days Absent Per Semester (Course Cutting Counted as Partial Days)
Pe
rce
nt
Gra
du
ate
d i
n F
ou
r Y
ea
rs

8
“High-Yield” Academic Indicators: Course Failures
0 1 2 3 4 5 6 7 8 More than 8
0%
20%
40%
60%
80%
100%
85%
70%
55%
42%
33%
25%
13% 11%7%
2%
Four-Year Graduation Rates for CPS Students Entering High School in 2001, by Freshman Course Failures (Allensworth & Easton, 2007)
Semester Course Failures
Pe
rce
nt
Gra
du
ate
d i
n F
ou
r Y
ea
rs

9
“High-Yield” Academic Indicators: GPA
0.0 0.5 1.0 1.5 2.0 2.5 3.0 3.5+0%
20%
40%
60%
80%
100%
1%6%
28%
53%
72%
86%
93%97%
Four-Year Graduation Rates for CPS Students Entering High School in 2001, by Freshman GPA (Allensworth & Easton, 2007)
Freshman GPA
Pe
rce
nt
Gra
du
ate
d i
n F
ou
r Y
ea
rs

10
“High Yield” 9th Grade Indicators
Indicators Benchmark (red flag)
Absenteeism Missing 10% or more of instructional time
Course failures One or more failed course(s)
Grade point average 2.0 or lower (on a 4-point scale)
“On-track” Fail two or more semester core courses, or accumulate fewer credits than the number required for promotion to the 10th grade

11
On-Track Indicator
Source: Allensworth & Easton (2005)

12
“High Yield” 9th Grade Indicators
Indicators Benchmark (red flag)
Absenteeism Missing 10% or more of instructional time
Course failures One of more failed course
Grade point average
2.0 or lower (on a 4-point scale)
“On-track” Fail two or more semester core courses, or accumulate fewer credits than the number required for promotion to the 10th grade

13
Building Early Warning Systems in High Schools
Demonstration of simple tool designed to help high schools use data they already have for dropout prevention
http://www.betterhighschools.org/pubs/ews_guide.asp
http://www.betterhighschools.org/pubs/EWStool.xls

14
The District Rolein Developing Early Warning Systems
to Identify Potential Dropouts
Readiness Identification Local Adaptation

15
The District Role: Readiness
Taking inventory of readily available data and data elements collected
Developing tools for use by district and school to support the key elements of the warning system Data Collection
Data elements Data systems Accessibility of data
Training staff Data analysis for identifying key indicators Using the early warning systems tool

16
The District Role: Identification
Identifying areas of need (e.g., schools, student subgroups)
Targeting resources to support schools intervention strategies for at-risk students collaboration among high schools across the
district or region

17
The District Role: Targeting Resources
Identifying critical areas, districts, high schools in need
Allocating resources based on district/school need
Using aggregate on-track rates from high schools or a promoting power index (Balfanz & Legters, 2004) to identify “drop-out factories” (http://www.msnbc.msn.com/id/21532193)

18
The District Role: Local Adaptation
Conducting data analysis for the local context Vertical analysis Historical analysis Persistent problems Continuous analysis
Resource: Jerald, C. (2006). Identifying potential dropouts: Key lessons for building an early warning data system. Washington, DC: Achieve, Inc. (http://www.achieve.org/files/FINAL-dropouts_0.pdf)

19
Questions for Analysis
What percentage of students with each risk factor (or combination)…
1. Dropped Out?
2. Graduated (in 4 or 5 years)?
What percentage of students without each risk factor (or combination)…
3. Dropped out?
4. Graduated (in 4 or 5 years)?
Local Adaptation

20
Local Adaptation
Displayed Early Warning Sign in 9th Grade?Graduated in 4
(or 5) Years? YES NO
YES False Positive(or EffectiveIntervention)
AccuratePrediction
NO AccuratePrediction False Negative

21
Dropout Prevention Strategies

22
Dropout Prevention Strategies
http://www.betterhighschools.org/docs/NHSC_ApproachestoDropoutPrevention.pdf

23
Dropout Prevention Strategies
Example Programs that Incorporate
Attendance and Behavior Monitoring: ALAS Check and Connect Coca-Cola Valued Youth Program Positive Behavioral
Interventions & Supports (PBIS) Talent Development High School Teen Outreach Program (TOP)
Attendance and Behavior Monitoring
Focus on Achievement in Core Courses
Tutoring as an Academic Support
Counseling and Mentoring
Small Learning Communities
Content Recovery Courses (Catch-up courses)
Advisories and Team Teaching
Ninth Grade Transition Programs
Partnerships between High Schools and Feeder Middle Schools
Support for Students with Disabilities Outside of School
Tiered Approaches
Career and College Awareness
Community Engagement
Family Engagement

24
Discussion Questions
1. What are the ways that you use data in your schools to identify at-risk students?
2. What challenges have you experienced or do you anticipate with integrating data systems for reporting, accountability, and intervention/prevention?
3. What systems do you currently use to allocate resources for dropout prevention in your school?
4. Are there other indicators that you suspect are as powerful or more powerful than those we’ve highlighted?
25
For more information from the National High School Center on Dropout
Prevention and Early Warning Systems:
http://www.betterhighschools.org/topics/DropoutWarningSigns.asp