Embed Size (px)
Citation preview
...-. .-—- -- .. T.. ..-,! ,.. .,
,’ ...._
;,, . ..” -‘, ,.
‘... ,- ., N ‘, :“ ,,.’),1- .!
,,” ,’.””., ,,---
I “’”“- “--
,,/,. I SERIAL ANb.,,SSC44
.,,,-, ,’.
!, .4-Jpy#’25 ‘( ~~,, ,,.‘),,’,
PROGRESS” “REPORT. .1, ‘, , -- .,’ ,,” ,,. .,. ‘1”.,..
ON”, ,,. .
,. .,, ,.l., !... ,,. ”
.---, ”...,,
............-,..~.
:, ,. ,. f,--
: iHE,i33~EcTS w. wxml AND TH1@NESs ON sTREiiTii,, -----: ENEIiGY- ABSOR~TION, AND TRANSITION TEMPERATURE l?OR
‘,. - INTERNALLY ~0.TCHED FLAT ST~EL PLATES1,
.!,‘! ,,,!. J,I .,,; . “’ ~
i,
). \.,
,,!.
,, ,‘, ,.. ,’
‘, ...
I ,. ,,1.! ,BY,’” ,,.. ““
{.”,. .,“1’ ‘“” ““ ‘ ‘“”.
,,. ‘SAMUEL T.”,,CMPENTER WiNDELL P. Itoop, A. ,y: ZELL; x. KASTEN/,:, )
, \; .. ,.
. . ;’ ,,,..’
,, ,’,’!!’ SWARTHMORE COLLEGE ~~.-.’” .1’,“ i., Under khmeau of ShipE Ccm@ct NObs45521I,-’,
,’,(tidex” No.” NSO1/-O43)
. ,’,’--’,. . .. 1,-, \- ,i1-\:,
,,/“’ !..,,-
1<”””,
, ,, ‘.,..,’”,, ,/,.
,,.
<,’-
,’ ), ,,,.,I ,“,
!, ,’, ,” ,! ,.,’~
,. ,(”,“\ ,“
-,’,“; - .!,
‘.1 ,. ,’ ,’‘, .“ \
,. ‘Tmnmnlttcdthrokgh ~I ..
,,, NATIONAL RESEARCH COUNCIL’S’ “’,. ., ,. . . .. ... ,,,.
1, .: ‘COMMITTEE ON SHIP ‘SiEEL
\
---.“,:.,,,./ .-q -,,
‘,”’
..),, >’ 1.’Aduisorafo,’’,/’,“, .) ,., ,.
‘\. .’.,’,.. ““‘SHIP” STRU$TURd COMMIiTEEi,,
~. ,,,-. 1.” 1,
,.,-, unchr ~.,‘,. , >-,’
Bureau of Shi~s, ?lavy Department, ..
I
,. \;. : -Contract. NOb&60148”... . “11’.’. (Index No. kS73k036):, !,\
1
,’
; ,,
,,!,!
.,.
. . . .
1’
!
..T,.$ . ‘,
,,, ,... ,, -,’
,,.’ ,.
‘1,, ,..
.,
!. ’-,..“1 ,,
1.
....’ .,’, , !,,’
!“, ,>.,.1. ..,.., .’
I., .,,!
..,. ,,:1
.,1, f,’
,, .,,..’,
1’
.,, ” ,-,.,,, l.- ,.
)! ,!’. 1. ,. .’, .,-,
,. ., Division of- Enghuw$ng and Industrial It&arch1-,,’,’ ,,;
l,i,”\ ‘,’ ~ Natioiyl R&ear* ,Couyil),,,, ,,. !.’l, Wa~hington, D. G:1“ ,’ ,. ’..., 1’.
,,
‘1November, 15, “1951 ‘I,--- ,’,,,
I
,. -,. ....’
,-
,. -__..., . . ..._ —.—- ...
NATIONAL RESEARCH COUNCIL2101CONSITTLJ~ONAVENUE, WASHINGTON 25,D.C.
COMMITTEE ON SHIP STEEL
OF THE
DIVWJOFJOF ENGIFW=JNG AND INDUSTRIALRmz.mmz
November 15, 1951
,,
,.
CM ef, Ikzr~auof ShipsGods 343Navy DqatmentWash@#on 25, D. C,
War Sirz
A+tached is Report Serial No. SSC-44 entitled “~~Effects of Width and Thickmss on Strength, Ener~y Absorptionand Transition !!kmzperaturefor InternallyNotched Flat SteelPlates.” ThiG reyort has been submitted %y the contractoras a progress Repcrtiof the work done on Rwearch ~~~ile~tSH-lM under Contract IWE+45521, Ind@x No. ~soll-~~a h~t~~e~n
the Burmu of Ships, Navy Department and Swarthmme College.
The report has leen reviewed and acc@emce recom-mend~d by rapresmtatives of the Committee on Shi} 9teel$Division of Engimeerlng and IndustrialRQsearch, NRC,accordance with the tmms of the contramt betwem theof Ships, Navy Department and the National Academy of
Very tirulyyours,
peter E. Kyle, t%aimm
Cmmitteti cm ship steel
.
Advisor~tothe SHD? STRUCTURE COMMITTEE, a comtnittee representing thecombined research actititiesof the member agencies -
Bureau oJWips, Dept. of Navy; Military Sea Transportation Service, Dept. of Navy; United States Coast Guard, Treasury Dept.;
Maritime Ad??ainistration, De@o JCom?rwce, Amevic~w Bureou of Shipping..—
PREF+CE,
.“
The Navy Eepaitmeritthrough the--Btiew.Pfi:S:hipsisdis~rib~t’figth~~report for the SHIP STRUCTURE COIWIITTEEto those agencies and individualswho were actively associated with the resear.cb!’-worhThis ‘reportrepre-sents results of part of the research progran-i”~nductedurider the ShipStructure Committees directive to ‘tinvestigatet!aedesigu and methods ofconstruction of welded steel merchant vessels!+ , - ‘
,. ,,The distribution of this report is as,fo;llowax.,~ .. ‘
copy NO. 3 -copy No.. 4 “Copy No. 5 -copy NO. 6 -Copy No. 7 -
Copy No. !5-Copy No. 9 -Copy No. 10 -copy No. U -Copy No, 12-CopyNo. 13 -Copy No. 14 -Copy No. 15 -copy NO. 16 -Copy no. 17 -Copy No, 18 -Copy No. 19 -Copy No. 20 -copy No. 21 -Copy No. 22 -Copylb. 23 -copy No. 24 -COpy NO. 25 -COpy NO. 26 -copy No* 27 -Copyuo. 28 -copy No. 29 -
.
,!,,.,!CopyNo. 30 -
Chpy No. 31 -., “,,,. -@yNo. 32 -
Copy No. 33 -
., .. .,-
Chtef, Bureau of Ships, l~avygepartmenk . .Jj.d. ?mbey, National Waearch Cour,cil
Ship-Stru.otur#“CommitteeRear Admiral K. K. Cowart, USCG - ChairmmRear Admiral R. L. Hicksf USN~ [R~t#)j,,?Jaritim@Ad_tionRear Admiral E. W. Sylvesteri USN, W?eanof Ships ~.~Captain W. N. Mansfield~ USNR, liilitaw~ea Trans. Serv.D. P. Brown, American Bureau-of Shipping ,,
Ship Structure Subcommittee,,.
,..’“~ht, USN, Bureau’of Ships -.-ChafiMnpa tm E.A~ ~r%
~PComdr. E.A. Grantham, USN, i’vIilitary,SeaTransp@aiion Serv.Comdr. D. B. Henderson, USCG, U.S. Coast Guard.Headqu@ersLt. Comdr. M.N.P. Hinkamp,.USN~ Bureau ofShip$ -’Lt. Comdr. E.L. Perry, tECGa U.S. Coast ’GuardHeadquartersN.G. Frederick, Maritime Administration .Hubert Wmpel, Military Sea Transportation Service ;Johm Crowley, Office of Naval ResearchM. J. Letich, American Bureau of!Shipping. ‘L. C. Host,.AmericAnBureau ”ofShipping - ~E.J!.MacCutcheon,(Jr.j Bureau’of SMFsV. L. Russo, Maritime AduifiistrationFinn btmssen, Liaison Representative, NRCE. H. Davidson, Liaison Representative, AISIW. P. Gerhart, Liaison-Wpresentatiwe,.AIS1’: .Wm. Spraragen, LiaisonRepre.sentativel~C “: ,Charles Hoch, Military Sea Transportation Serv,,yW.E. Magee$ U.S. Coast Guardj Alternate Member,J.B. Robertson, Jr., U.S. Coast Guard, AltetinafieJoti Vastaj Bw-eau of Ships, AlternateMember .J. E. Walker? Bureau oflSkips, Alternate MemberEdward Wenk~ David Taylor Model Basin, Alternate.,. .:”,,.. . ..
Committee on Ship Steel.,:.,-..,:..r.,,,, ..,.1’,.., ,,., -.., .%,””‘ ‘..’,’
P. E. Kylas.Cha&mik .:”: .’ ,, -.-’ ~G. H. Herty, Jr.3 ‘+~V~cechairua~.’.:.: - “’ ~Wm. M* Baldwin, Jri-: : : i ... ,r . . ‘C- S. Barrett .“ ; .~’}. .. -
,,. ...”/ . . ,.,“
‘.../
,.,.
Alt.,Nember.,
Member
,“.:Member
.,
.-
. .
.,~! :.
copy Noe 3.4copy Noi 35-Copy-No.15’copy No. 36copy No..3?copy NO. 38Copy No. 20Copy lie.39
Copy l?o.“~oCopy No.’41
‘ COPY< N0.42
copy No. 43Copy l?o..44Copy no. 45Copy No. 46cbpy”No. 47Copy Nb,L48
““copyNd.”49:copy No~:50...Copyxo. 51COpy 1?0.52Copy No;’53copy No. 54copy No* 55copy No. 56COPY NO. 57
“w-;
Cohmittee on Ship Steel .fO”onliinued),..,;,L::,.
- R. M. Brick :.,+:..1. .,-S. L. Hoyt -,,,).*+, ,,- John Crmwley !.!, ,,,.
-Ma W. Lightner : ~~ : ‘“;~ , ,, ,,- R. F. Mehl- T. S;Washburn ‘“’“ ‘ :,,,- Finn Jonassen - Technical Director- A. Muller - Consultant .,.,.
!.’,
Members of Project Adv&ory Gom.mitteesS&93, SR-99, SR-1OO,SR-10~, SR-109,SR-11O and.SR-111 (not listed elsewhere).. ...,,,,,. ,.. . ‘. .~..--R’~:H/&horn “ . .. ‘. , ,..- E. Lq Anderson .......... ,. .,,
- Lo CgBibber.;>.
“.:.. ,- ]~~~~~~~ofi~~ ,’.-w. c. Ellis- M. Gensamer”. ‘“ ‘- N. F. Hawkes,,-W. ~iHess . “, ., . ..-W. R.’Hibbard,,Ji% .,.-’ ~ .,, ... .-C. E. Jackson .“.. , “ .:. ~~’-J. R. Low, Jr.. . . . .,
,’
- H. W. Pierce?:’.,
-W; A, Reich ‘,.. .,.-C..E~Sims . “’., ‘ , ~ r:,
-R. D. Stout’ “’- “ ,,,- J; Go’Thompson ~~ ,. ..- B. ~i J~hnston5 Nelding.R~seaTch Councils Liaison ::.- W.-H~’Wo”bd~g4 Philad@h5a’Naval Shipyard , L
,:.,,.,,.. --,:. , :., ,r,.. ... .
,,, ,’...,,.:1 : Committee on Residtil Stresses , ,’,‘ ~~~: ,,.:,
,’
,,,- t, .,,.~ ‘COPY NO. 58: J. T,’Nofion -c~air~~ ,’ -,’ ;: ~~ ,... :,”copy lso. 32 A Wm.MOJ%ldwin;.JrO “.,., .,.,:,- ,, ,,,.,,,,,,,.copy Nob “59- paU~’Ffi~ld ,:. .:.,copy fiTo.’”6o-’LeVan Griffis ,,. .’.-.Copj”NO. 61=Copy No. 62-C9py NOL;20 -,,.
COPY NO. 63 -Copy No. & *!20pyNo. 65 -Copy No. 66-Copy No. 67 -COpy NO. 68 -
K.Heindlhof& . ~~ ,.!.“l)ati&lRosenthal ‘~~!. ~ :FtnM Jonassen’- Teehnical Director .. , ..,, .,,.’ ., ,, ,,
U. S. NAVY,,. ., ,, ,.-.
Capt. R. H. Lambert, USN~ Philadelphia Naval ShipyardCapt. C. M. Tooke, ‘USNy;”lmngBea& Naval Shipyardi.CalSf.Comdr. H.’G.’Bowen, USN3.Uode’Re-3~Bweau of OrdnanceComdr. R.S~ Nandelkorn? USN; A&reedForces’Special Wea@onshj,.A. Amirikian~ Bureau of yards and:Docks “ .“‘ “,A? G. Bissell, Bureau of Ships
.- —.. .—
. 7,. . ,., ~ . ..
.,. .,:i. , ,,... . ... ,,., ‘i., “’:’:.,’‘ .: .!.: ,. ,.”
,, .+
.,, . ,-.hif~- ‘“” .’” : . , ;,, ;’;,
U. S. lla~”(Ctintinuedl ,, .,,
copy NO* 699 Jo W.”J&~ins; Bureau,Of””Ships,.)
,,copy No. 70. -” car} Hahbowerj Naval ResgaYch ~gborato~y,. ~~. ‘,”.”’Copy No’.71 - R. H.,,Raring,Naval Research Laboratbfiy,,. ,:. :,;cop}-lio. 72 - ~oahjKahn,,New York Naval Shipyard , ~~copy No* 73 - 0. T. Ilarzke,,NavqlResearch Laboiat6;y”, ;copy No. 74.- W. E’.”McKenzie,lJeta31tig@al Brafich~’Naval’Gun FactowCopy lJo.75 “ J. E; McCambridge,,”lndp$tiia2Test~$”.Lgb.?,p~la~ Nava3
Shipyard .“ .:,. ,W. E. Promisel”$Btieau of Aeronautics .,,““...COpy~’~O.76 - . ..
COPY NO. 77 - Naval Research Laboratory ‘“” “Copy No. 78 - NptialResearch Laborato&, ”lJecMnicalsection”Copy lto.79 m Naval Research Laboratory, Metallurgical S6ct~oncopy No, 80 - Post Graduate School, U, S. Naval’Ac&demyCopies ?xo~81 and 82 - U. S. Naval Engineertig Experiment Stationcopy Ho. 83 - New”York Naval Shipyard$ l!laterialLabor~tQrycow NO. g& - IndustrialTestingLaboratory ~C)opyNo. 135- Philadelphia Naval Shipyard~o~yNo. $6- San Francisco Naval Shipyard ~Copy”llo.,87- David Taylor Model Basin, Attn$ LibraryCopies No. %! and 89 - Technical,Library,BureELuof Ships, Code 364
,, ,,..
,,’’U*..’s. GO=5t Guard ‘ ‘
CopyNo~ 90 - Capt. R. B; La&’~ Jr., ”USCG.,.
copy No. 91 - Capt. IL.C+ Moore, USCGCOPYNO. 92 -Capt. G? A. Tyler, USCGcopy No. 93 :,Testhg and Developmmni Dtvisioncopy 80. 94 ~ p.,S.’+ast Guard Acadeuy, New London,,
copyNoo 95 - .ViceAtim E~’L; Gochran~,,’USN(Ret*?copy NO. 96 -E. E’.:hkI?tinSky..
,,.,
,’
Repre~entativ~s & American Iroii@’St&LIndituteCommittep,on i&hufactuiing Problems “
,
copy No* 97 - G. h!.Parker, Secretary, Gerqai Teclmical Committee$ AISl_Copy No, 42 -L. C. Bibber, Uj,S..Stqel C6,.” “ “ ,CopyNo. 31 (~G. H? Hertyj Jr., Bethlehem S,@el’Co~,,, ~cop~ No. 98:- E. Cg.~mithl Republi,c”iS,teel’.C@p. .
,,.-.
Weldtig Research Council
COpy NO, 99 - C. A. Adams Copy No. 101 - LaNotte Grover.copy Nom 1oo”- Harry Boardman copjT No. 23 - Wm. Spraragen
..
copy No. 102 -
copy No. 37 -copy No. 20 -
copy NO* 103 -copy No, 104 -copy No. 105 -Copy l!o.106 -cOpy NO. .32 -copy No. 107 -Copy No. 10$ -Copy No. 109 .copy No, 110 -Copy No; 111 -Copy lvo.37 -Copy No. 34 uCopy No. 112 ‘-Copy no. 113 -copy No. 114 -Copy No. 115 -.copyNo. 11”6’-~opyNo. 19 -Copy No. 117 -Copy No. 118 -Copy No. 119 -Copy No. 120 -Copy No. 121 -Copy No. 122 -copY No. 123 -Copy no. 124 -Copy No. 125 -COpy NO. 126-copy No. 127 QCopy No. 128 -Copy No. 12g -Copy No.130 -copy lJoi”131’9Copy No. 132”-
* Copy No..1.33-~,-----....=,“copy~o.i134 &
Copies No. 135Copy NO. 16o -Copy No. 161 =cOpy NO. 162 -Copy NO. 163 -Copy No. l% -
.., ,.‘CopyNd. “@-.... ... ,,.,.,, ,,7
C. R. Sode~berg$ Chairman, Div, of Engr. & ind. Res., NRCR. F. I!!lehl,Chairmah,Committee onLShip SteelFitilJonassen, Technical Director, Committee on Ship SteelS.T.Ca~~ntar, Investigator, Re’searchP~ofect SR-98T?.Pi,Roo~, Ynvestlgator; Research Project SR-98k. ’VFi’Z&ll,,~ti@stigator;”ResearchProject SR@
E. Kasteti,Ini%stigatorj Regearch Project SR-98° ~.-
Wm. M. 13aldwih’,Jr~,~Investigato~,Rgs’.%ojectsSR-99, 111L. J.Lo ‘J.
G* B:
i: ::R. F.R. M.C. H.z. W.E. R.CarloJ. F.V.‘L.R. A.G. S.
Ebert, Investigator, R~seah~h Project-SR-99 -Klingier$ Investigator, Re+searih~~oject”SR=99Uoldrich, Investigator,’ResearchP~oject”SR-100Rieppal, Investigator? Research Projact 5%100Williams, Investigator, Resear,chPYoject~R-lC)6Mehl, Investigator, Research Project ’~R-10gBrick, Inves+xlgator;R6’searchProje.otSR+109,Lori~x Investigator, Research Proje,gtS~-110”SUpDigtir,Investigator, Research Pro@ct’SR-113tlrar~$Investigator, Research Project ~11-113Ri@holH’, Investigator, Rbsearch,Pd6jecf SR-113Vlallac?Phvest~&ator$ Research Proj@c’tSR-1~Russ&, Investigator, R6search Project SR-117Hechtman, Investigator, Research Project SR-119Mikmlapov. Investigator. Research Pro.iectSR-120
Clarence Alte~b~ger, Gre~t L~es Steel Comp~yT. N. Armstrong, InternationalNickel Co., Inc.A. B, Bag@ar,,Spn Oil CompanyBritish Shipbuilding,Research Assoctati@, AttnsJ.C. AsherD. S.,Clark, Calffo?nia Institute of Te@nalogyPaul De Garmo’,University of California;’ “ ~~J. E. DoranF u~iversity of CaliforniaGeo&ge’Elllnger,National Bureau of StandardsA.,E,,.Flanigan,University of California0. Ji”.Horger;’”TimkqnRoller Bearing “C6m@y’ ‘ ‘H. Kennedy, University of California ‘E. P. Klier, University of MarylandJi’E. h!oliutt~~iirnegie~nstit~te$”Pittsbwgh~bbert U:.””Madd6fi,K~i~kti-S%e@lCompanyN. M..Ne%Tk, lJtiverSityof IllinoisE. drowhn; Mass&ch@etts’institute 0$ TGC&lO&
’15$ -4ZiG. HilZ~ British Joint Sertibes Missi6nL(Navy Staff)E. Ri:Parker, Universityof,Ga3iforniaV?.GiPerr~, RN~ BritisfiJoint Services Mission (Navy Staff)L. J. Rohl, U. S, $%eel CompanyH. A. Sbhade, University of:_CalifotiaSaylor Snyder.~@ S. Ste@ (?op~ny -Stfid&rd Oil flompanyof Cali.F~mi+~ Attn$ K. V~,King .-.., ., ....
., ...,, ., ..,.-..” ,. . ., . .
-v-
Copy No. 166 - Webb Institute of Navsl ArchitectmeCopy No. 167 - Georges Welter, Ecole Polytechnique, MontrealCOpy NO. 168 - Carl A. Zapffe3 Carl A. Zapffe Laboratoriescopy No. 169 -Division ~f Metallurgy> National Bureau of StandardsCopy No. 170 + Transportation Corps Board, BrooklP, NewYorkCopies No. 171 t,hrough175 - Library of Congress via Bureau of Ship~, CedeCOpyNOo 176 - XACAl Attni Materials Research Coordination, Navy Dept.CopYNoA 177 - File Copy, flmmittee on Ship SteelCopies No. 178 through 182 - Bweau of ShipsCopy No. 1S3 -COPY NO* 18&”- -Copy No. 185 -Co~yNo. 186- .,..copy No* 187 -Copy No. 1SS -copy No. 189 -COPY NO. 190 -copy No. 191 -cOpy ’~0. 192 -Copy No. 193 -copy No. 194 *COpy No. 195 -COPY NO. 196 -copy No. 197 -Copy No. 198 -COPY NO, 199 -COPY NO. 200 -copy No. 201 -CopyNo. ~02 -COPY NO. 203 .COpy NO. 204’-COpy NO. 205 - .Copy No. 206 -Copy No. 207 -cclpyNom 208 -COPJNO. 209 -Copy ha. 210 -COpy No. 211 -Copy NO. 212 -COPY NO. 213 -copy No. 214 -COpY NO. 215-COpy No. 216 -COPY NO. 21? -Copy No. 218 -COPY NO. 219 -copy No. 220 -Copy No. 221 -Copy No. 222 -@pY1io. 223 -COPY NO. 224 -COPY NO. 225 -
... .
vi
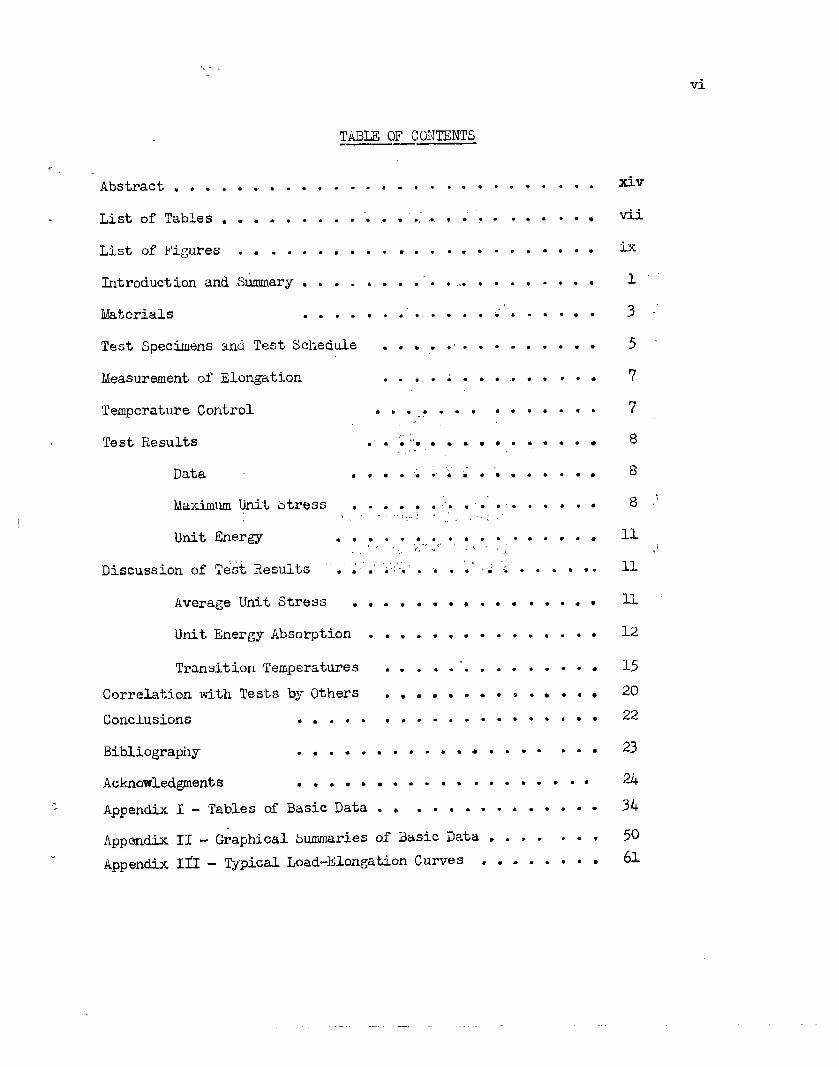
TABLE OF CONTENTS—.. —
xiv
vii
ix
~
3 -+
5’
7
?
8
8
8 .’
11
Abstract . ●
☛
●
●
✎
.
.
.
.
i
.
.
.
.
.
.
.
.
9
●
.
9
.
.
.
.
●
✎
●
✎
●
●
●
✎
.
.
m
●
.
●
.
.
●
.
●
●
●
✎
✎
✎
●
☛
✎
●
●
●
✎
●
●
☛
●
●
✎
●
●
✎
●
●
●
9
● ., ●
✎
✎
.
●
●
.
●
✎
.
.
.
.
●
●
✎
✎
●
●
✎
✎
✎
.
.
●
●
●
.
.
.
.
.
.
.
●
☛
✎
●
✎
☛
✎
●
.
●
●
✎
✎
●
✎
●
✎
✎
●
✌✎✎
✎
✎
✌
.
●
●
✎
✎
.
.
.
●
●
✎
✎✎
●
✎
●
✎
✎
List of Tables .
List of Figures
Introduction and Summary
Materials
Test Specimens
Measurement of
and Test Schedule ●
✎
b
.
.
.
.
0
.
.
●
☛
.
●
Temperature Control
Test Results
Data ●
Maximm Unit Stress .,,
Unit Energy ● .
Discussion of Test Results “.“.
Average Unit Stress .
Unit Efiergy Absorption
Transition Temperatures
● *.9.= 9 .
●
●
✎
●
,,,.“ . ● “* . ● ● ●
.!.~
,-., ,,..● ☛☛ ‘*.***
. . . ● ✎ .“. ● ‘ .,. .;,.,.:.’ ,i, j
● ✎☛
✎✌✎ ✌
.. *.*.P.,, .“!, , , ,,
, .).
IL.***
● ☛☛
✎✌✍
✎☛✎
*9=
. . .
,,.”
:’:‘*
.*
. .
.
●
✎
.
●
✎
✎
●
✎
l-i●
●
●
●
●
.
.
.
●
●
✌
●
●
●
●
●
✎
.
.
.
●
✎
●
✎
✎
●
✎
●
✎
✎
●
✎
●
●
●
●
●
●
12
15
20
22
● ✎
✎ ✎OthersCorrelation with Tests by
Conclusions ●
Bibliography .
Acknowledgments ●
b**= ● ✌
23● ✎☛☛✝✝ ● ✎☛☛☛☛ ● s=
● ****** ● =*=*** ● *** a
3L
50
61
--+ Appendix I - Tables ofBasicData. . . . . . . . . . . . . .
Appendix II - Graphical bummm%s of Basic Data , . . . . . ,
Appendix ID - Typical Load-Elongation Curves . . . . . . . .
vii
3
‘4
5
:“,,,.
.
,.
.
.
. .
. ,.
. .
,,
,..
,., .
,..
. .
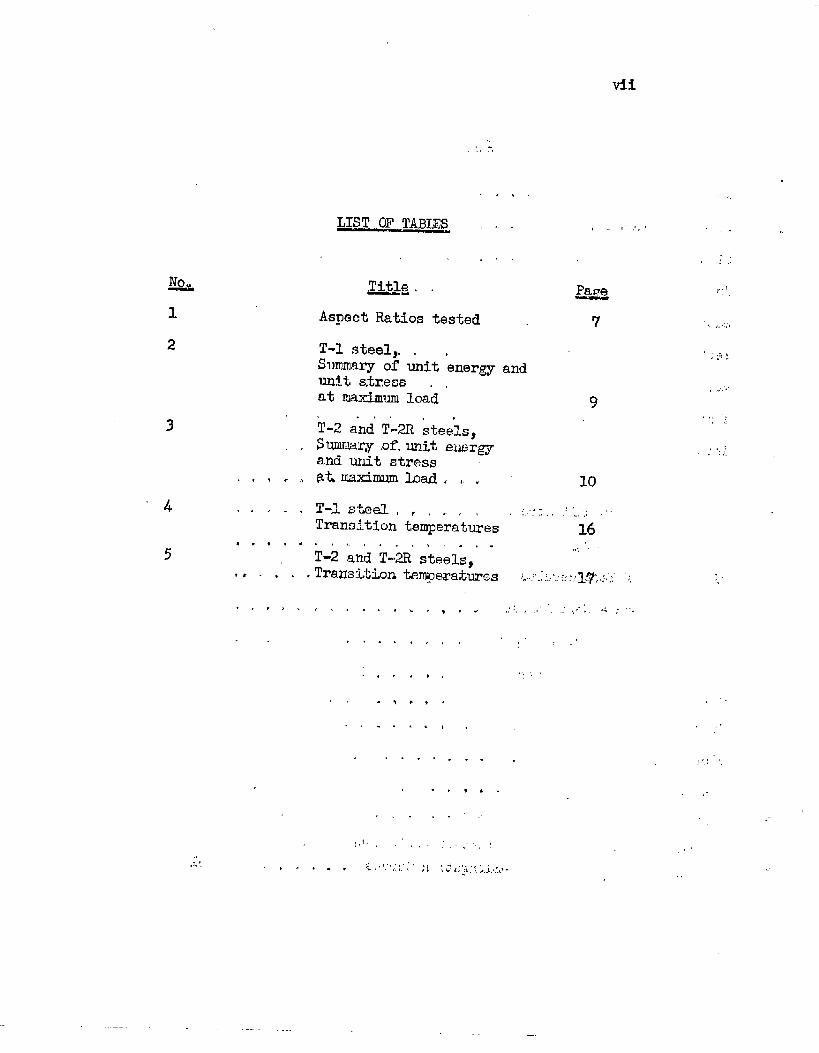
LIST OF TABmS ,.
.,
Titlc3. .
Aspect Ratios tested
T-1 steal,, , ,
!. .’ :,’
Summary of unit energy andunit s.tr.ess . ,at maximum load
. . . ,,T-2 and TD-2Rsteels,Sqnmwry.of.mit euergyand unit stress
stwxhullllmad. . , ‘ 10
T-1 s-heel, “ , . , . :,::,,::,,-;,.Transition temperatw-es 16.,,,, .,,, .,,. .,.,T-2 and T+R steels?Transition terqmraZwes )..};j.u:;gj:l~,i:i:,
,,
,.
,.
,.
.,
:.1
,.
.,
,,
**
.,
,,
.,, ,., ,, .... <. ...,. ,.
,
*
.
9
*.- ,,!:,,.,,’,”, ,~:.,~,,. .,
,.
..-.
,**.
., .”.
... .,”. ,!
,’.,,, ~. ~.:,;< :.: ;, ,;’i L.,::,* -
.,, .
.,
: ,1
,..i
\ ,,,,:,,,
,,.::~..
,,,!”~’
.,..!
,.: i.
:.,
,.
.-
,,
—
, .’viii
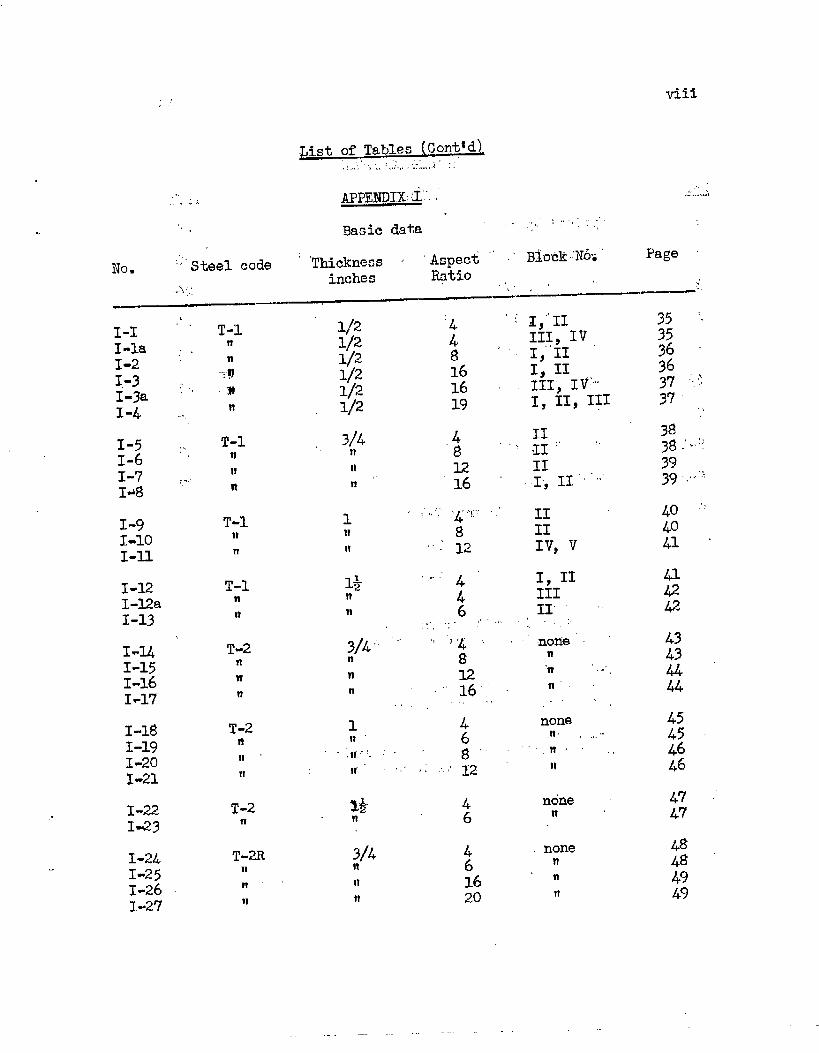
List of Tables (Conttd)‘.,..<”‘“”.!‘::\!...”.t,...?:.,.~“.:....!..
.
..
,,,
No. ‘:’Steelcode.,>i\.,.,
. . .Basic data
.. ...< ::“,, ‘.’,:
‘Thickness ‘ ‘Aspect “ ‘ B~o’cR:N~’~”” Page “
inches Ratio .4 ,, .’
I-II-1a1-2I.-3I-3aI-L
I-51-61-71~8
T-9I-101.11
1-12I-12a1-13
I-u1=151-16I*17
1-181-191-20I-21
,> I-221-23
I-241-251-261-27
,,.T-1
n,,
.;.7
,,. .-- II
n. ..
:. T-1n
11:..!
It
T-1nn
T-1nn
T-2nl!n
T-2nII ‘11
T-2n
T-2Rnn ‘il
3(4 .48
n I-2n “ 16
1 ‘ ““: yn
n,. “’12
1* ““” 4n 4n 6,,,.,., .,.
“’f “’
n 12n .“’16””.,,,,
1 4n 6
...’.tr,!- ; ~ *
Ii” : ,’ ,; ..{D
3/4 4n 6II 16n 20
II., ~1: !
II1; 11’”
IIIIIV, V
1, IIIII~l.
nonen
‘m ,..’,
nonen ,,.,.
.,, .tt, ,
nonet!
nonenn11
35 ‘“’35363637 :.,:
3? ,,
38 <38-’”‘:3939.,,.’:,
40 ““@41 ‘
41uu
43434“”44
45454646
47 .’
47
48he
4949
.-
ix
1
2
3
4 ,+
5.
q;
7“
8-A
8-B
9
10
117
12
13
Ih
15 .
16
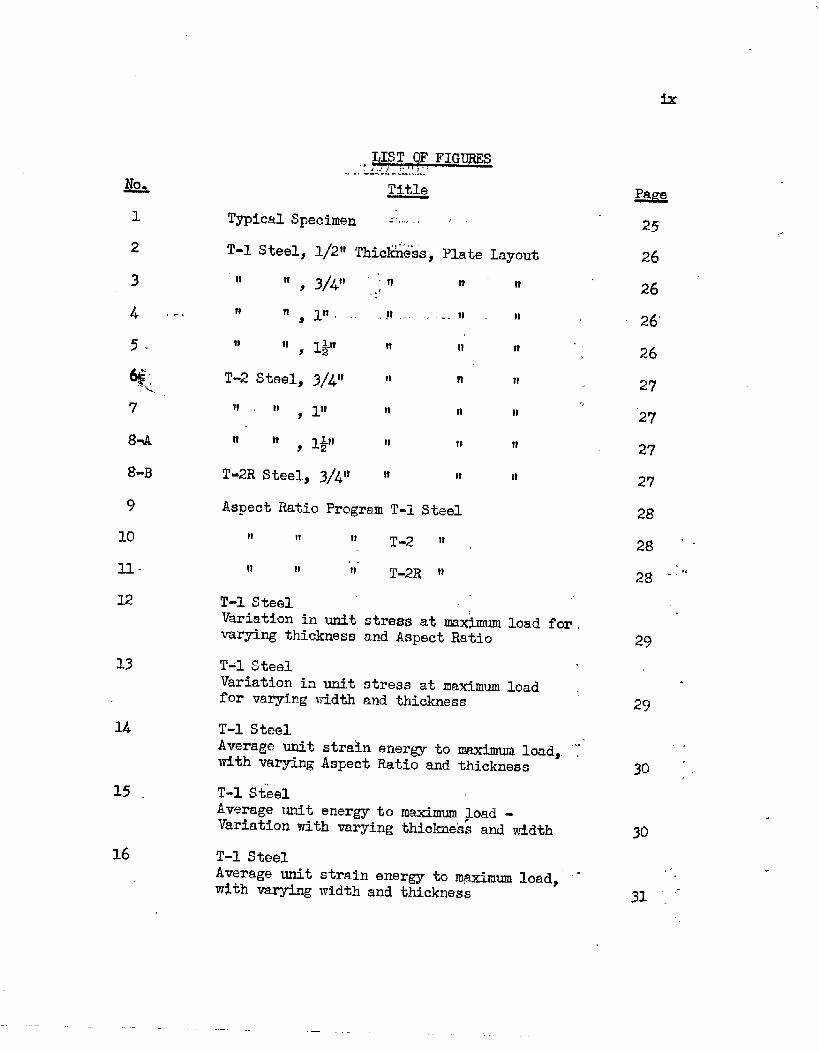
LIST QF FIGURES“:,...,~,~,....--=.,..,.+:..!..
Title
TYPical Specimen .~..i. ~
,.T-1 Steel, 1/211Thic~n@ss, Plate Layout
II 119 3/4” ‘,;‘t 11 11
II 11 , 111, ,,!! ,.. . . . II II
It n7 1~ II II n
T-2 Steels 3/411 11 ?1 II
It II , llt It n II
11 rt9 l&J 11 tl II
T-2R Steel, 3/411 !f II n
Aspect Ratio Program T-1 Steel
It 11 II T-2 It ,
11 !1 ’11- T-2R II
T-1 SteelVariation in unitstre~ at ma&IIII load for,varying thickness and Aspect Ratio
T-1 SteelVariation in unit stress at maxi- loadfor varying width and thickness
T-1 SteelAverage ~it stra?lnenergy to maxim~ loadr,‘“~’with varying Aspect Ratio and thickne~s
T-1 SteslAverage unit energy to mafimum }oad -Variation with varying thickness and width
25”
26
26 ‘
26.,
26
27.,
’27
27
27
2$
2g + ,,
2g ““’”
T-1 SteelAverage unitwith varying
Strain energy to m~fim~ load,’‘“width and thickness
29
29
. .
30 :,
30
, ..
.-
x
&
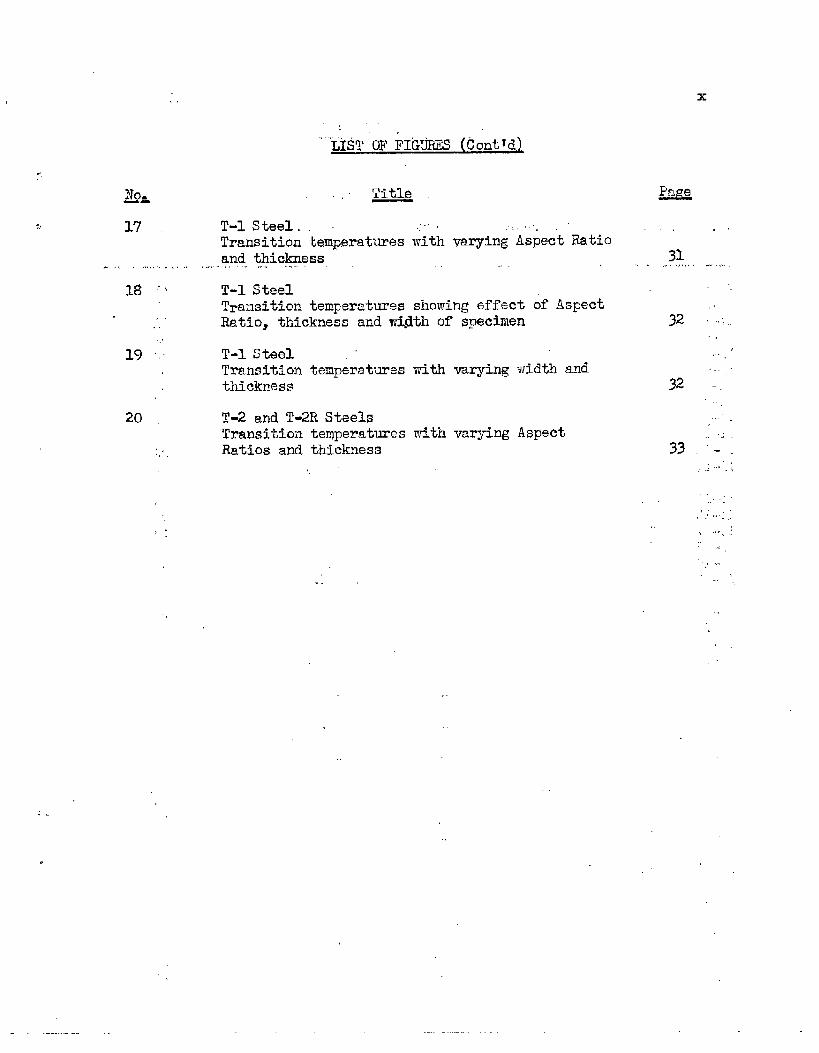
17 T-1 Steel,,Transition
‘.
‘“’”’LXST~ FIG~q (c~~t(~~
.“ Title x
.... .:,.,.,
temperatures with varying Aspect Ratio a.and thickness J.1
....,,..,,.,, ........... ... ..... ., ,,.,....,,., .....
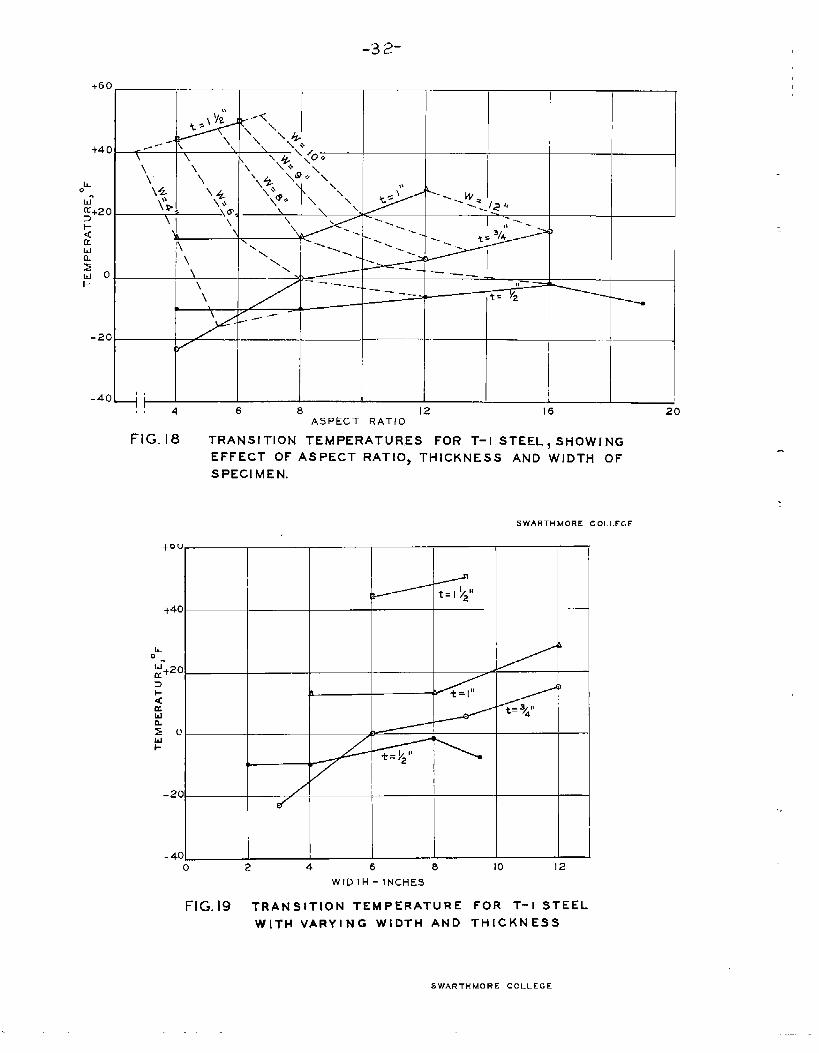
18 ..> T-1 SteelTransition temperatures showing effect of Aspect
,.Ratio, thickness and width of specimen,.
19 : T-1 SteelTransition tenperatwes with varying width andthickness
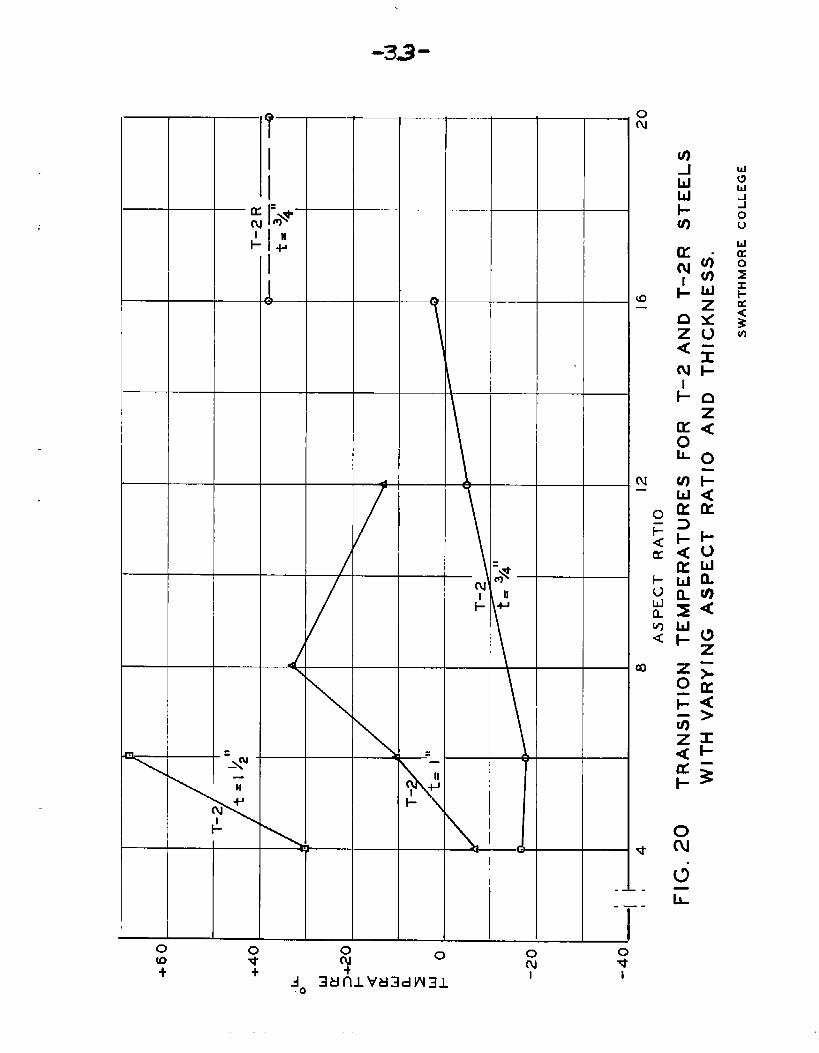
20 T-2 and T-2R steels
Transition temperatures mtth varying Aspect:, Ratios and thickness,.
32 ‘.=.,
,..,:
32 “1’
...’4
~~ ., ”:,:””;.,,.......
,,, ,,.
. . .,1 . ...,,,:
,“ \..,.,~,,:
,,.,
,,! . ..
. .,
,.
xi
.,:,,. f
LILT OF FIGUPW (Control),<
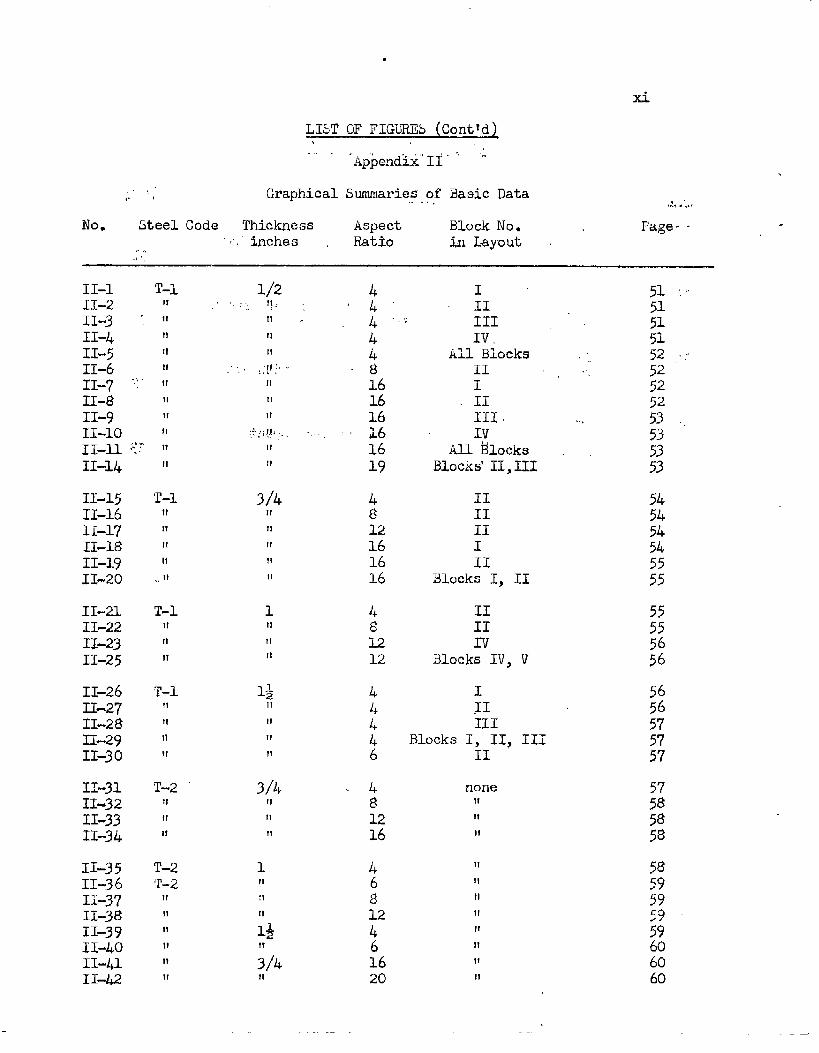
...,‘“Appendi~’11’”“ “-
Graphical Summaries of Basic Data,..+.
No. Steel Code Thickness Aspect Block No. Page. -‘.”inches Ratio.,. in Layout ,
II-1 T-1II-2 II
II-3 : 1’11-1+ 11
II-5 II
II-6 II
11-7 “::”IIII-$ II
II-9 II
11-10 ‘1lI_~ ;.::1!
11-14
11-1511-1611-1711-1811-1911-20
11-21II-22II-23II-25
II-2611-2711-2811-2911-30
11-3111-32II-3311-34
II-35II-3611-3711-38II-3911-4011-4111-42
11
‘T-111
II
II
II
,,,It
T-1IIIIII
T-i!1IIITII
T-2II
!1Ii
T-2T-2IIIItl
II
It
tl
1/211:11II
1!
,:[}:.
It
11
II
::-:i~~)
II
!1
3/!
1!II
t!
II
1t?
II
II
1*II
It
11
II
3/4IItl11
1II1!II1$11
3/4fl
‘:44
-:161616
“,..,,, i61619
4812161616
4&1212
b
:;
=481216
46812461620
IXIIIIIV,
All Blocks .II =,III111 ....Iv
All Blocks .Blocks’11,111
IIII11III
Blc)cksI, II
IIIIxv
Blocks IV, V
IIIIII
Blocks I, II? 11111
none11
11
II
II
!1
II
11
11
11
II
II
xii
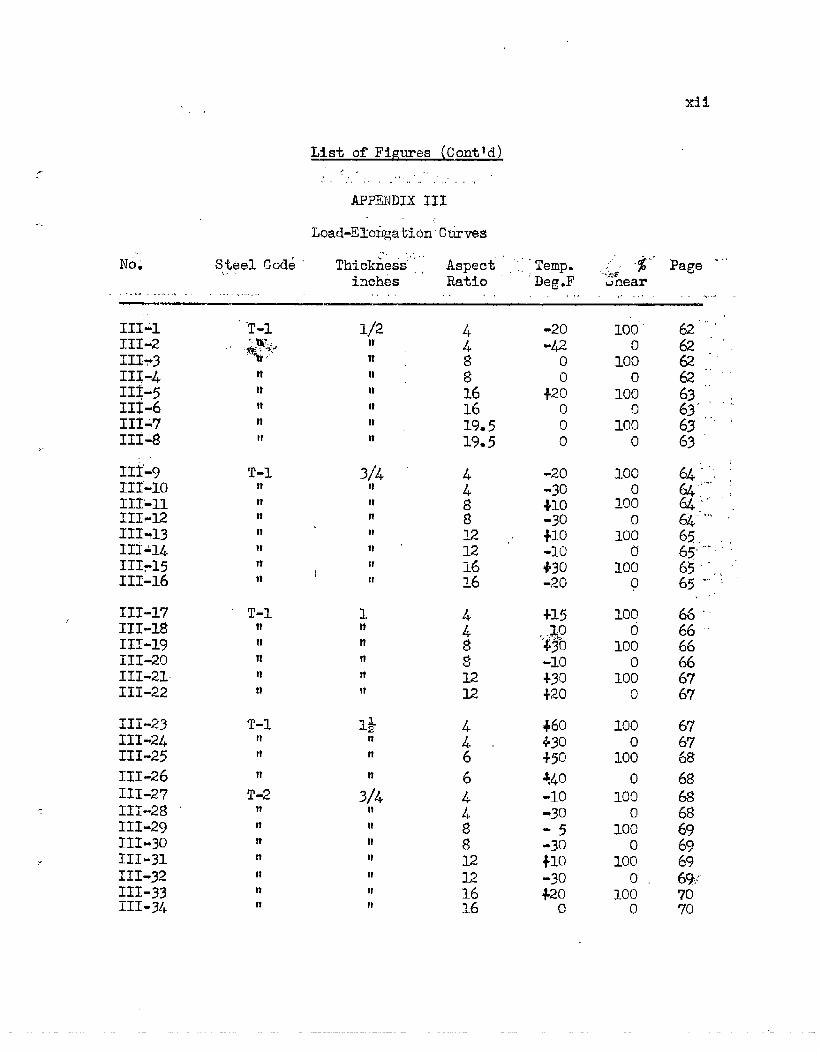
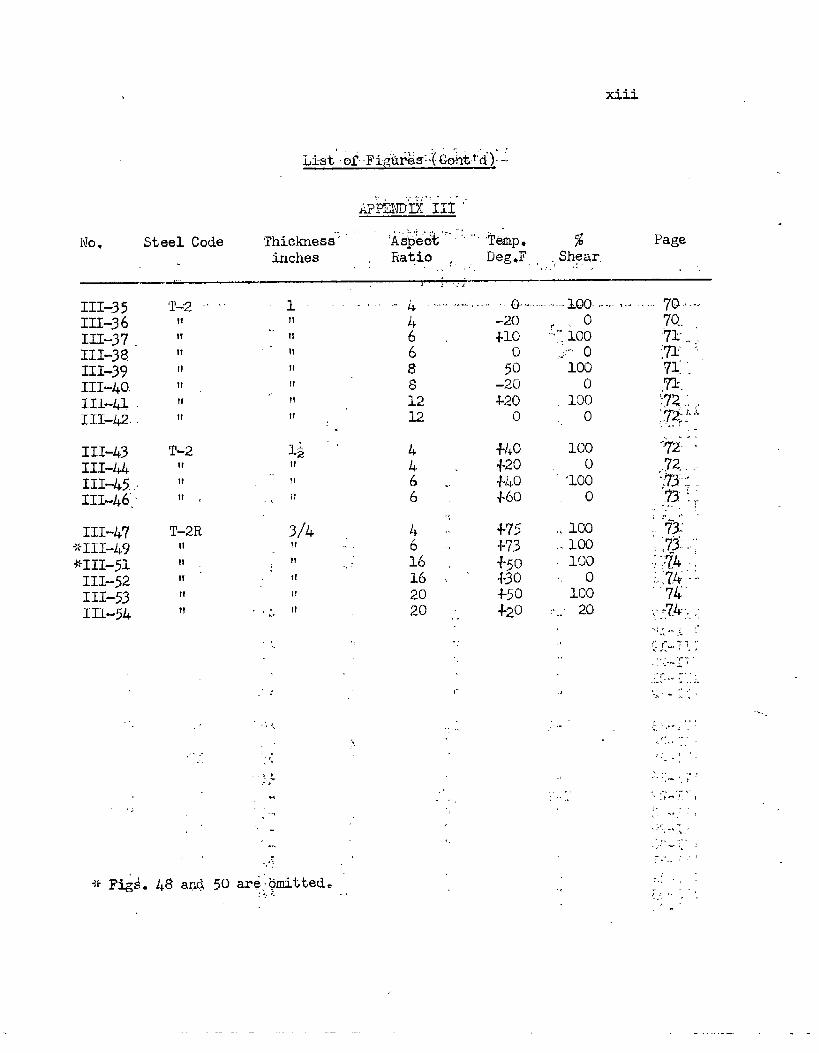
List of Figures (Contld)f.
,. .’,..,,.“:.,....,.,,.,
ARPENDIX III
Load-ElofigationCti-~s...,,
No= S,@el Code Thickhes9’~”., .%..”page .,,
Aspect ‘.’Temp. .~.tiinches Ratio beg,F unear
...”............ ,.”,.,,,.,,,., ,,.. ., ,., .. . ,.,.. .,,.,,. .. . .
111~1111~211173III-4113-5111-611147111-$,.
11S:9
111’-10IJS’-11111-12111-13111-14111715111-16
111”17,,111-18111-19111-20111-21III-22
111-23111-24111-25
111-26III-27
T 11X-28111-29111-30
.4 111-31111-32III-33III-34
‘T-1
II
u
n
W
tt
T-1
T-1n
n
11
?1
f)
T-1n
11
n
T-2tttlnnN
11
It
l//2nmII
n
n
n
tl
3/4;1
It
nII11n
n
1U
11
n
n
3/4n
It
n
tl
n
lt
448816X619*519*5
44“6
6448812u
-20
“4-2o
+2:
o
0
0
-20
-30*1O-30+10-10+30-20
+15>.,~o
430
-lo
+30+20
+60
+30
+50
+40
-lo-o
-35-30+10-30+20o
lobo
1000
100
01000
100
10:
0
1000
1000
100
10:0
100
0
100
10:
0
100
0
100
0
100
0
100
0
. ... . . .4--
. . .,. .?. ,+ .NQ ~ Steel Code Thickness”; ‘As~~&* ‘“ ‘Temp. % Page
inches Ratio ,,, Deg*F,(,,,rs~.~,r..- ... .. “.——— .,,. ,,:,; —
).
111-35III-36111-37,111-38III-39111-40.III-U111-42..
III-43111-4L111-1+5,,111-46’
111-1+’7+111-49+:111-51
III-52III-53III-54
T_~ . .
II
11
11
II
II
11
II
T-2IIIfIt ,
T-2RIIII11 “II11
,,
,,.,-
,;
..
..
.
.,
,$,,..
.,
.,. .
-, J,
. ..“‘.,
. ...,.. w.. .
. .
.,,
. .
. .
-,’:-
II
1!
II
!1
II
II
tl
“
II
I:
II,. ,-
11
11
II
ar~;omitted..!:,.. ..
,
—.
:
6$$1212
:
161620
20
.,
!!
,{
,,
.
:..
,:. ,
,,
‘,
,.
f,
-20
+10
5:-20+20o
+40+20+I!.)o+60
+75+73+50+30+50+20
o
‘f’::100,,,..,
,.- 0100
0
, 100
0
100
0
“’loo
o
,, 100,.100
100
,, 0
100,.. .. 20
.,
,..;,, ,,
71,!72..;,,;,,72;.!’“:’”
,.
,:.1,,.,,+..
xiv
ABSTRACT
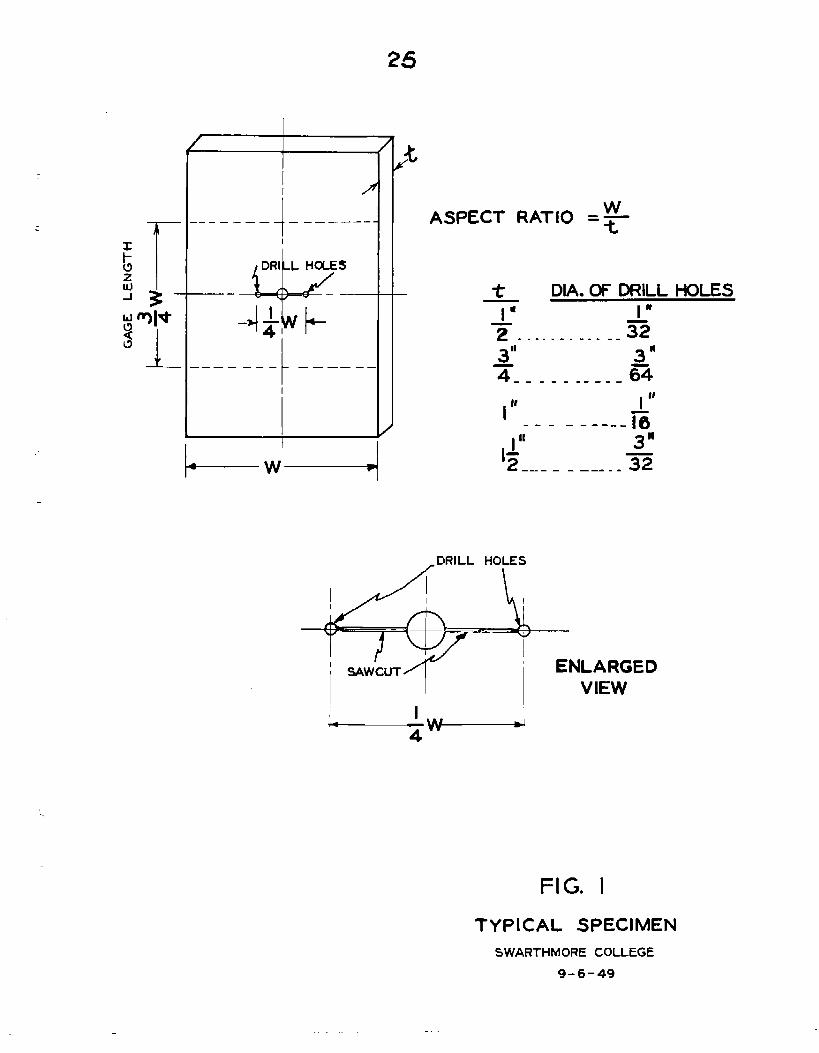
This report contains the results of tensile tests made on
geometrically similar steel specimens. Tests were made in a systematic
manner with Aspect Ratios (width divided by thickness) varying from 4 to 2o0
Each specimen was internally notched with a central transverse notch having
a length equal to 1/4 of the width of the specimen. The ends of the notches
terminated with a drilled hole. The diam#ter af the drilled holes was made
proportional to plate thickness. Steel plates ranging in “as rolled thick-
nessesll,from 1/2 inch to l; inch were investigated from two heats of steel.
The results of the tests are classified on the basis of strength,
energy absorption, and transition temperature.
It was found from this 3nvestiEation that dimensional similarity
of specimens does not assure geometrical similarity of plastic strain pat-
terns. Tkerefo~ the geometrical and metallurgical effects of thickmms on
transition temperate could not be segregated on the basis of geometrically
similar specircens.inthis investigation.
.-
PROGRESS REPORT
NAVY BUSHIPS CONTRACT NObs-4Yi21(Index nom NSOll@43]
PROJECT SRW98
The Effects of Width and Thickness on Strength, Energy
Absorption and Transition Temperattie for Internally
Notched Flat Steel Plates
Prepared by
Samuel T. Carpenter, Wendell P. Roop, A.
S?IARTHMORECOLLEGEDIVISION OF ENGIN~ERING
SWARTHMORE, PA*
W. Zen, E. Kasten
.,,
PRCGIWS~ REPORT
NAVY B“@FiPS CONTRACT.NOlm-45521,.
PR~CT SR-98..
,. ,,.,.
The Effects of Width and TI-dcknesson Strengthj ~ner~f ““”Absorption an&Transition Tenper,aturefor Internally
“NotchedFlat Steel Plates
Prepared by.,. -f
Samuel T. Carpenter,.,
Swarthmore
..’, >.
Wendell Pm Roop, A, W. Zell~ 12waidEasten>.!:”;..,’
Colleges Division of Engineering$,,.. ..
Swarthmare, Pam ..,.... 4 ‘t,,:
l’NTROOUCTIONand ST.lVIMAR~—.
.. $ ,,!.. ....-..’- .,, .,..’. ~,,, . .. .,,
Tti”study$ designated as the Aspect Ratio Program, is,...,,... ,‘afie~l;ratory investigation of the effects of specimen geometry (width
and thickness) on strength, energy absorption and transition temperature,
“
using internally notched steel specimens tested in tension. The width.,
and thictiess of specirmx were relat”edby considering the Aspect Ratios
(AR) of ~h~ specimens ~fh~~~AR kep~esents the ratio of gross wid~h of,., .
., ..’
‘ specimen to thickness of the-... .
to be geometrically sitilar,
““held in strict similitude.
The intent of this
.. :.:’ ,..
platew Specimens of equal AR were said
since notch length and acuity:were also
!,
study was to obtain a separation of the
geometrical from metallurgical effects in plates having variable ‘)as
rolled’fthicknesses from the same heat. A systematic variation inAR.,--
in various plate thicknesses was made$ utilizing two differant stee>s..
Assuming for a given thickness of a qiven s-teeit?natchemical and
,- ,.
,.,‘,- ,,:.J. ~.
-2-
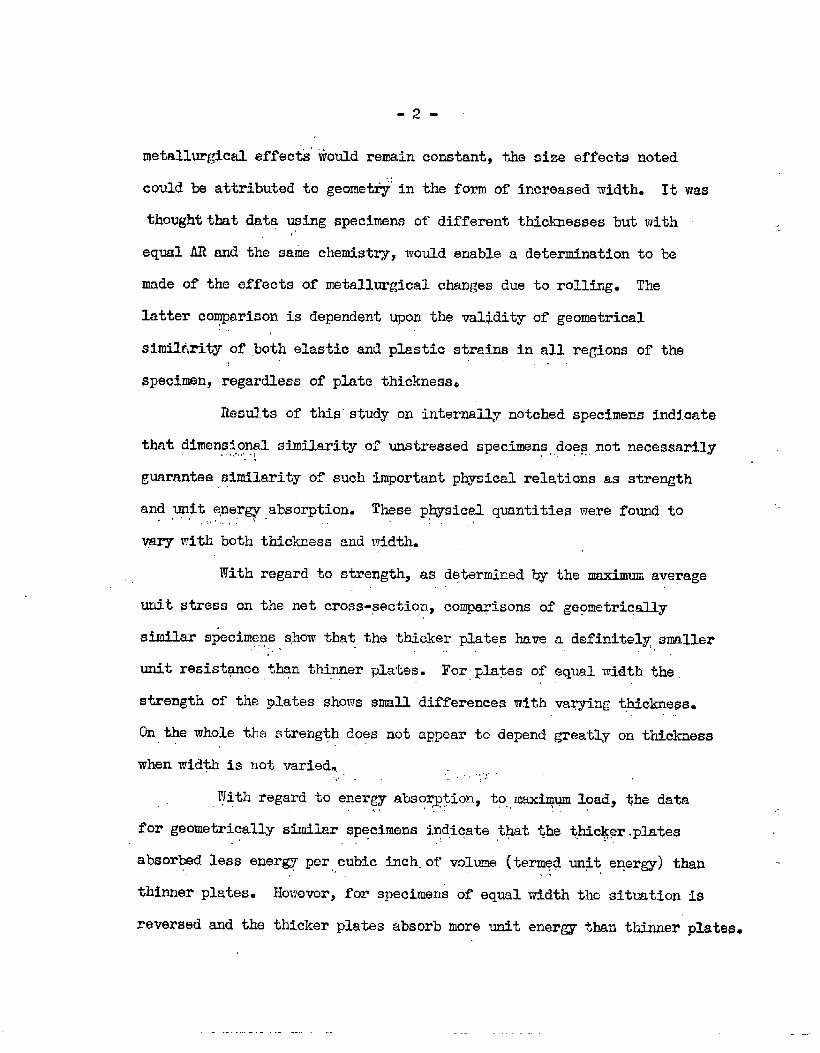
metallurgical effects’would remain constant, the size effects noted
could be attributed to geomet~ in t-heform of increased width. It was
thoughtthat data using specimens of different thicknesses but with,..
equal AR and the same chemistry, would enable a determination to be
made of the affects of metallurgical changes due to rolling. The
latter comparison is dependent upon the validity of geometrical:.
simil~rity of ,bothelastic and plastic strains in all regions of the
specimen, regardless of plate thickness
Results of this’study on internally notched specimens indicate
that dimensional similarity of unstressed specimens,,does,not necessarily..........j., ,’.’.
guarantee similarity of such important physical relations as strength.,-.
and unit e,nergyabsorption. These physical quantities were found to,.; ,-..’,/:,:”,“ :., ,
yary with both thickmss aml widths
With regard to strength, as d+ermined by the maximum ave~age,.
unit ptress on the net cross-,section,comp~isons of geometrically
si.mllars~ecimens s,howthat the -thickerplates have“. .,.’
unit resistance than thinner plates. For,plates Of
strength of the ylates shows small differences with
On the whole the strength does not appear to depend,. ,.,
a definitely,smaller
equal width the.
varying thickness.
greatly on thickness
when width is not varied~ ,. ,,,..-,.
.~ith regard to energy abso~ption, to,maxirnw load, the data.. .. ,,. ,-
for geometrically simiiar specimens indicate ,that~he,thickqr.plates.’ “,
absorbed less energy per cubic inch.of volume (termed unit eq+rgy) than ..‘. ,,
thinner plates. However, for specimens of equal width the situation is
reversed and the thicker plptes absorb more unit energy than thinner plates,
..The
metallyrqical
-3-.... ,,,
transition temperature for a given thickness of plate,
effects assumed constant, shows a tr..ndupwards as the width
For small widths the thicker plates have higherof the plate incr~ases. .,.
transition temperatures than the thinner plates~ considering either,,-
constant aspect ratio or width. The question here is what part of this,, ., ...
increase in transition temperature is due to the geometrical eff~ct of.. ,.
increasd thtckness and what part due to metallurgical differences- The,-
effects qf metallurgical differences cqn o$iy
of geometrical effects. AS it was found that
not completely eliminate geometrical effects,,, ,, .
effects may require comparison of the various,,
other than eq~lity of aspect ratio.
,-,
be determined in the absence
dimensional similarity does
the isolation of metallurgical,,
thicknesses on some basis
A trend toward uniformity of strength and unit e~ergy in the
various plate thicknesses, as width is increased, would suggest that the‘..
effect of thickness is to modify the rate at which these miform values
are approached as width is increased*
The results of this study mus>
disclosing the nesd of furtiierstudy and
MATERIAiS
given tha
furnished
be considered +@
investigation-
be exploratory,
.!
The steel plates used in the aspect ratio program have been
code designation T-T, T-2, and T-21L The T-I* steel was!,
in l/2H, 3/411,ltland 1?! thicknesses, with all plates rolled
~The T-1 steel was given the plate code letter ‘tGtlin the report ltFurtherStudy of Navy Tear TestrlbyNm A. Kahn and E- A. Imbembo published in theWelding J6uFMZ, February, 1950.
,. . .! .,..-,., . . ... .... .+,,,!.,. . . . . .,
from the same hea~~’’’T~e2-2
thicknesses, all rolled from
-.4’”-’ “’
steel was received in-3/4fi,litand 1~~
the same ‘heat.“%?R designates the 3/4n
thick plates obtained’byre-rolding a portion of the~~n’ ‘thickT-2 steel.
,,The chemical analysis’‘forthese steels is as follows: “
Steel Codq g
and the
T-i ‘“’ ●16
T-2 “ .18
T-1 steel is terrn~d
T-2 steel i-stermed a
&’ ‘~ g S5:,,
-,
.93“i.● ~13 .034 .020
.72 “no~ ‘*c26 .26
a semi~kill~ steelo$ the”ABS-B type’ ‘
silicon-alumimumkilied, fine grained steel.
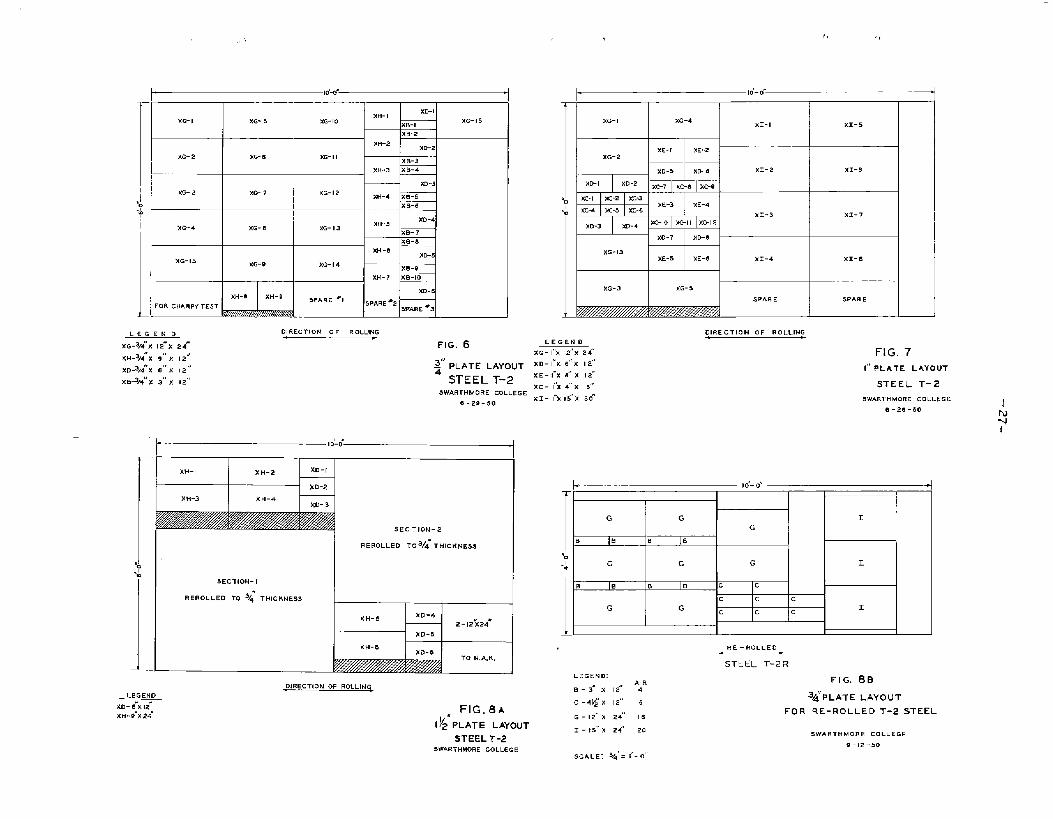
The T-2R steel was produced kg re-rolling ’2”~iecesofT-2
was made without cross rolling in 3 passes ~hile tiaikt~iningthe 48~twide
dimen”sion~‘The@l “thiokplates were b the s~akltigpit~ior
“i’or~ie fio~ Gn&’fifteLn’niikutesat ‘a{’tern~drdtureOf 22&O~m
,:+itierat’’e’’wa; ~6800j,The surfaces of:the re-rolled plates
excellent and relatively free from scale. ““ “
to rolling
The finishing
, ,,.weye
“The grain sise-for these steels h.a~be~n”~eported’to this
laborato~ by Mr.’:lt-A; ‘Kahn*of”the”l~ey~~York Naval Shipyard, as follows;
Steel Code Plate Thickness Mc@mid-Ehn,.. .,...G:. Grain Size——
.. . T-1 ““ ‘ l)2fi””: 2:’ . 1-/$
.,-T-l “3/41!--- 1-3
T-l ‘ it’”:” 1-3
.. T-1 , ,.!. . . ,.W . . . . .,l#:. .-..,. .,,.+. .,-g,.........,. ,.
T-2R + y..m “.,7-$,. ;.”
* By letter
.- .- --
-5-
It has be~~ further,reported for the T*1 steel that a
progressive decrease in the $errite.grain size was observed, with a
decrease in plate thic@ssq The ferrite grain.,sizefor the T-2 steal
has been reported as 5-7 and for the T-2R steel as 6+L
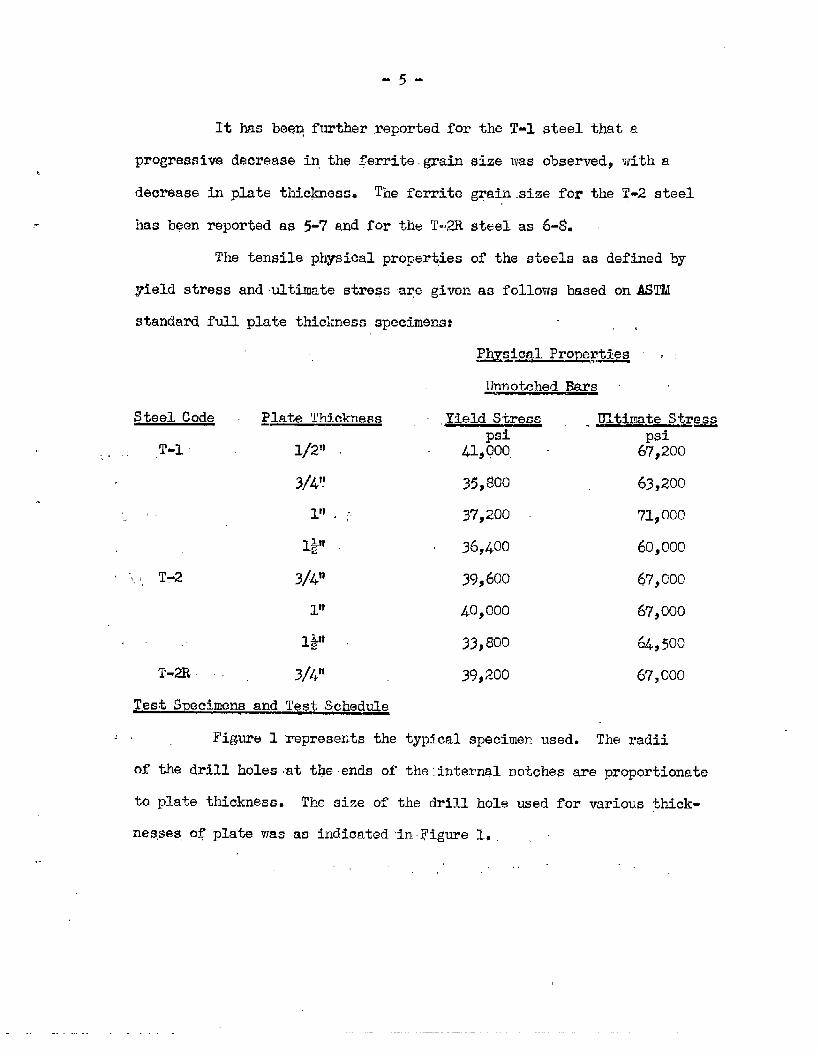
The.tensile physical properties of the steels as defined by
yield stress and ultimate stress are given as follows based onASTM
standard full plate thickness specimens: ,,
Physical Proue,rties , ~
Unnotched Bars
Steel Code Elate Thickness ~ ,Y$eldStress ~ Ultimate Str~psi psi
,T-1- @ 41,QoQ ‘ 67,200.,,”
3/4” 35,$00 63,200.,
,,. l’~, : 37,200 71P000
ly 36,4oo 60,00,0
‘),‘,T-2 3/4” 39,600 67,000
l’~ 40PO00 67,000
., . lyt 33,800 64,500
T-a. 3/4” 39,200 67,000
Test SrmciWns and Test Schedule
., , Figure 1 represents the typScal speeimeu used. The radii
of the drill holes :attheends of the:internal notches are proportionate
to plate thickness. The size of the drill hole used for various ~hick-
nes,ses,0$ plate was aB indicatedinFigure 1-
.—
.“. ,
,,
-,.!,
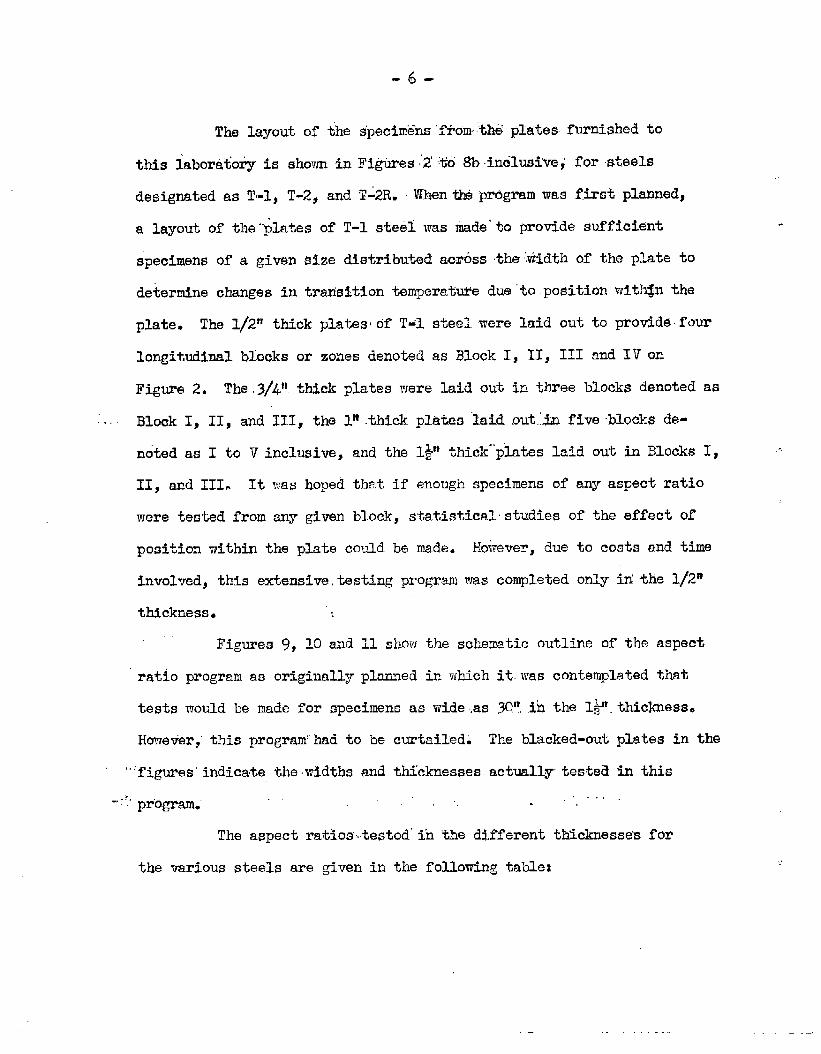
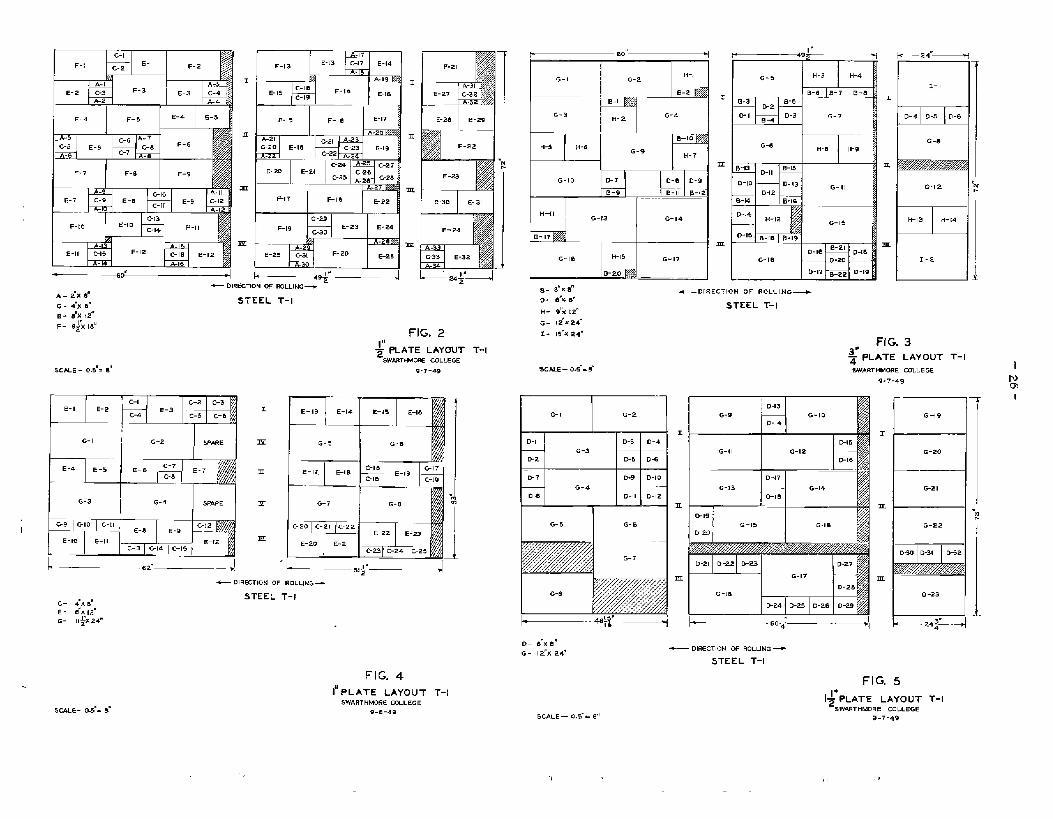
The layaut of the specimens ffiomthd plates furnished to
this labora%o~ is shown in Figires2’~%o %intiluai’ve; for steels
designated as T-1, T-2, and T-2FL whenti prbgram was tirst planned,
a layout of the’-~latesof T-1 steel was bade’to provide sufficient
specimens of a given size distributed across tha:.tiidthof the plate to
de~ermine changes in transition temperature due ”topasitionwlth$n the
plate. The l/2ttthick platesof Trnlsteel were laid out to providefour
longitudinal blocks or zones denoted as Block I, II, III and IVon
Figure 2. The,3/4K thick plates were laid OU% in three blocks denoted as
Block I, II, and 111, the lt[.thickplates “Iaid.out.tifive -bl~ck$de-
noted as I to V inclusive?
11, and III* It was hoped
were tested from any given
and the l~t thiclc”’plateslaid out in Blocks I, .-.
that if enough specimens of any aspect ratio
block, statisticalstudies of the effect of
position wtthln the plate could be made. Ho&ever, due to costs and time
involved, this extsnsive.testingprogram was completed only itithe l~2n
thickness. ;
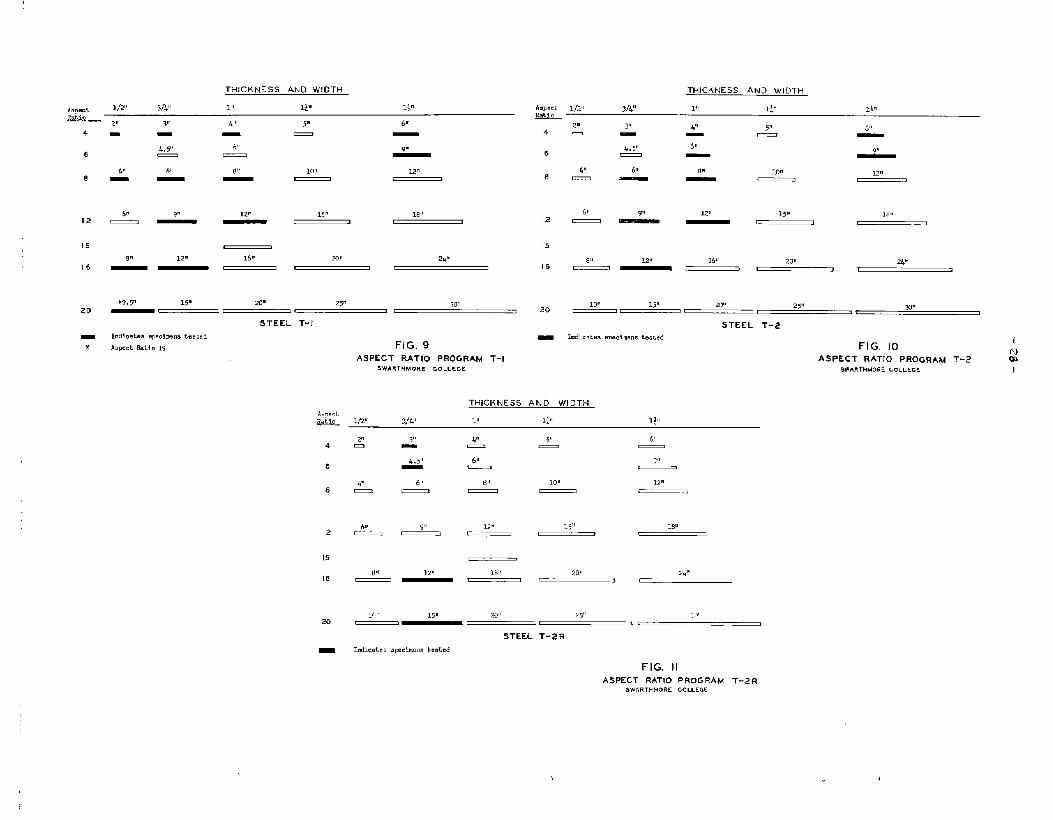
,..Figures 9, ZO and 11 show the schematic outline of the aspect
ratio program as or&hally planned in which it.was contemplated that
tests would be made Yor specimens as wide,as 30q,.Stithe l&r.thiclmess,
Hometier~this program’’hadto be curtailed: The blacked-out plates in the
figures’indicate themidths and thicknesses.actuallytested in this
prbgrami ,’., ,-,, ..
The aspect rat~os.tested’ih ‘thedifferent thickness% for
the various steels are given in the following table:
.-
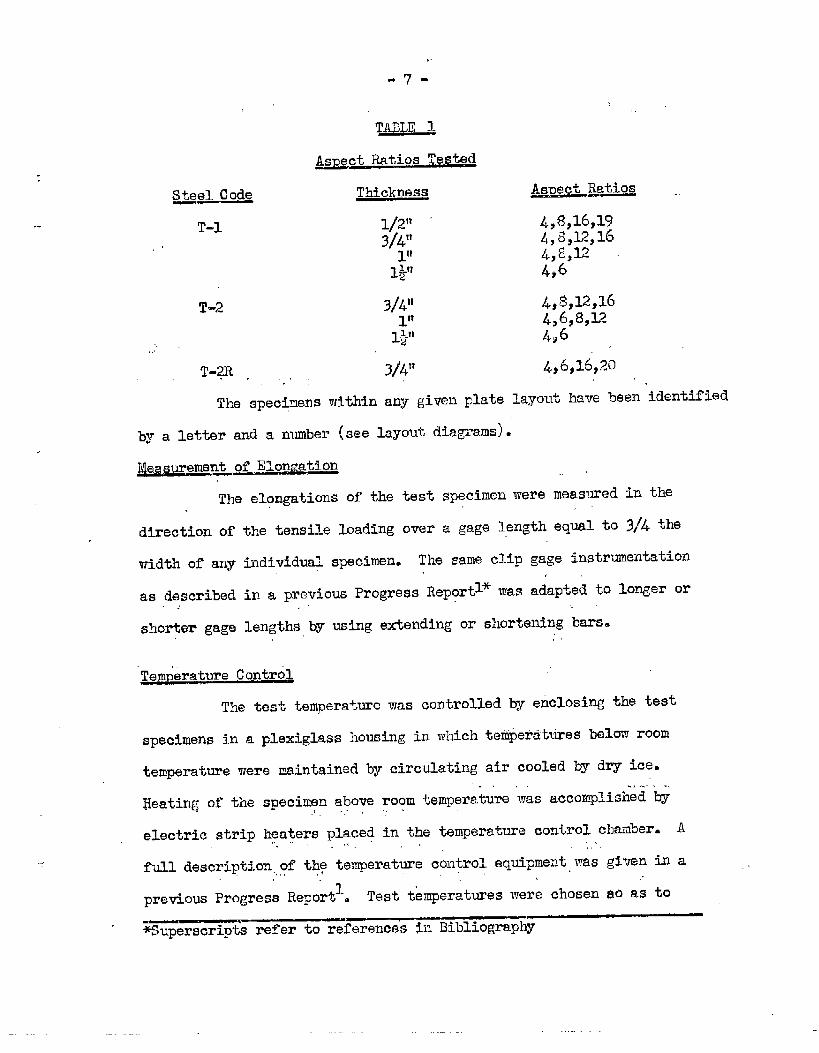
TM3J3 1
act Ratios Tested
,,
T-2
,,,
T-% , .,
3/.4”1“ly
3/4T’
4,$,12,164,6,8,124,6 ,
4,6,M,20
The spec+mens within any given plate layout have been
by a letter and a numbw-m(see layout diagrams)t
lkasuremen~of Elonmtion
The elongations of the test specimen were measured in,-
.
identified
the
direction of the tensile loading over a gage length equl to 3/4 the
width of any individml specfien= The same clip gage Instrumentation
as described in a previous Progress Reportl* was adapted to longer or,, ..
shorter gage lengths by using extending or shortening bars,,’ ,’,
Temperature Control
The test temperate was controlled by eiclosing the test
spectmens in a plexiglass housing in which tei$eti~ttiesbtibw room
temperature were maintained by circulating air cooled by dry it@*. . .
Heating of the specimen above room temperature was accomplished by.!, .-!.,.,
electric strip heaters placed in the temperature control chamber. A.. .. .,., ,,.
full description,,~fthe temperature control eqtipment,was given in a.,,.
previous Progress Reportl. Test temperatures were chosen ao as to
————superscripts refer to references in Bibliography
-.

straddle the transition from shear to cleavage fracture.
w. ,,,’ ,. ..,,, .,,
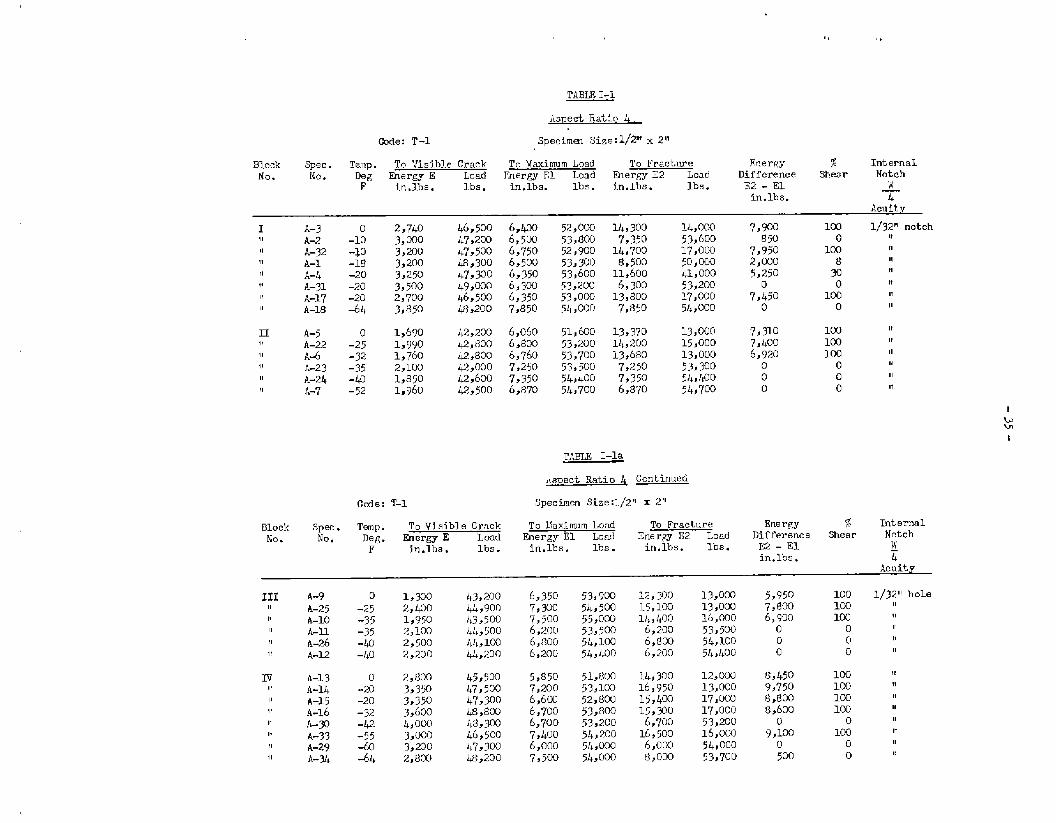
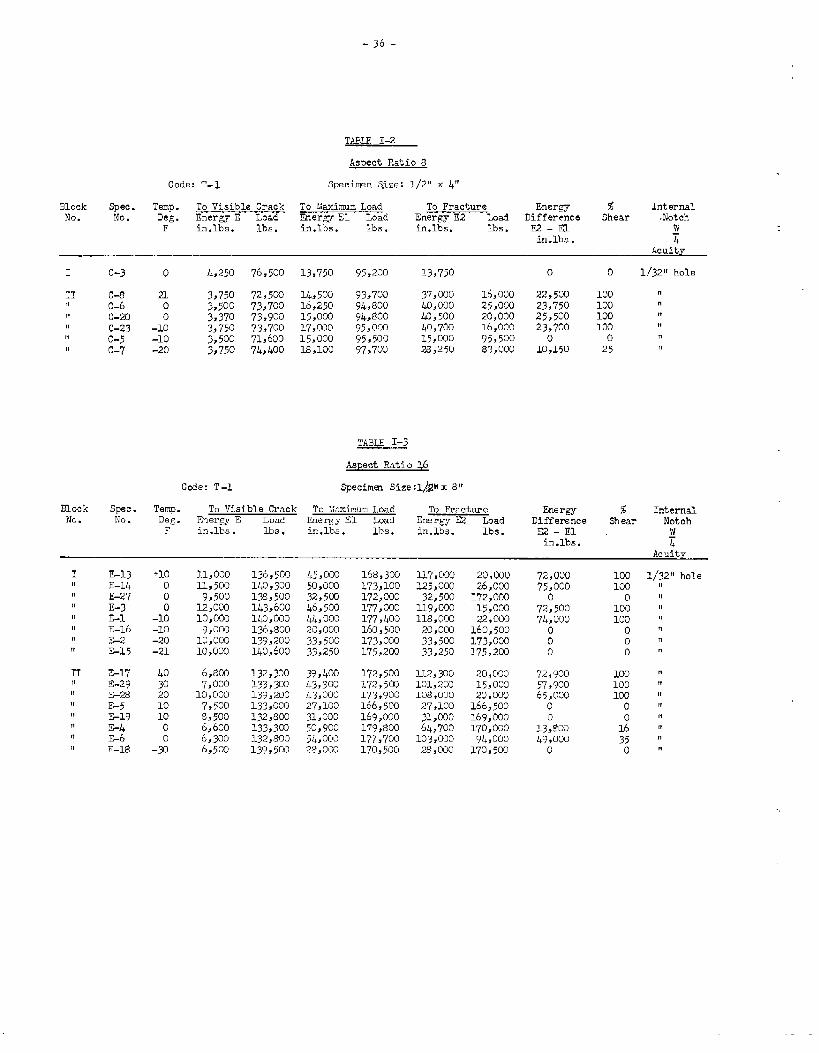
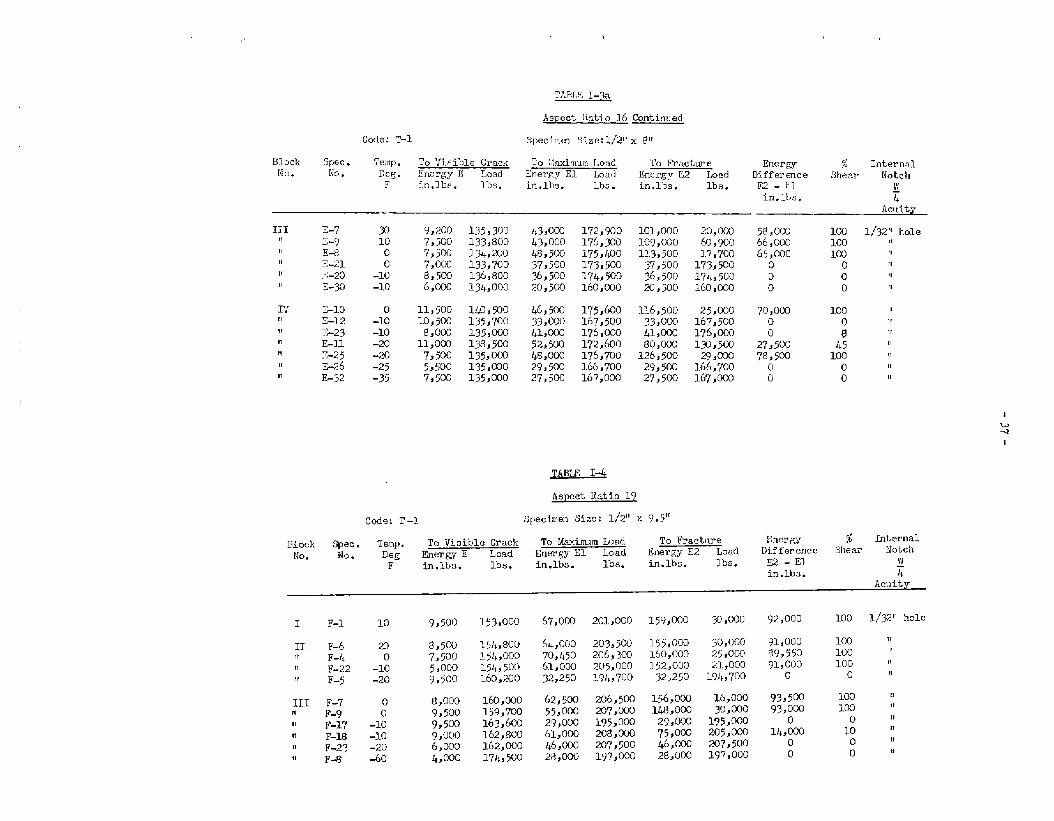
The.tables in Appendix I list the basic data obtained for.,’ ,,
test specimens of,all steels, as follows: Test temperature; the load,...,
producing the visible crack at the notch, the maximum load, cad the
frflctureloa~; and the energy bput to each of the aforementioned loads
in inch-lbps In addition, the character of the observed fracture is
given in terms of percentage of shear texture in the fradtti swface..,+ !,
The energy to the”visible crack loadin~ has been designated as E, the
energy to hum load as El, and the energy to fracture as Ez. The
tables also list the difference in energies E2-E1 where thia,quen%ity,.,. .,.,J,
represents the strain energy absorption after the”:”maximumload. All. ,,.
!.,,.
of the tabulated energies were obtained by findik~ tk’~a’~eaunder “theload-,., ,-.elongation curvess Typical load-elongation curves are iticludedin
,-.<
Appendix 111 of this report for two’specirnensfo~ every aspect rati~
tested, one curve referring to a spmimen failing in shear ahd’the
other curve referring to a specimen in which
., ,. The,basic data shomi~.the. tables
in the figures given in AppendixII.
.,., .?.A~rage Maximum Unit Stre9s
,.
cleavage failure occurred.~,:.:,’,., J,,.4 ,.,
.,aregraphically summarized
.,..
Tables 2 and 3 list the average values of the”.,,“ !,’.
stress at maximum load for T-1, T-2, and T-2R steels in.;. ,.
nominal unit
addi’tionto the.
,.
>=.
unit energy valuesm The pomina~ tiit strese intensity is based m the
.. .’
-. ,-. L-w,.--..,..+. .,.r
—.
. .
Smmsry. of Unj.t
Values
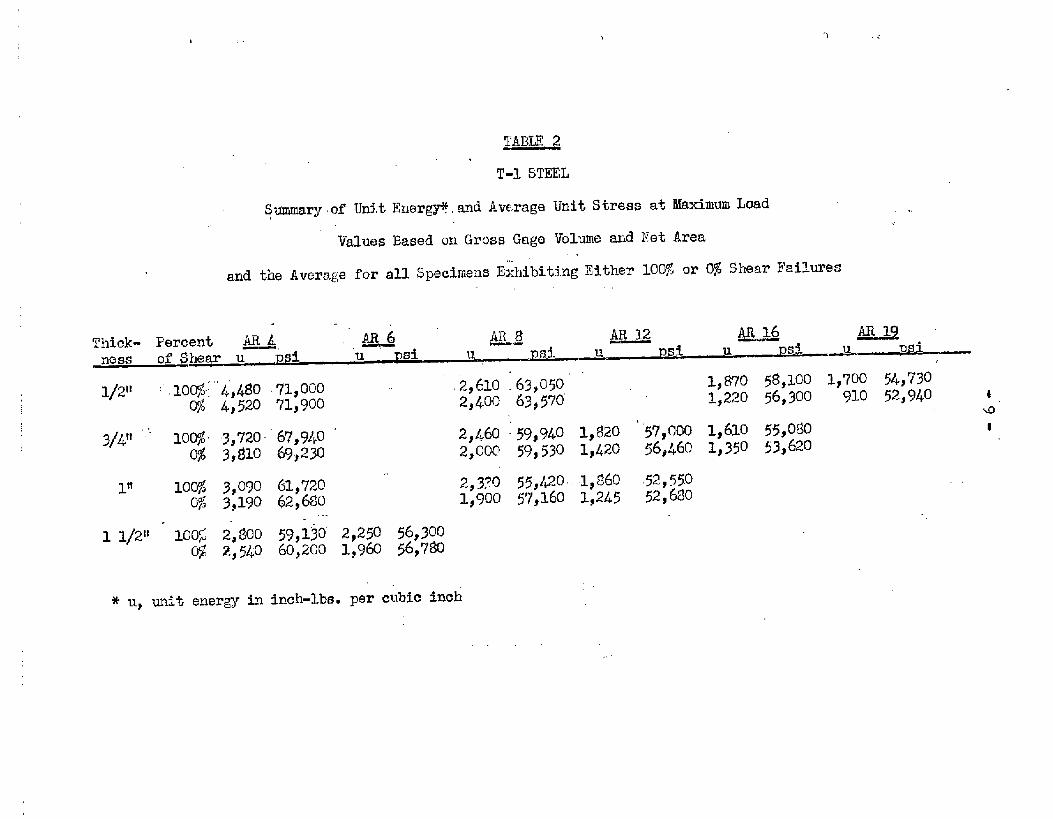
TABLE 2
T-3.STEEL
Energy+?,and Average Unit Stress at Maximum Load ..
Based on Gross Gage Volume and Ket Area,.
.-
and the Avers,.gefor all Specimens Exhibiting Either 1OO$ or 0$ Shear Failures,,
67,9,40 2/460 ‘59,940 1,820 ‘“57rO001,610 55,0WI
69>230 z,ocm 59,W l!42~ 56$460 l,350 53J@o
0$ 2,540
* LI, unit energy in
61,720 “’ 2,3?Q 55j4zow360 .52,550
62,680 1,900 57,160 1,245 52,680...
59,130 2,250 56,30060,200 1,960 56,7W
inch-lbs. per cubic inch
-1o-
0-.&:
-1rl
.
-
-11-
pet cross-sectional area afthe plate at the notch. The avera~es are
separately givenfor ail specimens exhibiting either a total shear
failure Or a total cleavage failure.
Unit En.e~xv
The
aspect ratios
energy absorbinE capacity of a
may be compared by considering
energy, designated as (u), as herein defined
tained by ditiding the total energy input to
given steel in different
average unit energy. tintt
represents the result ob-
maximum load by the volume
of the plate between gage lines. The umits of the computed, ,’
are inch-lbs. per cubic inch of metal. The volume is equal
3/4Wx~t or 3/4W2t (see Fig* 1) which may be termed ‘~gross,,,,,,
Thus, (u) equals El (3/.#t) ●
unit energy
to
gage volumeltc
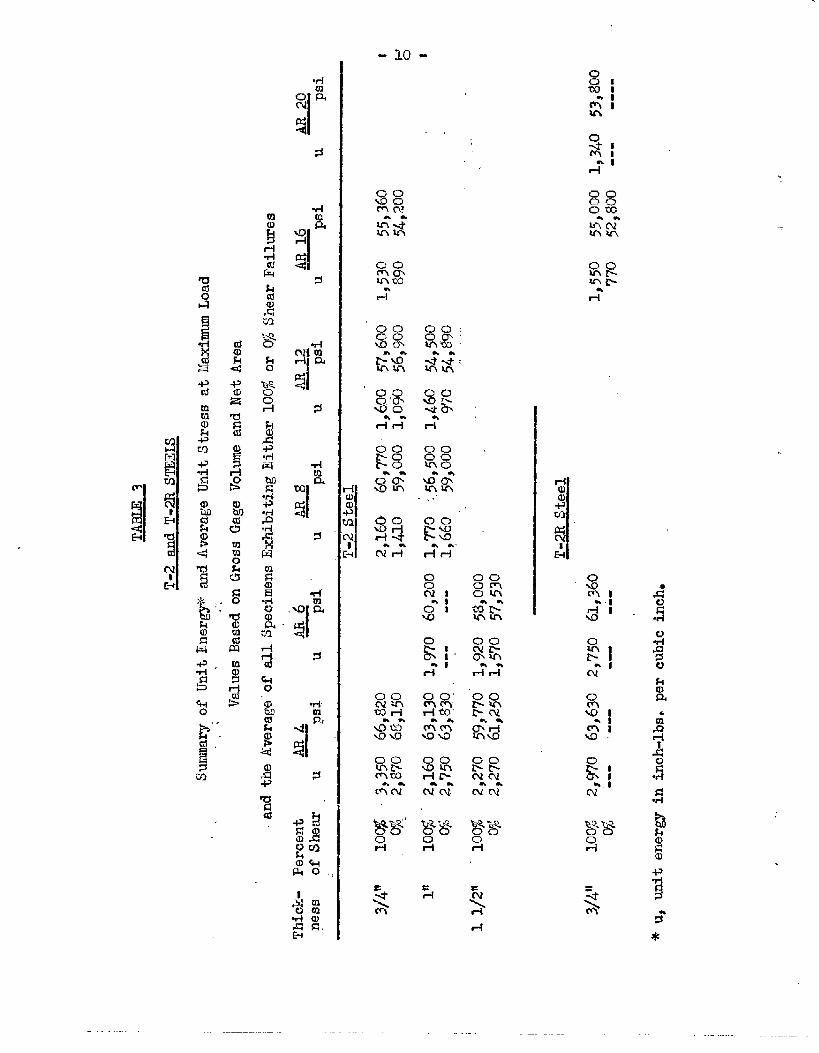
Table 2 mmnarizes the calculated average unit energies at
maximum load for T-1 steel. The average unit energies are given only
for specimens fatling in”10@ shear or ~~ shear, with all specimens..
,.of etther mode of failure be?.ngused in obtaining the average value.
Table 3 similarly summarizes the limited resul~s for T-2, and T-2R,,
Xespct%vely.
No consideration his been given to energy absorbed beyond
maximum load, “but’values are given in the tables
Avera,~eUnit Stress,. ,,
Average unit,,.,’ ..
area at the notch$ Tor
DISCIESION OF TEST RESULTS—-——
of Appendi~ 1.
,,,
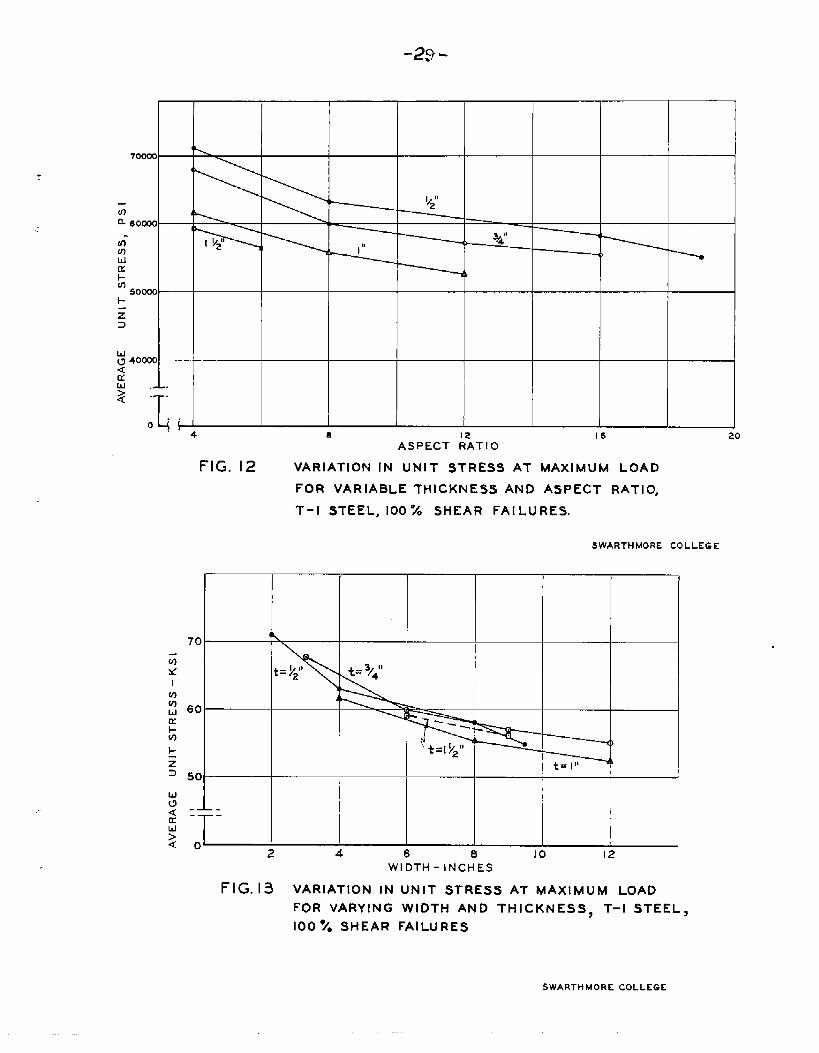
stress values at maximum load based on the net
T-1 steel? have been plotted in Figure 12 against
-12-.
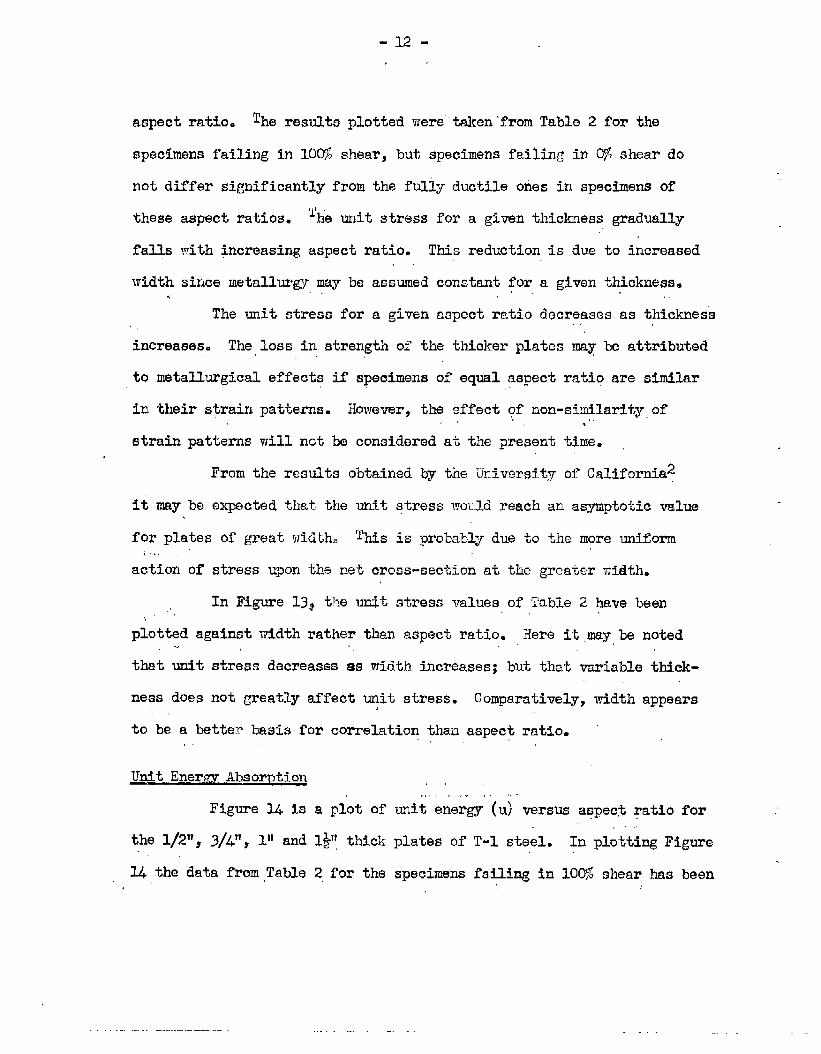
aspect ratio. The res~ts @otted were’”taken”frornTable 2 for the
specimens failing in 10Q% shears but specimens failin~ “inW2 shear do
not differ significantly from the fully ductile ones in specimens of
these
falls
width+
.,
‘he unit stress for a given thickness graduallyaspect ratios.
with increasing aspect rakio. This reduction is due to increased
since metallurgy may be assumed constant for a given thickness.,, ,. ,,
The unit stress for a given aspect ratio decreases as thickness,>
increases. The loss in strengtlnof the thicker plates may be attributed,.
to metallurgical effects if specimens of equal aspect ratip are similar,,
in their strain patterns. However, the effect ~f non-similarity,of,, .,.
strain patterns will not be considered at the present time.
From the results obtained by the University of California?
it my be expected that the unit stress wauld reach an asymptotic value
for plates of great wiclth- This is probably due to the more uniformi,,. ..
action of stress upon the net cross-section at the greater width.
In Figure 13$ the unit stress values of Table 2 have been.,,’”
plotted against width rather than as~ect ratio. Here it,may be noted. .
that unit stress decreasss as width increases; but that variable thick-
ness does not greatly affect unit stress. Comparatively, width appears
to be a better basis for,.
~nit Enerxv Absorption
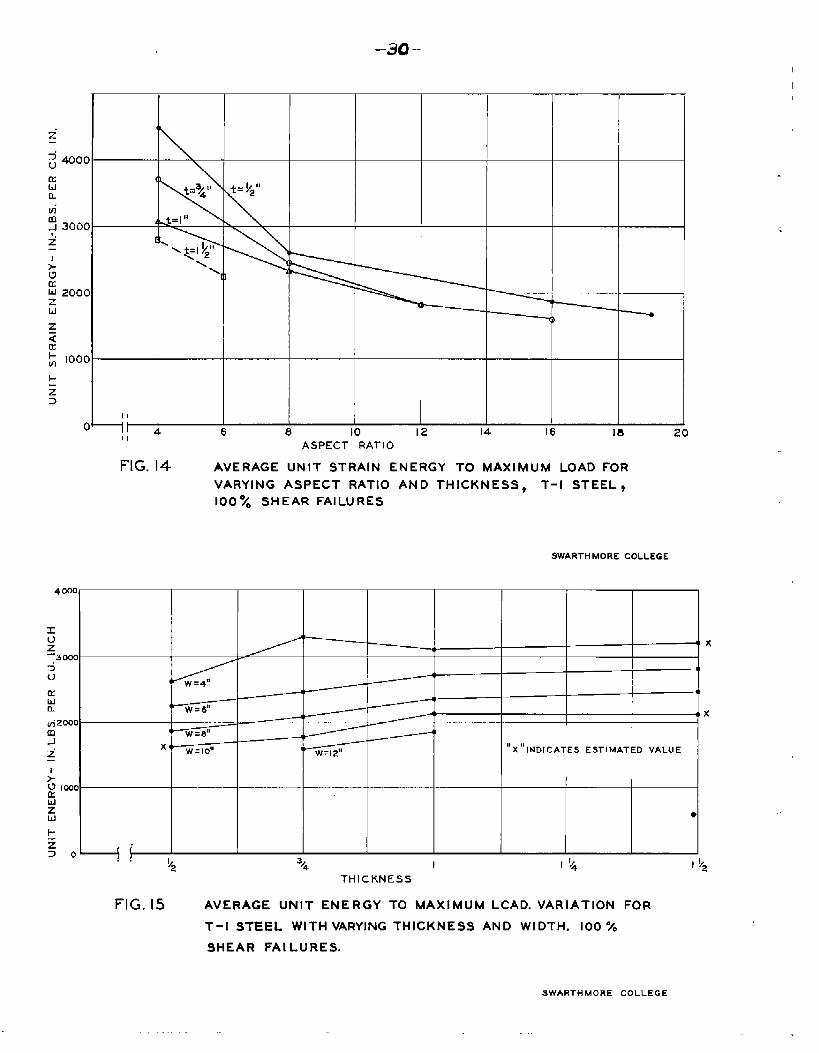
Figure 14 is a
correlation than aspect,,
plot of
the 1/211,3/4tr,111and l~-rfthick
14 the data from,Table 2,for the
,>., .,,.. .,. ,
unit energy (u)
ratio.
versus aspec,tratio for
plates of T-1 steel. In plotting Figure
specimens failing in 100% shear has been
-. —.
-13-
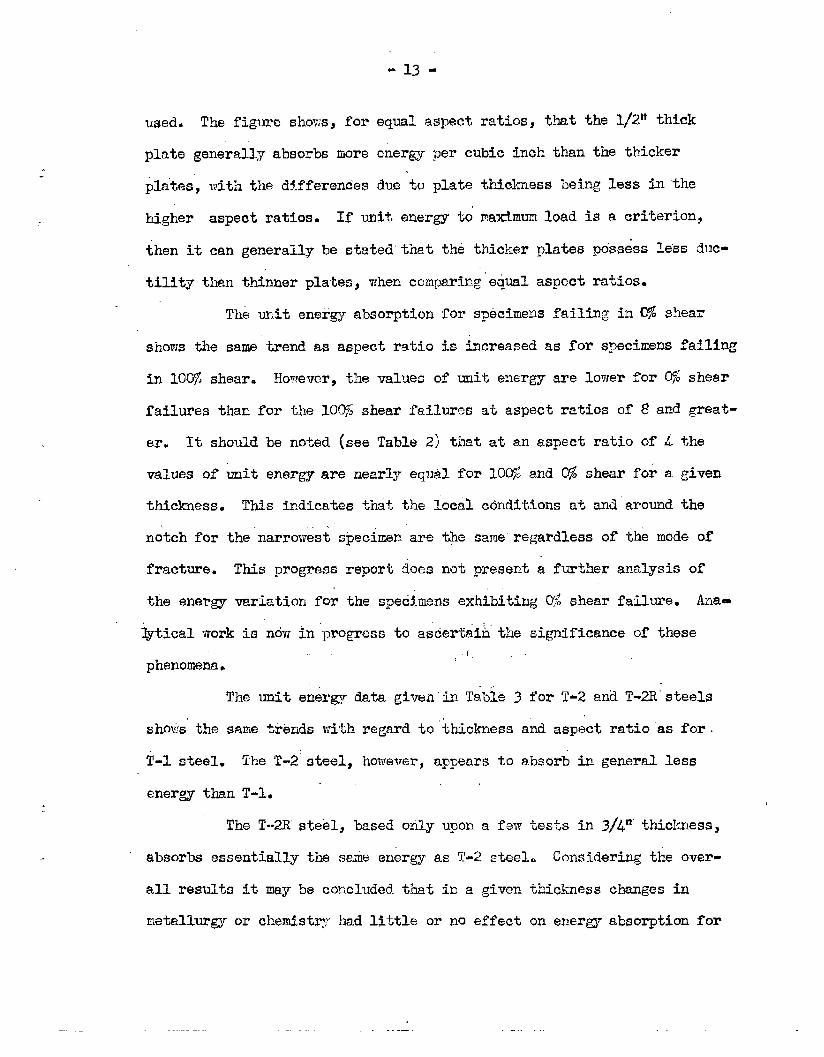
used● The figure shows, for equal aspect ratios, that the 1/211thick
plate generally absorbs more energy per cubic inch than tinethicker
phtes’, with tiledifferences due to plate thickness being less in’the
higher aspect ratios. If unit energy % maximum load is a criterion,
then it can generafiy be stated’thet the thicker plates pdssess Ie”ssduc-
tility than thinner plates, when comgarin.ge@al aspect ratios.
The unit energy absorption for specimens failing in 0% shear
shows the same trend as aspect ratio is increased as for specimens failing
in 10W shearq However, the values of unit energy are lower for O% shear
faihres than for the 100$ shear failures at aspect ratios of 8 and great-
er+ It should be noted (see Table 2) that at an aspect ratio of 4 the
values of umit energy are nearly eqtil for 100$ and 0% shear for a given
thickness. This indicates th~t the lac~l conditions at and around the
n~tch for the’narrowist specimen are the same”regardless of the mode of
fracture. This progress report ~oes not present a further analysis of,.
the energy variation for the specimens exhibitin~ 07 shear failure. Ana-
~tical work is now inpragress to asdert~inthe significance of these.i, ,.
phenomena,
The unit energy data given’in T~b~& 3 for T-2 and T-2R’steels
shoiisthe same tiends with regard to thickness and aspect ratio ’asfor.
T-1 steel- The T-2”steel, however, appears
energy than T-1* “
The T-2R steel, based only upon a
*O absorb in general less
few ‘hes% in 3/4n’thickness,
absnrbs essentially the ss,iGenergy as T-2 steel. Considering the over-
all results it nay be concluded.that in a given thickness changes in
metallurgy or chemistry had little or no effect on energy absorption for
-.
-u-!,
these two steelqa ,.,
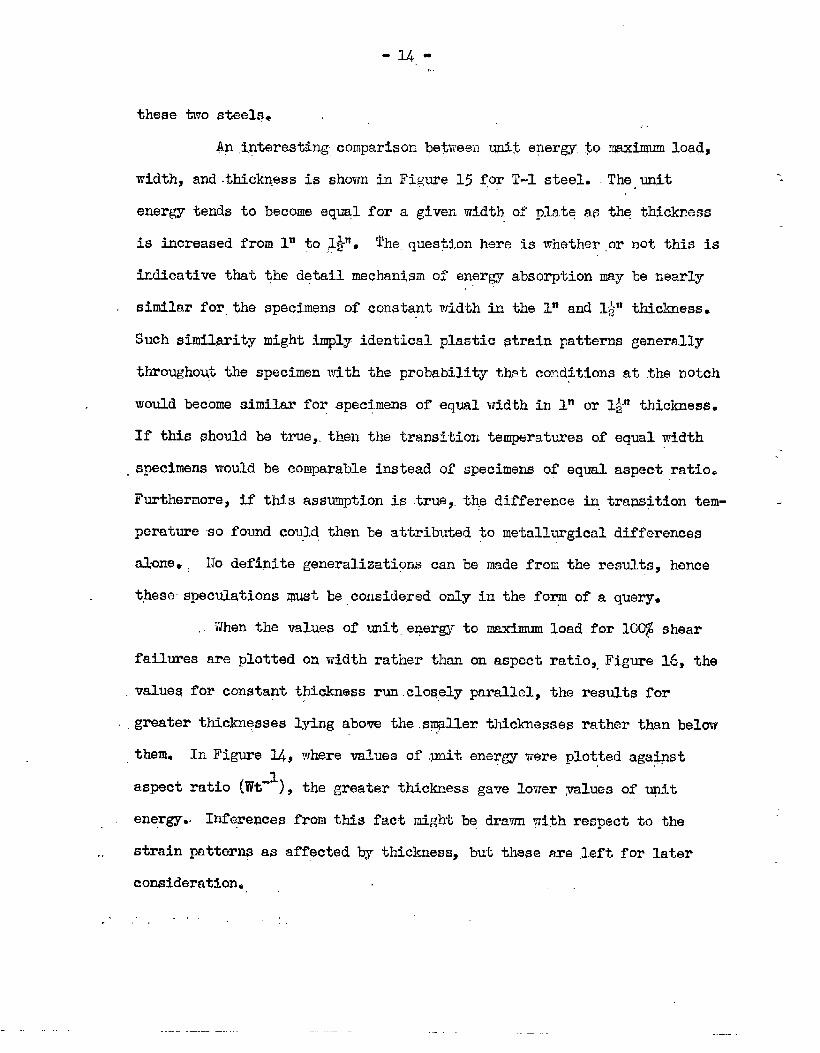
,~n,tgterestingcomparison between unit energy.$0 maximum Ioadj
width, and.thic~ess is shown in Fi;;ure15 for T-l steel. Theiun~t
energy tends to become ,equqlfor a given width of platq as the thickness
is increased from 1* to ;l~. ~heques~ion here is whether,or nOk this iS
indicative that the detail mechanism of ener~ absorption may be nearly,,.
similar for,the specimens of constant width in the In and 1~ thiclmess.
Such similarity might im@y identical plastic strain patterns generally
throughout the specimen with the probability th~.tconditions at the notch
would become similar for specimens of equal width in l?lor 1*-*1thickness.
If this should bs true,,then the transition temperatures of equal width..
specimens would be comparable instead of specimens of equal aspect,ratio-..
Furthermore, if this assumption is true,,the difference in tra~sitton tern- -,.
peratmre -sofound could,then be attributed to metallurgical differences
almem, 11odefinite generalizations can be made from the results, hence
thesespeculations must be,conside.redonly in the fmm of a query.
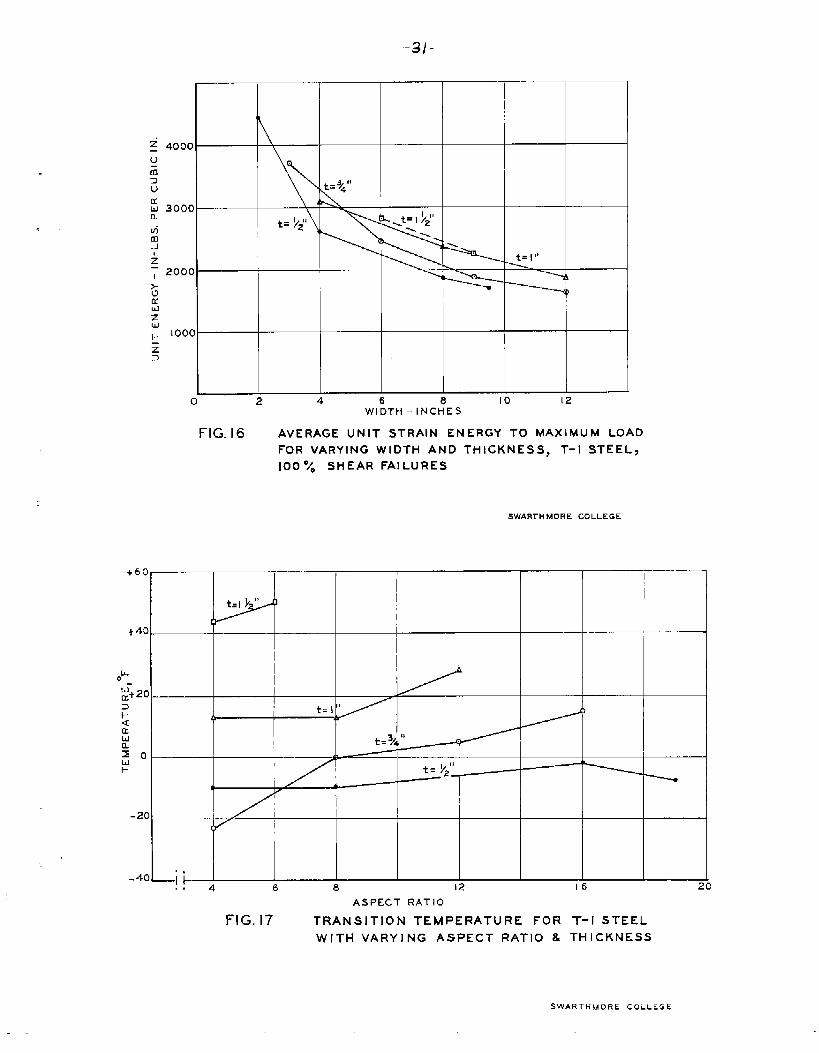
,.When the values of unit.energy to maximum load for 10C$ shear
failures are plotted on width rather than on aspect ratio,,Figure 16, the
values for constant thickness run.clo~ely parallel, the results for,.
greater thickii~sseslying abow the,s~ller thiokmesses rather than below,.
them. In Figure ~, where values of.pnit energy were plotted agaipst
aspect ratio @?t-l), the greater thickness gave lower ,yaluesof @t
energy.. Inferences from this fact might be drawn ~~ithrespact to the
., strain patterns
consideration.
.,”, ““
—
as affected by thickness, but these are ,leftfor later
—
,?F 8
-15-,<!.4.
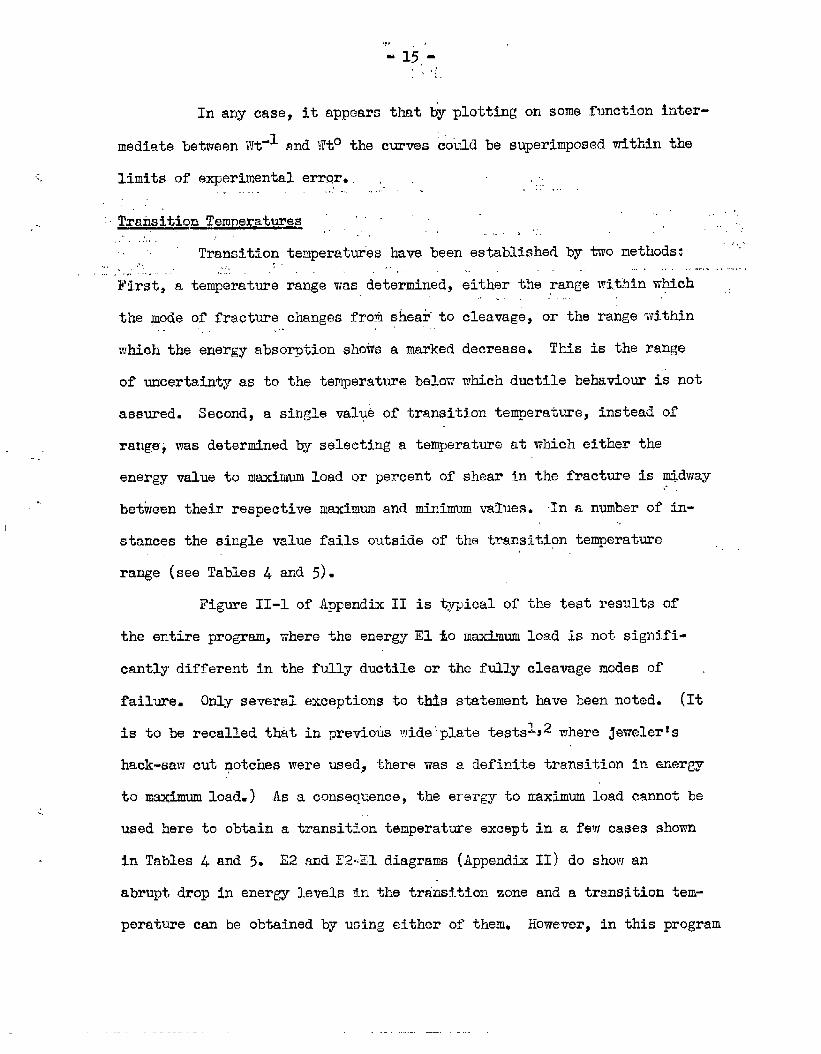
In any case, it appears that by plotting on some function inter-
“1 and Wt” the curves coti.ldbe superimposed within themediate between Wt
..’, limits of experimental errm.. , ,,..... ....- ... .: >.-
:-,Transition Temveratwes ‘,+
,,., ,..,.. ..<..,,,:.,.,., ,.,,,
,., , Transition temperatuiks have been established by two methods: ““., 1“: ,.’, ;, .
“ ..’ ....,., -.. . .,, -
First, a temperature range was determined,
the pode of fracture chang~s frotis~eatito.,. .,. ., ,.
which the energy abso~ption shoti~a marked
of Wcertainty as to the temperature below
. ,. .. ..... . . ......
either the range within which ,:.,...”: ....
cleavage, or the ra~ge within
decrease. This is the range
which ductile behaviom is not
assured. Second, a single valve of transition temperature, instead of
range’;was determined by selecting a temperature at which either the-
energy value to maximum load ~r percent of shear in the fracture is m~dway,.>>,
betwem their respective maximum and minimum ~alues. -~na number of in-
stances the single value fails outside of the transition temperature,.
range (see Tables 4 and 5).
Figure 11-1 of Appendix II is t~ical of
the entire pro~ram, where the ensrgy El to maximum
cantly different in the fully ductile or the fully
the test results of
load is not signifi-
cleavage modes of ,
failme. Only sev~ral exceptions to ttis statement have been noted. (It
is to be recalled that in previois wide”pkate testsL#2 where jewelerts
hack-saw cut potch~s were used? there was a definite transition in energy
to maximum load.) As a consequence, the erergy to maximum load cannot beL .,
used here to obtain a transition temperature except in a few cases shown
in Tables 4 and 5. E2 and 122-Eldiagrams (Appendix 11) do show an
abrupt drop in energy levels in the tramition zone and a transition tem-
perature can be obtained by using either of themm However, in this program
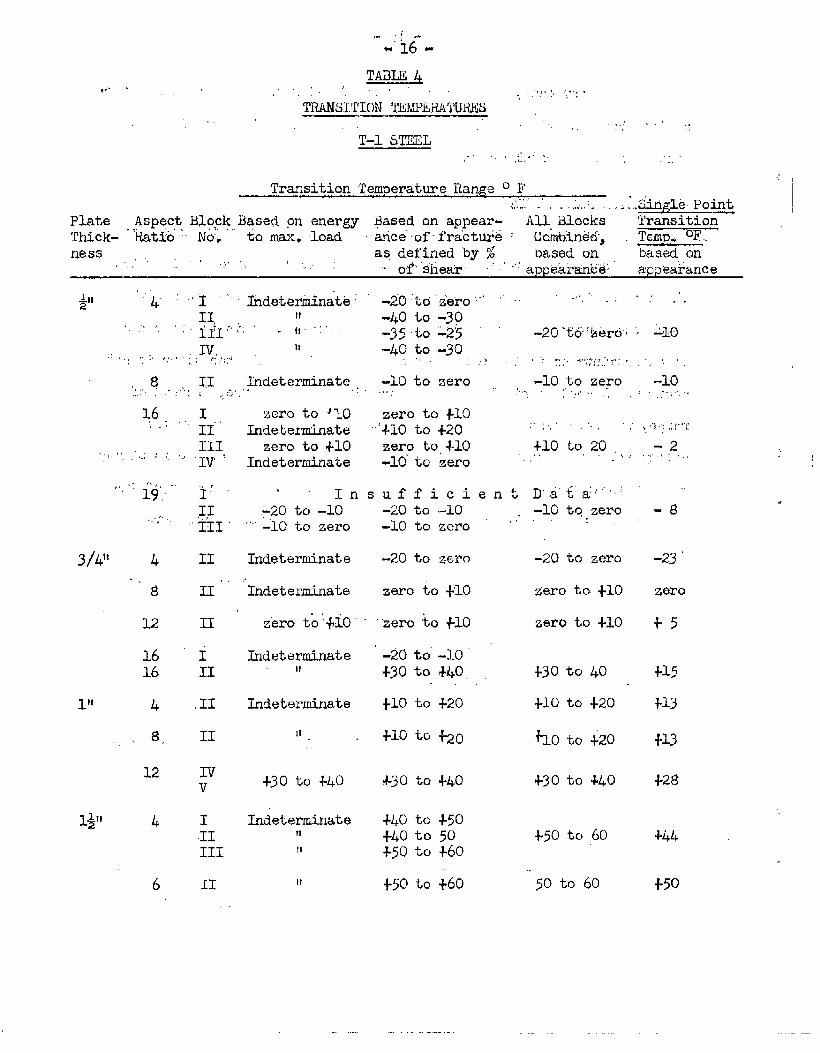
TABLE 4v.’- ,.. J ,-,..’ .....(..~,..,..,.,”
TRANSITION TEMPERATURES ““,,, ,,. ,,- ‘,, ,- :.,.,
T-1 bT~L,,
.. ...l*,.;...,,.,,, ,,..
Transition Temperature Range o F——.,,..,.- ,“.,........ ,:..,,$itigl~Point
Plate A,AspectBLo~k,Based on energy Based on appear- All+Blocks TransitLon—Thick- ~~~o ~om “to”max.load -atice’offra’cttie : Combj.nkd-,. Tap. ‘F..ne~s. .,. ... .nfi, O.,, as,defined by % based on based,,on
~“.< ,. ,,. ~f.”ghea.rl.:,’::~~ Qar&n~&;” appearance
& ‘,4. ,-, ~ ,.‘fideter’rninate’
IL..,,“,J,. ~.~,.......,,111,.:: “ -40 to-3Q-35‘to-25-4C to -30.,,. . .bIv. 11
.:, .,, ., :,, ,,, ..: ,..:,::..!,,,;.,.,
,,, e 1,1 Indetertiate,,.,.’,, ,.-J,.-,,,..,...i. ,,
.,, :; :. .;..,.:;4,:, :. . . . ,,.,
-lO,,tozero,.b, -.4(...7,
,,.,., ,
-lo,,.-!., ,.,, t
-10 to zero , ,,,.,..
36. ,., ~., zero to ~7.0..: 11 Indetertiate
III, zero to +10‘.l.~,.,:,,;;,:...IV Indeterminate
zero to +10:+iO to +20zero to,+10-10’to zero
;l, ,., -.,
+10 to 20 ,,.,., .<. ,’
,.j.,. . ;,.-}:‘. ,. ‘f ,
-2,.,,.,..,,.,
,,,: & ~,
II
,.In
.-20 to -lo“’’’-10to zero
~,af a,.,,,
-10 to,,zero,,
s uf f i c i en t-20 to -10-LO to zero ‘:
-E!,,.. .
Indeterminate -20 to zero -20 to zero
Zero to +10
zero to +10
-23 ‘
zero
+5
II
IndeterminateII”’ zero *O +10
II zero t6;+iO” ‘Zeru to +1012
III
-20 ti-lo’
+30 to +&o.
+10 to +20
1616
IndeterminateII +15
+13
+13
+28
+joto 40
+loto +20
+10 to +20
II Indeterminate
II
1114
+10 -k +20
12 STv +30 to +40 4-30to +40 +3cto +40
I11111
Indeterminatetl
MO to +50++oio 50+50 to +6o
+50 to 60II
so to 60+50 to +606 II II +50
-17..-
TABLE 5
TRANSITION TEMPERANJ.RES ‘
T-2 and T-2R STEELSLi@e Point
Plate Aspect Transition Temperature Range”°F Transition Temp.:-
Thick- Ratio Eased on Energy Based on appear= ‘F based on ap-
ness “ to hw. load of fracture as. ~arance as de-defined by Z of’shear fiiiedby ~ Of
~.shear
..
3/lk~~ b’ Indetermbate
e“ 11
12 ‘;’” ‘t,..
16 : - 1’
l!! 4 11
6 II
El !1
12 zero to +20
1*” 4 Indeterminate
6 II
T-a s~L .,
-20 to -10
-10 to - 5
-10 to zero
+10 to +20
-10 to zero
+10 to +20
+30 to 4-40
zero to +20
-17
-18
“-5
‘ +,2
~.
-7,.
+iO
+33
+13
+30 to 440 +30
+6o to +75 +66
T-2R STEEL
3/4” .4 (In sufficient Data)
6 (In sufficient Data)
16 Indeterminate -V@ ‘Lo+50
-..
..,,-
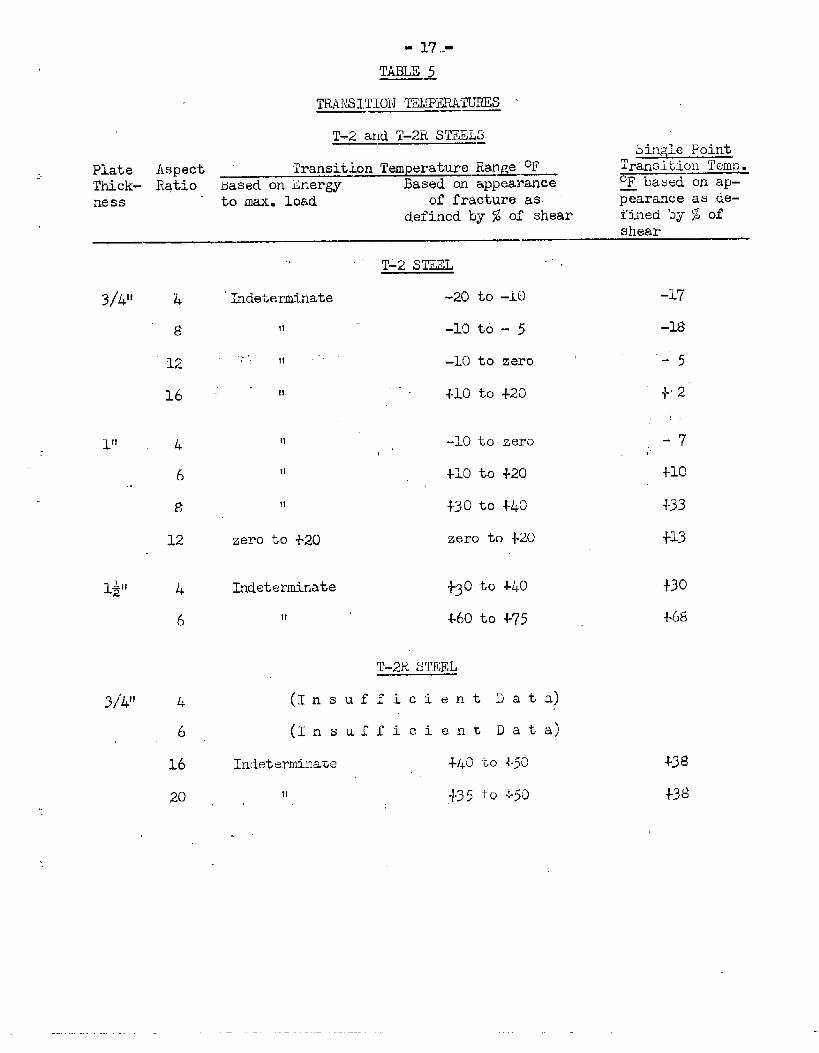
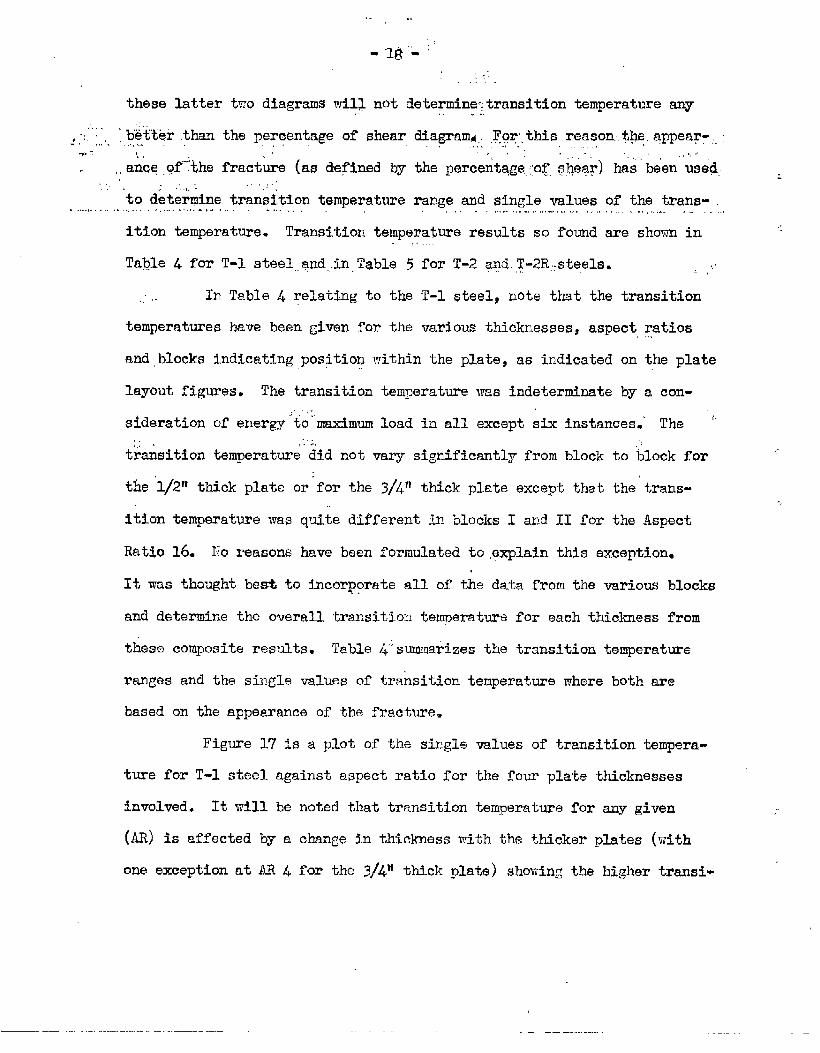
these latter two diagrams w~l~ not determinwitransitiontemperature any: .,..... . . ‘., ,
-,, b’et’’ei.thanthe percentage of shear diagram~, For”this reason,~~,qppear-,,-“!’’..,...,,.,.,,:. ..+,,,..,!, ,,, ...... .. .* .: .,. : .,.-. ,,,,.,,.,ancq ,qf~~hefractke (as defined by the percent~ge,,;of,shea~) ha~’’beenus~~,.
,, ,, ,.,,,,,,,. ,.to deter~ine transition temperature range and single values of the trans-.......,,..............-.....”........ . .......... ,. . ..4.+...................,,,, .<..!,,.... . .,,,
ithn temperature. Transition temperature results so found are shown in,.
Table 4 for T-1 steel,and,,in,Table 5 for [email protected]::steels. ..
,,’,. In Table 4 relatimg to the T-1 steel, note that the transition
temperatures have been given for the various thicknesses, aspect,~atios
and,blocks indicating position within the plate, as indicated on the plate
layout figures. The transition temperature was Indeterminate by a con-,.,..
sideration of energy to”’rnaximumload in all except six instances.’ The
,.:. ,,. ...transition temperature did no-tvary significantly from block to block for
., ,.
tbe 1/211thick plate or:for the 3/4Vtthick plate except that the trans-,. -,
ition temperature was quite different ~m.blocks I and II for the Aspect
Ratto 16.* No reasons have been formulated to ,pxplainthis exception
It was thcmght bes% to incorporate all of ths data frop the various blocks
and determine the overall transition temperature for each thiclmess from
these composite res~ultsa Table ~“’summarizesthe transition temperature
ranges and the single values of transition temperature where both are
based on
ture for
the appe~rance of the fracture.
Figure 17 is a plot of the single
T-1 steel against aspect ratio for
involved. It will be
(AR) is aftected by a
one exception at AR 4
noted that transition
values of transition tempera-
te four plate thicknesses
temperature for any given
change in thickness with the thicker plates (with
far the 3/.4Mthick plate) showing the higher transi-
—— -- .——. ..— —. —
-JfJ-.
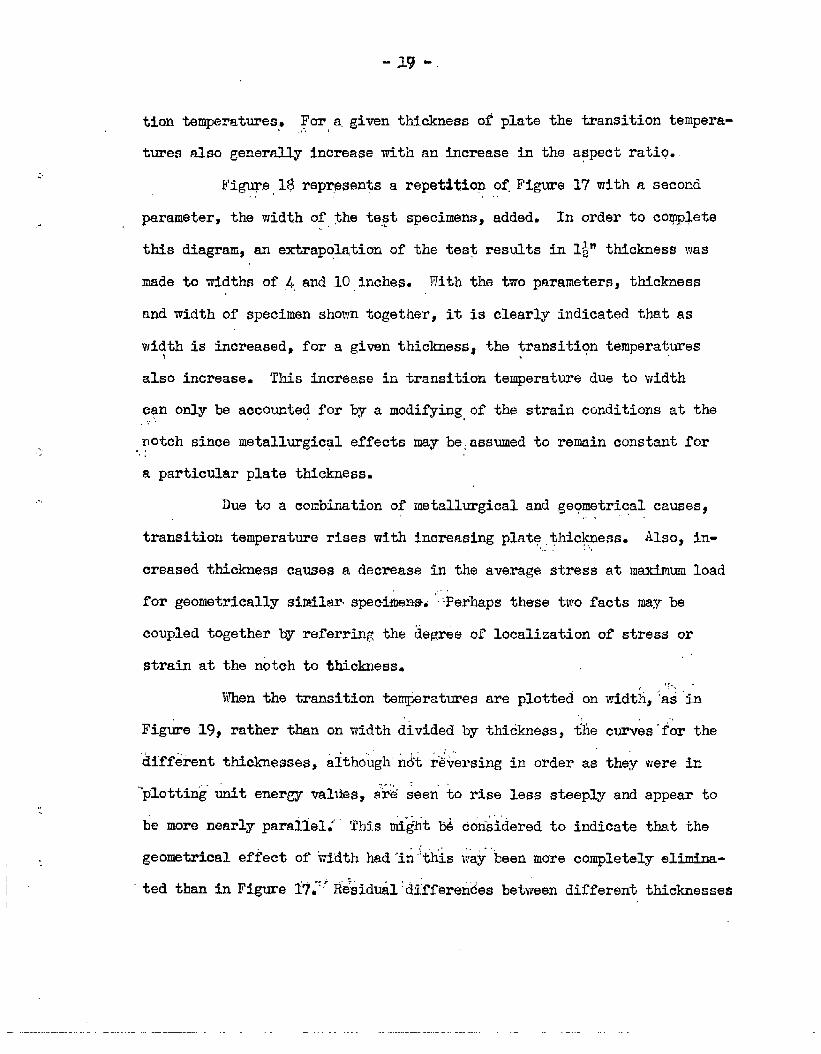
tion temperatures: For a,given thickness of plate the transition tempera-.,..
tures also generally increase with an increase in the aspect ratio.
FigW.e 16 reprpse~ts a repetition of.Figure 17 with a second.,, ,,.
parameter, the width of the te$t specimens, added, In order to cog@ete..
this diagram, an extrapolation of the test results in l$ttthickness was
made to widths of 4 and 10 inches- .With th~ two parameters, thickness
and width of specimen shown together, it is clearly indicated that as
width is increasad, for a given thickness~ the transition temperatures‘1 .
also increaseti This increase in transition temperature due to width
can only be accounted for by a modifying of the strain conditions at the.+.
notch since metallurgical effects may be,assumed to remain constant for-.:
a particular plate thickness.
Due to a combination of metallurgical and geometrical causes,,.
transition temperature rises with increasing platethic~ess. Also, in-
creased thickness causes a decrease in the average stress at maximum load
for geometrically sitiler.specitierw ‘Perhape these tw~ facts may be
coupled together by referring the degree of localization of stress or
.,strain at the nbtch to thickness
!:.,When the transition temperatures are plotted on widt~,<as‘in
Figure 19, rather than onwidth divided by thickness, the cur~s’for the
‘&iffetientthickn~sses, a~though’n~t ’reversingin order as they were in
‘plottingunit energy valties~a~e seen’to rise less steeply and appear to
be more nearly para~lel.’” “-This mig~t b~ coti~~deredto indicate that the
geometrical effect of kidth had”i~{t~is i~ay’beenmore completely elimina-
ted than in Figure ~7~TR~~idual :differendesbetween different thicknesses
—. -.. .—
-~lgy.
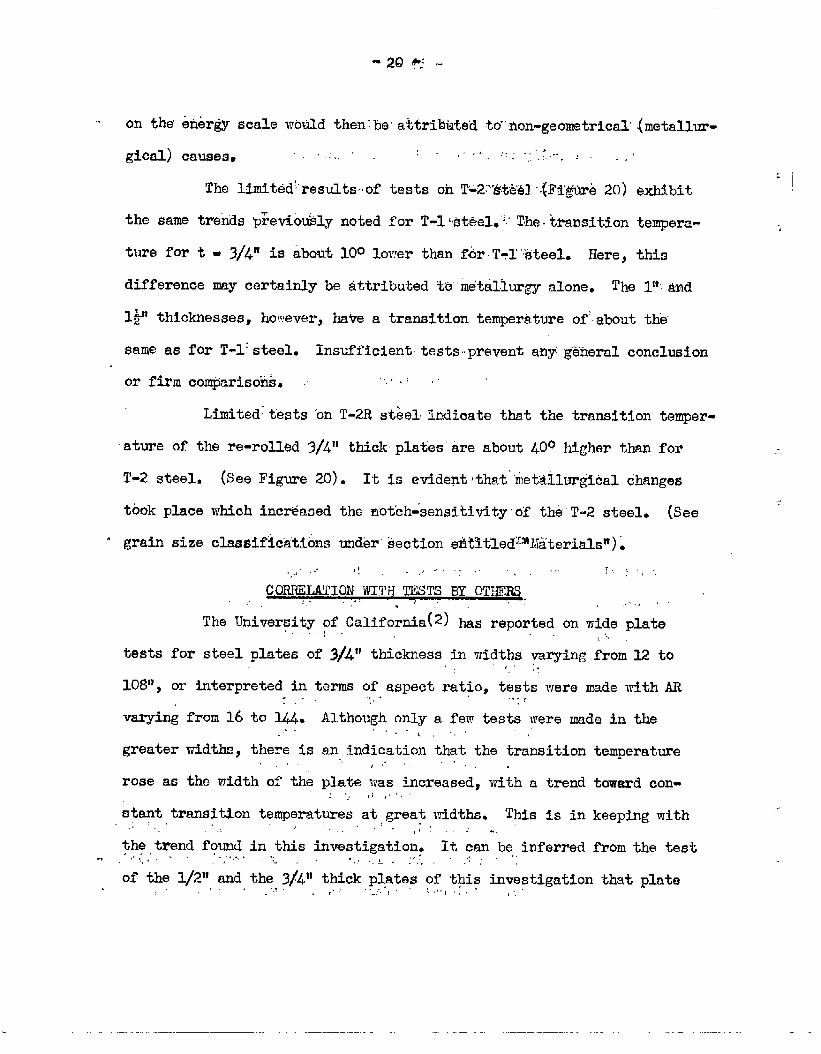
4. on the{ei&& scale wo-tidthen:be’a~tribtiteidto”’fion-g~olietrical(metallur-
gical) causes. ; -’ : ‘ “ “4”.“-:“,:”’:.”””.: .’
The limited;”results-.oftests oh T02%te&l”.[F%@re 20) exhibit
the same trends p~evi6usly noted for T-l%t@el.’~:’Ths-transition tempera-
ture for t = 3/4n is abotit100 lower than f6rT=1:Steel. Here, this
difference may certainly be Attributed td’mdtallur~~ alone. The Iriamd,, .
1P thicknesses, however, ha~e a transition temperature of’about the
same as
or firm
for T-l’steel. Insufficienttestsprevent any gdheral conclusion
compariso’tis~, .1.,,
Limitedliests ‘onT-2R st~el Indicate that the transition temper-
ature of the re-rolled 3/4? thidkplafes’ire about 400 higher than for
T-2 steel. (See Figure 20). It is etidegt’thai”’rnetallm~~alchanges
took place which incfiased the notbh=sensihitityd? fib*’T-2steel. (See
“ grain size classifictitions”under”~ection etititled~ml~~teri~sm).
,, ,: !,.’”” ‘:,”4. l“” 1.,;,,.,
CQ~LATION WITH TESTS BY OT.-,. ,. ,.. , ‘ .“” ,,,,.,
The Univer~ity of California(2) has reported on wide plate...!. ,,‘~,,’
tests for steel plates of 3/41]thickness in widths varying from 12 to/!’:.
108’1,or interpreted in terms of aspect ratio, tests were made withAR
varyinggreater
rose as
. . ..,
from 16 to W....
widths,there is.:,
the width of the
.-, .-,r
Although only a few tests were made in the,,“..,, ,.,.
an indication that the transition temperature,, .,4 ,“ ‘. ,,
plate was increased, with a trend toward con-
stant transition temperatures at great wid-ths~ This is in keeping with.,: .,,, ., !. ,, : i ● .
the trend fo~d in this investigation. It can be inferred from the test,,.,,,. .-F ,,, ,..-,,,..; 1.!,“ .,’. .,.,!..,!,.’ ,-;;,’:.
of the 1/2” and the 3~411thick pl,atesof this investi.gatlonthat plate.,4,’ .::” . ,’~ ““.{.! :..,)...” ,’.’
., .-. -. —
.,. J,
-21 -
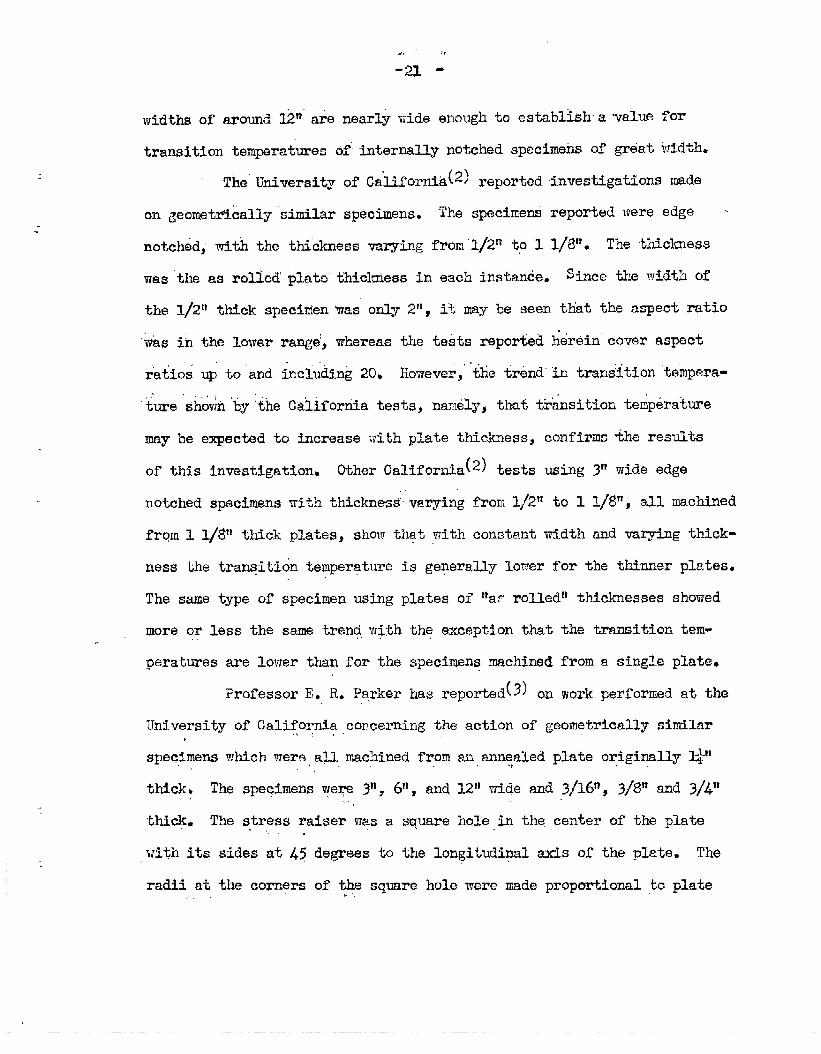
.,,widthsof around 12w are nearly wide enough -Loestabl~sha “valuefor
transition temperatures bfinternally” notched specimeks of gr6at btdth.
The University of Ca”lifornla(2~reported investigations made
..on geomettiically‘similarspecimens. The specimenS reported were edge --
notched; with the thickness varying from”l/2f~to 1 l/81t* The thickness
was “theas rolled “p”lata”thiclniessin each instance. Since the width of
the 1/21~thick specirnenmas”only 211~ i% may be seen tliatthe “aspectratio
‘was in the lower range, whereas the teats reported ~erein”cover aspect
ratios uy to’and including 20, Howeve~z’”ttietrend”’titransition’tempera-.,. .,
“ture Shovii’ky;+heCAlifotiia tests, naniily,that transition tempertiture
may be expected to increase with plate thickness, confirms %he results
of this investigation, (Other California 2) tests using,.
notched specimens with thicknes$’vaging
frgm 1 1/811thick plates, show that with.,
from 1/211to 1
constant width
31’wide edge
1/8”,all machined
and va~ng thick-
ness the tranqiti6n tmperqture is generally lower for the thinner plates.
The same type of specimen using plates of ~~a:rolladcrthicknesses showed
more or less the same trend,with the exception that the transition tem-,.
peratures are lower than for the specimens machined from a single plate.
Professor. R. P~rker has reported(3) on work performed at the
University of California concerning the action mf geometrically similar,..
specimens which mere,a>l machined from ai~,ann:aledplate origi~ally ~t
thick, The speqimens we~e 3“, 6’1,and 3.2’1wide and 3/16n,3/8nand 3/4tt.,
thi@c* The stress raiser W3S a squarehole in the center of the plate,,,,
with its sides at 45 degree~ to the longitudinal axis of the plate. The
radii at the corners of the square hole were made proportional to plate..: !.~.
.-.
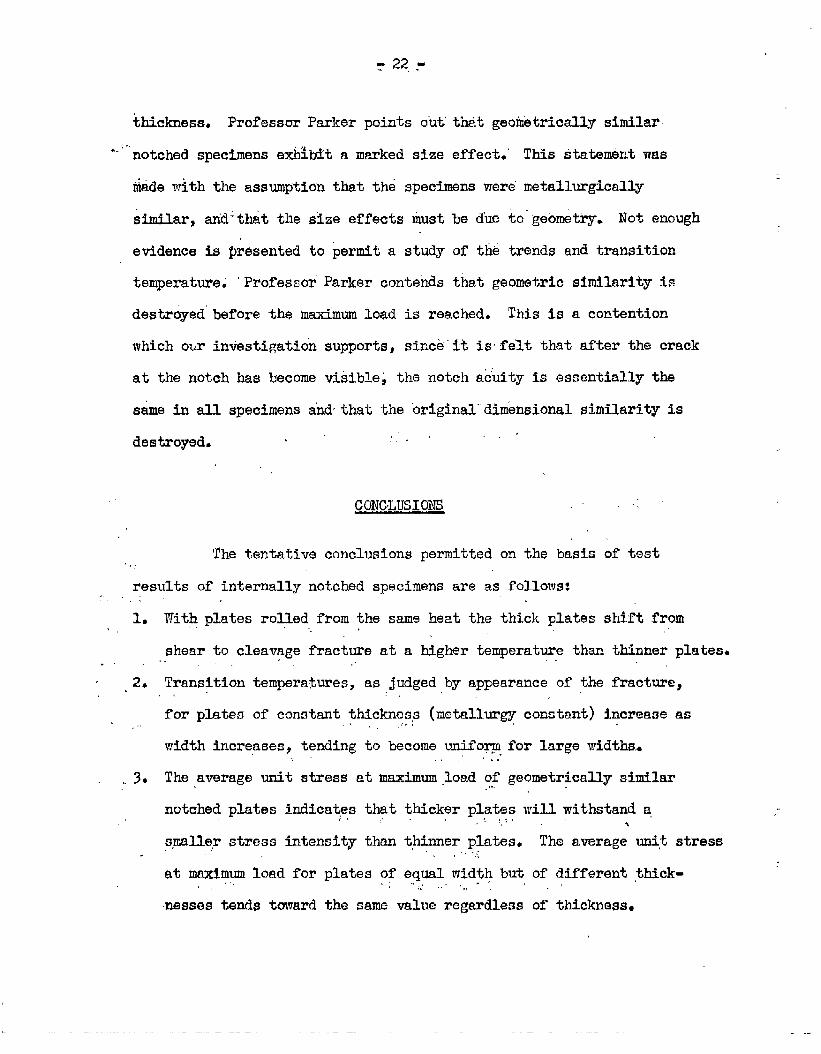
y 22.-
thicknessz Prof~ssar Parker points out’ttit geometrically similar
notched specimens e~bit a marked size effect.’ This Qtatement was
made ~tiththe assumption that th6 specimens were metallurgically
<.sitilar, arkl:~ht the s“izeeffects in.xstbe due to geometky.. Not enough
etidence is presented to permit a study of the trends and transition
temperature; ‘Professor”Parker contends that geometric similarity is
destroyed before the timum load is reached, This is a contention
which our intist~gatio’nsupports, sincb’1~ is”felt that after the crack
at the notch has become Vi&ibley the notch actity is essentially the
same in all specimens a“ndthat the “original””dimensionalsimilarity is
destroyed... . ,.,,,,
CONCLUSIONS
The tentative conclusions permitted on the basis of test,,,<
results of internally notched specimens are as follows~.. ..:
1. Witp plates rolled from the same heat the thick plates shift from,, ,’
shear to cleavage fracture at a higher temperature than thinner plates*. . . ‘. ,.,.
,2. Transition temperatures, as judged by appearance of the fracture,,.
for plates of constant thickness (metallurgy constant) increase as,,, ,., /.;
width increases, tending to become umifo~. for large widths,-.. ..,’ ‘,”
.,3* The,averagemit stressatmaximuu.loadOf geometricallysimilar
notchedplatasindicat,e,sthat thickerplateswill withstanda:. ..,:,,, \
:,mall?,rstressintensitythant,hinnerplates. The amrage uni,tstress, ,,:
at maxtmumloadfor platesOf equalwidthbut of different,thick-!,”. ,,?.’..”,.,,
nessestendstowardthe same valueregardlessof thicknass~
L .— —. .— — —.
-23”,,
.
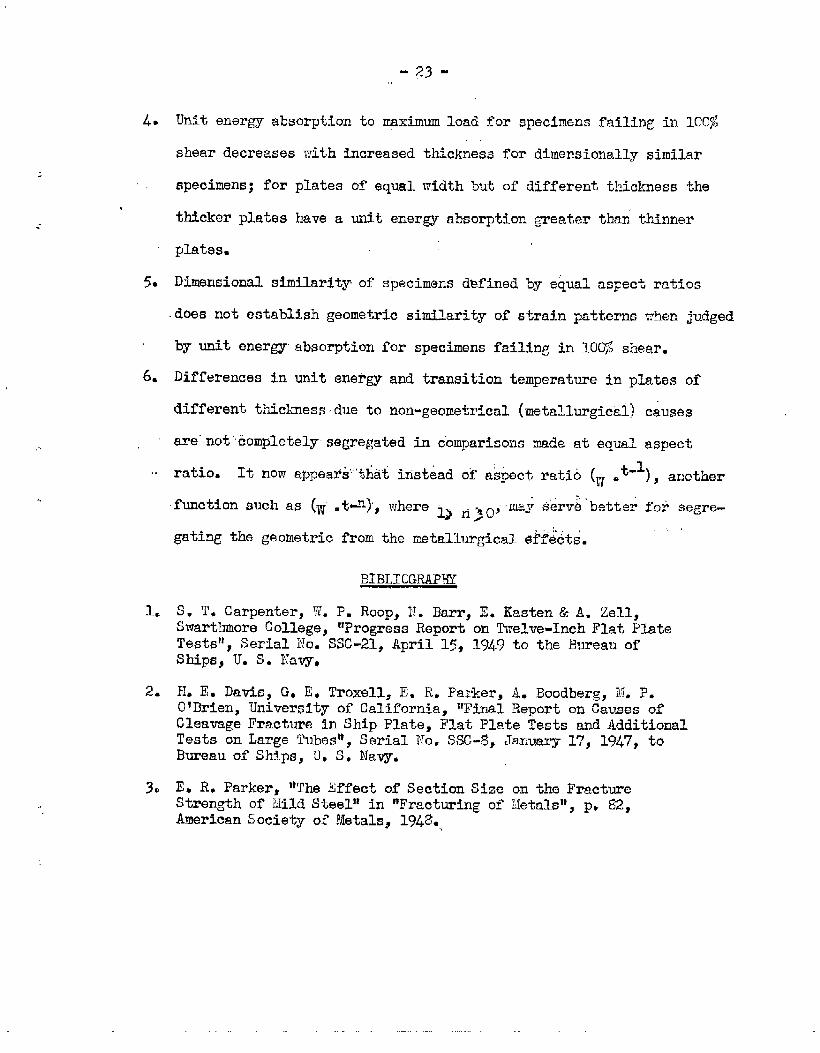
4* Unit energy absorption to m.@mumload for specimens failing in 100%
shear decreases with tncreased thickness for dimensionally similar
specimens; for plates of eqiml width but of different thickness the
thicker plates have a umit energy absorption greater than thinner
pl~t~Sm
5* Dimensional similarity of specimens d~fined by equal aspect ratios
does not establish geometric similarity of strah patterns when judged
6.
..
1.
2.
3.
by umit energy absorption for specimensfailing in 10G~ shear.
Differences in unit eqergy and transition temperature in plates of
different thicknessdue to non-geometrical (metallurgical)causes
are’not”fiompletelysegregated in comparisons made at equal aspect
ratio. It now appeads’’’th~{itisteadof aspect ratio (W *‘-1), another
function such as (W’~t~n), where m~ serv;”better foe segre-Q n>o’
gating the geometric from the metallurgical ef~dctsm.,,
BIBLIOGRAPHY
S. T. Carpenterj T. P. Roop, N. Barr, E* Kasten & Am Zen,SwarthruoreCollege, ‘iProgressReport on Twelve-Inch Flat PlateTestsil,Serial No- SSC-21, April 15, 1949 to the Eureau ofShips, U. S. Navy,
H. E. Davis$ G. E. Troxell, E. R. parker, As Boodberg, IL P-OfBrien, Universlky of California, “Final Report on Causes ofCleavage Fracture in Ship Plate, Flat Plate Tests and AdditionalTests on Large Tubes”, Serial No. SSC-~~ January 17, 1947, taBureau of Ships, U. S. Navy.
E. R. Parker, *YYb.eEffect of Section Size on the FractureStrength of Mld Steeltrin ItFracturingof &lAsltj p. 82,American Society of Metals$ 1948~,
7 ,,
4-
.ACKNQWI.EDGMENTS
,,, ,
The investigation herein reported has been under the direct
supertisionofSO T. Carpenter, Captain W_ Pm Roop, :mN (Retired) has
been a constant advi~er and collaborator. Th~ testing has be~n done
underthe supervision.gfA. W= Zen and E. Kasten. .’
Theodore Bartiiolomsw,Eugene Urban and Lawrence Robbins
prepared all specimens and assisted in testing. Drawinga of the report
were made by John Calvin, Roy Bosshardt aqd Hmry Rueger. Mrs. Ruth
..Sommerhas performed all stenographic duti~. . ,.
~he.investigat~rs are deeply tndebted to Dr.tiFlnnJonacsen,
Project Coordinator, and Dr. William
Structure Advisory Ccymittse,,and to. ,,.. , ,,.
much helpful advic~~ Y
. . , ..,.,, .’,
,., ,,:’,
f“ ,“., .,.
,L.
.,,
Baldwin .Chairmanbf the Ship-
t~e megbersofthe Committae, for
.,,
P,”,.
. ..,,.
%
.,.
.,.,,l. .! ‘., ., .“ ,,, .
. .....’-.. ,. 4
., ~., ,, ,;’! ,.
,., ., .,
,.,,
25
I
..--— ——— .
II
——
,
——— ———
--biDRI L HU_ES
——
-——— ——— ———— —
J
ASPECT RATIO = &
t DIA. OF DRILL HOLES
T. . . .
1“
T2-.. . . . . .
3“ ~’~-- . . . . . .._f34
111
y
_+- ------16~il 3“
‘2____ ___-.. m
DRILL HOLES
f —
ENLARGED
VIEW
FIG. I
TYPICAL SPECIMEN
EaWARTHMORE COLLEGE
9-6-49
.=-[3
E-15
.=-15 F-16 E-17
—9 ;
1–1 TD-4 D -5 0-6
G-8
G-12 ‘w.
+13 H-14
I-2
II F-21
+
G-5 H-3 H+
B-a 0-7 ~
❑ -3 B-5D-2
WI ❑ + D -3 G-7
I
It
m
n?
DE-27 c-32A.
I ‘“24I ‘“2’ I
‘-a FF
Z!!kiB-n ~-1,❑ -15
D-10 D-13 G-11— Diz8-14 B-I*
R44H-1.?
— G-16
0-15 ~+e B.lg
~-,* 0-21 D-[3
G-10 D -20
D-17 ~J/2 D-19
=-k#-d I H-[l IG-13
!G-14
1B- 17
I I III
G-la H+5 G-17
0-20__bd I “--l
~- 3“.8“- Dlf7EcT10N OF I?OLLIMG+
A– 2’X 8“
G - 4“X n“STEEL T-1
—D[sEcTlOH or ROLLING-
0- 6’= 8“
H- e’k [2”
G - 12-X 24”
I- 15’x 24”
STEEL T-1E- 8s: i2’r
F- 2+ 18”FIG. 2
F[G. 33“~ PLATE LAYOUT T-1
sWARTHMCI?E COLLEGE
,1,
+ PLATE LAYOUT T-1Swmmm couxGE
II-QmI
SCPLE - 0.5”= 8“ SCALE– 0.5-- B“q-7-49
9-7-49
.,
F1
E
I
Y
G-1
IG-2
I
T rG-203D-1 D-3 D -4
G-3D-2 C-5 D -6
c-? D-9 D-1 0
G-40-6 0-11 0-12
G- I I G-2 / WA?,
II
E -4c-4
G-3
1c-9 c-lo C-[1
E-8c-j 2
E-9
E-10 E-II E–12j Ci3 C-[4 I C-15 .
G-5 I G-6 I )-3$
~ /
I I
6 2’—.
=60-+
6 DIR~lON OF ROLLM3G _
c - 4’X B’E- O-X12”
G- ll$x24-
STEEL T-1
D– 6-X9”— DIRECTION G+ ROLUUG d
G - 12“)! 24”
STEZL T-1
FIG. 4 FIG. 5l’PLATE MYOUT ~-i
SWARTHM31?E CGLLEGE
9-6-49
1+’ PLATE LAYOUTT-Isw.wm+tmFIE WLLE.5E
9-7-493C4LE- a5.= *-
5Ck E— 0.5. = E’
‘h ,
,..,
XG-45
I m-3K- 3 X* 7 XG-I 2
XI-4 Xe -5
x B-a
xH-5XD-4
XG- 4 XG- 8 K-13XB-7
Xc-b
HH-0
XG-13XD-5
XG-V X-14Xn -9
XH- ? Xc-lo
‘OR CHA RP’f TEsT
LEGEND DIREcTIoN OF ROLLW4G
XG-3/i’X 12”X 24” FIG. 6,,XH-3/4 X 9’” x 12”
,,XD-3/4 X 6“X 12”’
XB-+4a’ X 3“ X 12”’
—
—
LEGEND
XG - rx r2”x Zi’
~[’ ~LATE LAYOUT )( D-~ 6:x 12;
4 STEEL T-2 ;~;;.; ;..; l;,5WARTHMORE COLLEGE
x1- I“)(l<x 30”8-29-50
DIREcTION OF ROLLING—.LEGEND
XD - O-X 12-
XH-9-X 24.
XG- 1 I XG-4 I XI- 1 I XI-5
XE- 1 XE-2XG- 2
XD-5 xD-5 X1-2 %1-61
XD- 1 x0 -2 xc-7 XC-4 xc-s
Kc-d XC-2 MC-3XE-3 xE-4
KC-4 x+ K-6x1-3 X1-7
XD-3 XD-4 ‘-‘0 ‘-” ‘-’2
XG-13 I xE-5 xE-6 I XI-4 I X1-B
I IXG- 3 I xc.- 5 I I
XH- 1 XH-2 XD-1
m-z
X H-3I ‘H-4 hz--1 I
SE CT ION-2
REROLLED T03/4” THICHNES3
SECTION- I I.REROLLED TO +4 THICKNESS
)iH-5XD-4
2-12%24”
XD-5
HH-4X D-4
DIRECTION OF ROLLING
FIG. 7
I“PLATE LAYOUT
ST’ EEL T-2
SWARTHMORE COLLEGE ,
e-20-50
L 1o’– 0“
II GIG I III
I‘0
-4 IG
IG
IG
I II I
B 10 BI ❑ c c
c c c
G G c c cI
RE -ROLLED
STEEL T-2R
LEGEND:AR
❑ -3-X 12” 4
FIG.8A
l~” PLATE LAYOUTI - t5° X 24 20
C-4)’JX 12” 6
G-12”X 24” 16
FIG. 8B
%’PLATE LAYOUT
FOR RE-ROLLED T-2 STEEL
STEEL T-2SWARTHMORE COLLEGE
SCALE: &= 1’-0’
SWARTHMORE COLLEGE
9-12-50
THICKNESS AND WIDTH THICKNESS AND WIDTH
4
6
a
12
15
lb
20
— 4
b
a
.6114,5’
6,, Ii,,-
22b.—
19‘,12
15
1612. 16m 24. w
15m 20. .?5“ YJ” 15’,2G
STEEL T-2
Indicates mecimm tested(
FIG. 10ASPECT RATIO PROGRAI,l T-2 ;
SWARTHMORE COLLEGE I
FIG. 9A5P!ICT RATIo PROGRAM T-1
5WARTHMORE COLLEGE
●
THICKNESS AND WIDTH
1/2’, >!L,, 1 “ ~:,, lN
2..
7 L“
611
w—
5“ 6r’—
9“
~~,, u“, J
4. 5“
L“—
& 15“ 18”1 ) 112
15
[6#.
—-1, ” 16.
1 1
25’, -!:,”15’, m2G ~ ,
STEEL T-2R
FIG. IIASPECT RAT!O PRoGRAM T-2R
SWARTHMORE COLLEGE
.29.
70000 ‘-’-..
4
— b 1,21’U-J in eo~ —
.I k..” *4U
3 i-
i I1,
Id4>
cc1- \u-l
500001-
Z3
w($J40000aew .—.
L,
2“”
. .0
4 a 16
ASPECT $+TIO
FIG. 12 VARIATION IN UNIT STRESS AT MAXIMUM LOAD
FOR VARIABLE THICKNESS AND ASPECT RATIO,
T-1 STEEL, 100~0 SHEAR FAILURES.
SWARTHMORE COLLEGE
.-
L0F
20
1
+
—
G.
L2
t=l”
a 10 12WIDTH-INCHES
3 VARIATION IN UNIT STRESS AT MAXIMUM LOAD
FOR VARYING WIDTH AND THICKNESS, T-l STEEL,
100y, SHEAR FAILURES
SWARTHMORE COLLEGE
kl II
0 4II
6 6 10 12 14 16 la 20ASPECT RATIO
FIG. 14 AvERAGE UNIT STRAIN ENERGY TO MAXIMUM LOAD FOR
VARYING ASPECT RATIO AND THICKNESS, T-1 STEEL ,
100~m SHEAR FAILURES
SWARTHMORE coLLEcE
4000
I
;-3000
3 4Iu IKILlL
U-j2000m 4)
— ~~
-1x,
z 7i=i7-_ “X “INDICATES ESTIMATED VALUE—
I*g 1000
Idzw ●
1-
530 ( (
. . p2
3/4 1~ I b2
THIcKNESS
FIG. 15 AVERAGE UNIT ENERGY TO MAXIMUM LCAD. VARIATION FOR
T- I STEEL WITH VARYING THICKNESS AND WIDTH. 100 %
SHEAR FAILURES.
SwARTHMORE COLLEGE
.3j -
.- ,
4000
3000
2000
IOoc
3\t=9Z”
o 2
I
+
. .t= I)..”
I
=+’-~=,11
-i
12WI DTH-l NCi E$
FIG. 16 AvERAGE UNIT STRAIN ENERGY TO MAXIMUM LOAD
FOR VARYING WIDTH AND THICKNESS, T-1 STEEL,
100%f. SHEAR FAILuRES
SWARTHMORE COLLEGE
1
[
t= I “ii
~=3,4°
c
. .
iASPECT RATIO
FIG.17 TRANSITION TEMPERATURE FOR T-1 STEEL
WITH VARYING ASPECT RATIO & THICKNESS
SWARTki MORE COLLEGE
“32’
I
,,1 1II,! 4 6
9-..‘.
‘.‘. -..
.—.
:
—...
8 12 16 iASPECT RATl O
FIG.18 TRANSITION TEMPERATURES FOR T-1 STEEL, SHOWING
EFFEcT OF ASPECT RATIO, THICKNESS AND WIDTH OF
SPECIMEN.
SWARTFIMORE COLLEGE
o 2 4 6 8 10WIDTH- INCHES
12
FIG.19 TRANSITION TEMPERATURE FOR T- I STEEL
WITH VARYING WIDTH AND THICKNESS
SWARTHMORE COLLEGE
T -1’
I
L-
-4\
\
0
:
m
ml
_Ll--
m
0lL
u)w
-34-
.-
APPENDIX I
TABIES OF EASIC DATA
1,
TABLEI-1
ispectRatio 4
Code: T-1 spe~imm si~e:l/2mx 2n
Block Spec. Temp. To VisibleCrack To Maximum Load To Fracture Xnergy % lnternalNo. 1<0. Deg Energy E Load EnergyEl Load EnergyE2 Lomd Difference Shear Notch
F in.lbs. lbs. in.lbs. lbs. in,lbs. lbs. E2 - Elin.lbs. +
Acuity
I A-3 o 2,740 46,500 6,4oo 52,000 U,300 14,0c0 7,9~ 100 1/32” notch11 A-2 -lo 3,000 47,2~ 6,503 53,8~ 7,350 53,600 850 0 1?11 A-32 ->0 3,200 47,500 6,750 52,900 14,700 l?,oco 7,950 100 nn A-1 -18 3,200 .48,300 6,500 53,300 8,500 50, DO0 2,000 811 A-4 -20 3,250 47,30 6,350 53,600 11,6oo 1+1,000 5,250!! A-31 -20 3,500 49@30 6,300 53,200 6,300
30 ~53,2~ o 0 17
11 A-17 -20 2,700 46,500 6,350 53 ,o~ 13,800 17,000 7,450 100 1711 A-M -64 3,850 48,200 7,850 54,000 7,850 54,mo o 0 11
11 A-5 o 1,69o .Q2,200 6,060 51,600 13,370 13,000 7,310 100 1131 A-22 -25 1,990 42,800 6,800 53,200 14,200 15 ,Goo 7,400 100 If11 A-6 -32 1,760 42,800 6,760 53,700 13,680 13,000 6,920 100 11II A-23 -35 2,100 42,000 7,250 53,500 7,250 53,300 0 0 1411 A-24 -@ 1,850 .L29600 7,350 5LS400 7,350 54,40Q o 0 11
la A-7 -52 l,w 42,500 6,870 54,700 6,870 54,’W3 o 0 It
Cole: T-1
Block Spec. Temp. To Visible CrackNo. No. Deg. EnergyE Load
F im.lbs. lbs.
111 A-9 otl A-25 -25N A-10 -3511 A-1.l -35!1 A-26 -MIt A-12 -40
Iv A-1 3 0Ur A-14 -233rl A-15 -20!1 A-16 -3211 A-30 -42It A-33 -5514 A-29 -6o71 A-34 -&+
l,m2,4001,9502,1002,5002,200
2,800
393533,3503,6004,0003,0003,2202,8CI)
43, ao44,90043,50941+,500.I+.J+,lW44,200
45,5~L7,50047,300L@,wm.!+8,300.L6,50047,3@48,200
TABLE I-1a
d~speckRatio 4 Centinuecl
SpecimenSize:l/2°x 2“
To hxinwn Load To Fracture Energy $ lnternalEnergy El Laad Energy E2 Load Difference Shearin.lbs.
Notchlbs. inilbs. lbs. E2 - El ]y
in.lbs. zAcuity
6,350 53* 900 12, %0 13,0c0 5,950 100 1/321T hole7?333 54,500 15,1C0 13,00Q 7,800 103 “7,5fJo 55,0m U+,400 16,000 6,900 lm “6,2oo 53,500 6,200 53,500 0 0 ‘16,800 54, 1~ 6,800 54,100 0 0 “6,2oO 5L,400 6,200 54,400 0 0 “
5,8507,2006,6m6,7006,7007,4006,0007,500
51,%0053,1@352,80053,80353,2005.J+,200549~o54,000
14,33016,95015,40315,300
6,7oO16,5006,0c4)8,000
12,CO013,00017,Oco17,00053,20016,00054Yo~53,700
8,4509,7508,WO8,6000
9,1000500
100Mm103I-m
o103
00
n
W
H
11
!1
n
u
11
-36-
TABLE 1-2
A9pectRatio8
Code:T-1 Specimen~ze: 1/2!’x 411
Block Spec. Temp. To VisibleCrack To K.wimm Load To Fracture l?mev~y %No.
InternalNo. Deg. EnergyE Lo&d Ener~vEl Load EnergyE2 Load Difference Shear Notch
F in.lbs. lbs. in.lbs. Ibs. in.lbs. lbs. F2 - El yin.lbs. 4
I c-3 o 4,250 76,500 13,750 95,200 1.3,750 0 0 1/3211 hole
n c-8 ZL 3,750 72,5c0 14,500 ?3,7~ 37,000 16,000 22,500 100 nII c-6 o 3,500 73,700 16,250 94,800 Lo,000 25,000 23,750 lCQ n!! c-m o 3,370 73,900 15,000 91+,800 ‘w,500 20,000 25,500 100 IIII c-23 -10 3,750 73,700 17,000 95,000 40,703 16,OOO 23,700 100 IIII c-5 -lo 3,500 71,600 15,000 95,500 15,000 95,5Q0 o 0 !111 c-7 -20 3,750 7L,400 1s,100 97>7~ 2E,250 83,000 10,150 25 11
TABLE 1-3
AspectRatioM
Cede:T-1 Specimm Size:l@x 8“
Block spa . Temp. TO VisibleCrack TO Mxhtwi Load To Fracture We rg-y $ InternalNo. No. Dec. NnerqyE Load EnerRyEl Load EnergyK? Load Difference Shear
FNotch
in.lbs. lbs. in.lbs. lbs. in.lbs. lbs. E2-E1 ~in,lbs. h
Acuity
I!1
II
11
11
11
tl
11
11It
11
II
19
,8
It
1!
E-13E-14E-27E-3E-1E-16E-2F-15
E-17E-29E-28E-5FA9M+EME-16’
+10o00
-10-lo-20-21
Lo302010100
-$
n ,00011,5009,50012,00010,0009,00010,00010,000
6,8CQ7,00010,0007,500E,5006,6006,3006,5c0
136,5oo140,30013s,500143,600140,000136,800139,200140,600
132,300133,m139,200133,000132,800133,3m132,800139,500
45>o~50,00032,5C046,5oo4b,00020,00033,50033,250
39,m43,30043,00027,10031,00050,90054,00028,00’2
168,3m173,100172,000177,000177,400160,500173,000175,200
172,500172,5C0173,900166,500169,000179,800177,700170,500
117,000125,000>2,500119,000118,00020,00033,50033,250
112,300101,2CO10F!,000
27,10031,00064,700103,00028,COO
20,00026,000172,00015,00022,000160,500173,000175,200
20,00015,00020,000166,500169,000170,00094,000170,500
72,00075;000o
72,50074,000
000
72,900
57,90065,00000
13,wfJ1+9,0000
1001000
100100000
1001001000
i350
1/32”hole11ItIIII11!!11
11
!1
II
H
II
II
11
,1
TLBLE I-3a
kpeet ~~kio 16 Continued
Code:T-1 Specinm S~ze:l/21!x 811
Block ,Spec. Temp. To VisibleCrack TQ ::kXiGIUllLost To Fracture Energy $No. NO. Deg. Znerg:yE Load
InternalEnerflyEl Lo~d EnergyE2 Load Difference Shew Notch
F in,lbs. lbs, in.lbs. lbs. in.lbs. lbs. E2-E1 ~in.lbs. 4
Ac~~ity
E-7E-qZ-8E-21E-20E-30
w1000
-lo-lo
9,2307,5007,50c7,0W8,5CKI6,030
135,300133,800134,200133,700lx, 800134,00C
43,0C043,00048,5C037,50036,50020,51?o
172,930176,300175,400173,50C174,500160,mo
175,6oo167,500176,cKx3172,&)0176,700M ,700167,000
101,000m9,000113,50037,500%,50020,500
116,5oo33,0C041,m80,0c0126,50029,50027,500
20,CKII63,9001?,700173,500174,500160,0m
58,Oco66,00065, OOO
000
100 1/32”hole
100 “lCO Ho “o “o 11
,1
11
t!
11
Iv LloE-12FP23E-nE-25E-26E-32
o-lo
11,50010,500
8,000ll,m
7,5005,5007,50C
14c ,500135,700135, mlx, 500135,0C0135 ,mo135,000
46,50033Jo~41,GQ352,50048,00029,50027,500
25,co0167,500176,000ly , 5m
a ,000166,700167,003
70,omo
100 IIo “
If
4; “100 ~jo rlo “
11
It
M
11
17
-lo 027,50078,500
0
-20-20-25-35 0
I
TABLE I-l
AspectRatio 19
Code: T-1 SpectitmSize: 1/2” x ?.5”
-., - m--- m- 1,: ..:hl - f-,,.-,.!. m, 11. + Fnl>rn Trlna To Fracture Ener~y % Internalergy E2 Load Difference Shear...—~ —— Motch
+n lha 7hq. in.lbs. lbs. E2-E1 ~in.lbs. 4
BLOCK apec, ltill~, LU VL2LULG U, =~r. ,“ “.U.., ,IU IL. -----
NO. No . Ileg EnergyE Load Fnm.uv 131 Load EnF in,lbs. lbs. L.-.w. ---
F-1 9,500 153,000 67,0W Zol,ooo 159,000 ‘y,oix 92,000 100 1/32”holeI
IIIIM
11
111M11
1!
11
it
203,.500206,3#205,000194,700
155,0001.60,0G0152,000
32,250
30,00025,00321,000
194,700
91,000~9,55091,000
0
lm100100
0
F-6F-4F-22F-5
8,5W7,5005,00Q9,500
15.4,800151},00015L,500160,200
6L+,00070,45061,00032,250
200
-10-20
11
,,
100lCO
o1000
!1
31
II
11
If
11
206,500207,000195,000208,Oml207,500197,000
156,ocol#,ooo
29,00075,@o46,CO028,000
Ui,ooo30,030195,000205,000207,500197,000
93,5~93,000
014,030
00
8,0009,5009,5~9,0006,OOO4,000
160,000159,700163,600162,800162,000174,500
62,50055,00029,00061,00046,co028,000
F-7F-9F-17F-18F-23F-8
o0
-10-10-20-60
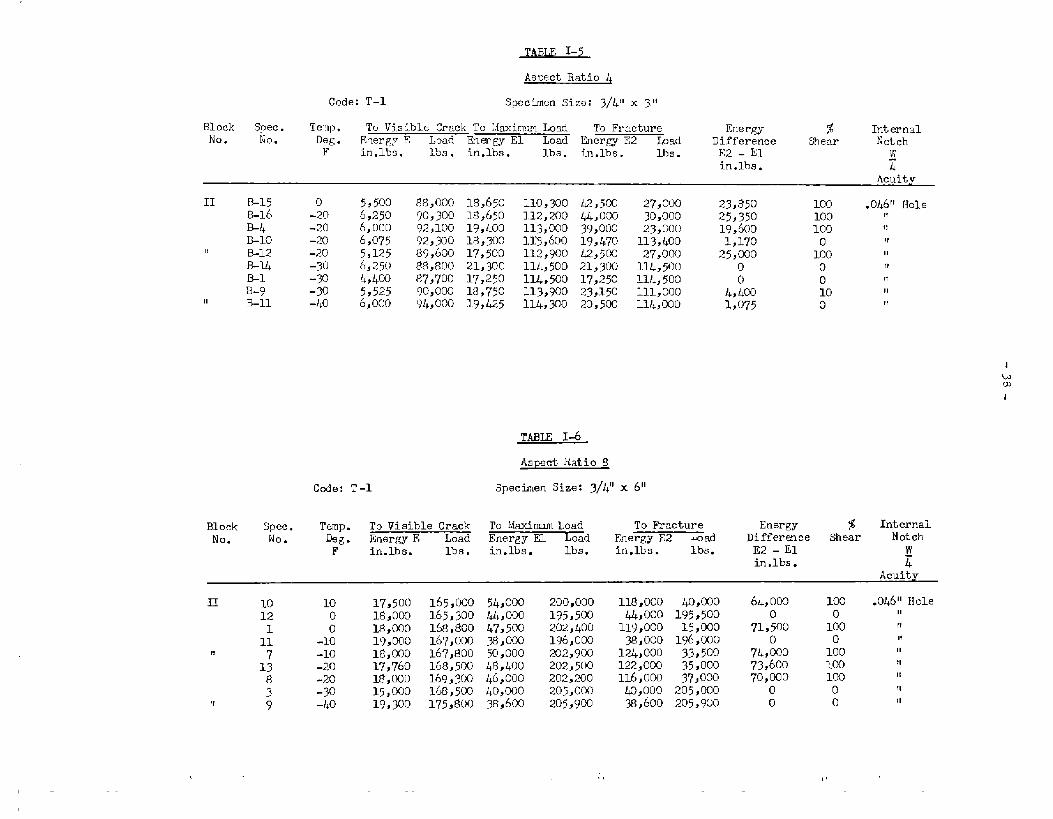
TABLE 1-5
Asnect Ratio 4
Code: T-1 Specimen Size: 3/4” x 3“
B1 ock SFec. Te~p. To Visible Crack To Xaxinwl Load To Fr~cture Enerw % Interns.1ho. No. Deg. Energy T Load Fnw~ El Load Ener~ E2 bad Difference Shear NOt,ch
F in.lbs. Mm. in.lbs. lbs. i~.lbs. lbs. E2 - El yin.lbs. .4
Acuity
11 r?-15 o 5Y500 88,000 18,650 110,300 42,5CCB-16 6,250
27,000 23,850 10Q .046rI Hole-20 90,300 18,650 112,200 i+.)+,ooo 30,000 25,350 100 Ii
%4 -20 6,000 92,100 19,400 113,000 39,000 23,000 19,600 100 if
B-lo -20 6,075 92,%0 18,300 11>,600 19,470 113,400 1,170 0 !1II B-12 -20 5,125 89,600 17,500 112,900 42,503 27,0C0 25,000 100 11
B-l& -30 6,250 83,800 21,300 114,500 21,300 114,500 0 0 IIB-1 -jo 4,L~ 87,700 17,250 11.4,50017,250 114,500 0 0 n
B-9 -30 5,525 90,000 18,750 113,900 23,150 111,000 4,40C 10 11II B-n -40 6,000 94,000 19,425 114,300 20,500 114,000 1,075 0 11
I
TABIE 1-6
Aspect,RaLio 8
Code: T-1 Specimen Size: 3/4’1x 6“
Block Spec. Temp. To Visible Crack To MaxinnunLoad To Fracture Energy $ Internal
No. No. Deg. Energy E Load Energy El Load Energy E2 bad Di.ffermce Shear ilotch
F in.lbs. lbs. in.lbs. lbs. in.lbs. lbs, E2 -El ~in.lbs. 4
Acuity
H 10121
311 9
1000
-lo-lo-20-20-30-40
17,500H?,00018,00019,00018,00017,7601%,00015,00019,300
165,m0165,300W, 800167,000167,Go0168,500169,300168,~co175,800
54,00044,0!)047,500%,00050,00048,4004(5,00040,00038,600
200,000195,500202,400196,000202,900202,500202,200205,000205,90Q
118,0004.4,000119,00038,000124,000122,000116,00040,00038,600
40,000195,50015,000196,00033,5~35,0m37,000
205,cmo205,900
64, O@J
71,:00
74,:0073,6oo70,000
00
10001000100lmmlo0
.046” Hole11It
Ii
11
H
n
71
II
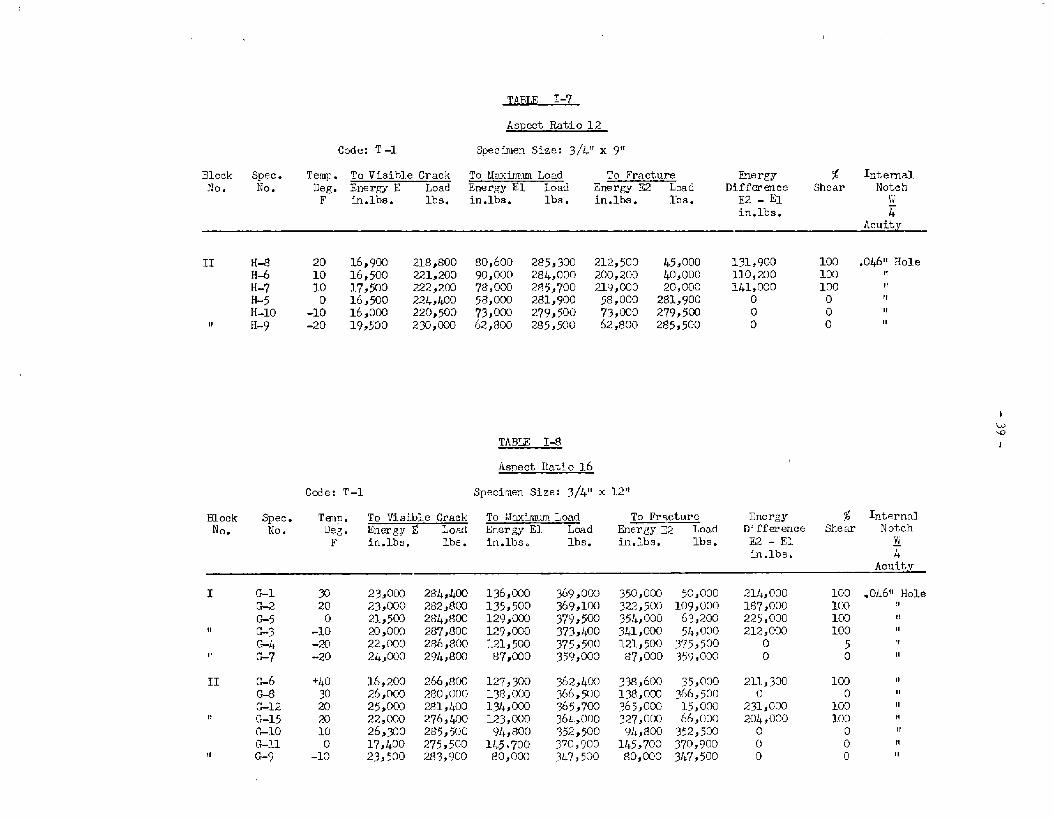
Ti!RT3 1-7
Aspect Ratio 12
code: T-1 Specimen Sb2e: 3/4” x 9 ‘t
Block Spec. Temp. To Visible Crack To Wxiumn Load To Fracture Energy % Internal
NO* No. Deg. Energy E Load Energy El Load Energy E2 Load Difference Shear NotehF in.lbs. lbs. in.lbs. lbs . in. Ibs. lbs. E2 - El ~;
in.lbs. I
11 H-8 20 16,900 218,800 80,600 285,300 212,500 .45,o~ 131,900 100 .04611HoleH-6 10 16,500 221,200 90,000 284,000 2oo,2m 40,000 110,200 100 MH-7 10 17,500 222,2m 78,Oco 2f15,700H-5 o
219,(I3O16,500
20,000 lIJ,000 100 “224,400 58,000 281,900 58,000 281,900 0 0 11
H-10 -lo 16,000 220,500 73,o~ 279,500 73,000 279,5~ o 0 If11 H-9 -20 19,500 230,0W 62,800 285,500 62,800 285,500 0 0 11
TABLE 1-8
Aspect Iiatio16
Code: T-1 Specimen Size: 3/4” x 12”
Block Spec. TmIp. To Visible Crack To Msximum Load To Fracture Energy $ Internal
No. No. Deg. Energy 1! Load Ener~ El Load Energy E2 Load
F
Differefice Shear Not.ch
in.lbs. lbs. in.lbs. lbs. in.lbs. lbs. E2 - El ~
in.lbs. 4Acluity
I G1 x 23,0MI 2~4,J@ 136,000 369,Om 350,000 50,000 214,000 100 .0L6~’HoleG2 20 23,000 282,800 135,500 369,100 322,500 109,000 187,000 103 ‘iG5 o 21,503 284,803 129,M0 379,5W 354,000 63,200 225,000 la) “
!1 G-3 -lo m ,OCC 287,800 129,000 3731400 341,a30 54,000 212,000 100 11
G4 -20 22,000 286,800 121,500 375>500 121,500 375,500 0 5 “!1 G7 -20 24,000 294,8C0 F37,W0 359,C00 87,000 359,CO0 o 0 “
11 G6 +l+o 16,200 266,800 127,300 362,400 33$,600 35,000 211,300 103 “G8 30 26,003 280,000 138,0Lm 366,500 13~,0Dl 366,500 0 0 “G12 20 25,00) 281,Q30 134,002 365,7u3 365,000 15,00C 231,0c0 100 “
M G-l? 20 22,0C0 276,400 123,000 364,000 327,000 66,000G1O 10 26,Y30
204,000285,500 94,800
100 “352,500 949800 352,5~ o 0 If
0-11 0 17,400 275,500 145,700 370,900 145,700 370,900 0 0 ft!1 G-9 -lo 23,500 283,900 80,000 347,500 80,000 3L7,500 o 0 “
1+0 -
00000000000*0*00000
-!-.
..m
.!j
IIl-l====.=
HHs====
r. 1
TABLE 1-11
Aspect Ratio 12
Block Spec. Temp. To VisibleCrack To MaximrnLoad To l+acture Energy $No. No. oe~ EnergyE Load Ener~ El Load Ener&vE2 Load DifferenceShear Notch
F in.lbs. lbs. in,lbs. lbs. in.lbs. lbs. E2-E1 ~in.lbs 4
acuity
IV G? 40 32,c00 357,Soo 21L,o~ l@l,loo 599,o~o 22,000 385,000 180 1/16”holen G1 39,000 358,1+00194,0C0 483,0CQ 512,0m 79,MOII
318,OCO 1’20 “G2 $ 39,0m 36!3,000 200,000 487,.U30 395,000 363, ooo 195,000 55 “
,4 G6 30 35, m 359,000 203,500 i+88,5C0 218,500 l&, ooo 15,000 10 “
v G3 75 30,000 326,m30 198,000 449,500 5.L9,~o m ,000 351,000 lm “r, C-7 50 42,5m 363,900 198,003 478,7~ 502,000 55,Om 30.L,000,t ~G8 20 30,CW
100 “354,800 122,020 468,403 122,000 4W,4CM3 o 0 “
,1 o-l+ 10 31,0CC 358,000 147,W0 480,0CK ll+7,coo 4~o,coo o 0 11
TLDLE 1-12
Jls ps ct Ratio4
Code: T–1 Suecimen Size: 1~11x 611
Block Spec. Tap , To Visible Crack To !Jaximm Lo&d To Fracture EnerFJ !$ InternalNo. No . Dep. Energy E Load Enerp.yH Low! Ener~y G Load Difference Shear Notch—. .-
F in.lbs. lb:.. in.lbs, 15s. ‘in.11>s. lbs. E2 - El ~in.lbs. L
IM
It
,1
IfIt
rnn11
11,1
II
,1
,1
,1
11
11
H
11
D-15D-3D-)+W6o-5D-2o-lbD-160-13
D-9D-17D-19B20o-1oD-18D-8D-n0-12D-7
38,5m33>40335,000%,50045,0001+6,00040,00033,0~28,2C0
32,50035,CMJI+4,00040,330.!+4,000.!+4,000.K2,0HI41,60035,00040,m
332,300329,000333,5~331,500340,5003M, 5003%,00031.8,300343,o~
328,500322,0003L3,5003112,000339,0m339,000337,700336,000320,003327,000
104,000109,500110,00090,000115,000108,500110,000119,0W83,400
116,000l16,0)o110,000100,2CC106,ooc115,200119,000112,000118,000114,000
40$,90C405,000401+,000399,~o39%,320402,000401,330398,E300427,600
415,500./+0+,500403,500403,CO0396,ooo1101,8004d5,000399,CO0392,50038s,000
1011,000
109,500157,00090,000250,000108,500255,(xIO235,50084,250
116,0Lm116,000263,ooo102,200105,000262,000125,0002.JJ+,000285,000246,000
406,9CC435,0003M 500399,@Jo13,000402,0m1L5,000125,000426,o0o
415,500.!+06,500145,000403,000396,000135,000L02JOOC135,GO0120,000125,000
0
0
L7,01Xo
140,0000
L45,000116,500
850
00
153,00000
1/+6,8026,000
132,000167,o0o132,0m
o
0
50
100
0
1001030
0
0
1000
0
1005
100
10C100
3/32”HoleIIil
M
n
,1
,,
,,
u
14
,1
n1,
II
M
II
nr,rr
TABLE I-12&
Aspect Ratio ‘$
Code: T-1 Specimen Size: 1*1Ix 611
Block Spec. Temp. To Visible Crack To Maximum Load ‘foFracture Energy % InternalNo. No. Deg. Eneru E Load EnerW El Load Energy E2 Load Difference Shear Notch
F in.lbs. lbs. in.lbs. lbs. in.lbs. lbs. E2 - El Nin,lbs.
111 D-23 30 349OOQ 324,500 107,800II D-28 30 36,OW) 334,90 lll,oco?1 D-2L+ 24,000 301,000 106,omII D-.27 z 27,500 309,C-oo 110,000II D-26 32,000 325,3~II
100,600E-25 z 34,Om 322,500 Izo,000
!1! D-29 60 36jom 32$;300 l12;ooo71 0-21 20 14,000 26T,0~ 25,000
n D-22 83 8,0(m 236,300 ml ,0001!*4 G17 6,5oo 247,600E
45,000II;-SG17 6,2w 237,5~ 85,00071*6 G-17 75 8,500 234,500 !M,occlI*+3 G17 90 8,oO0 233,400 89,Mx)
* Cut from G17
404,400W&, 50Q40$,000400,200403,90039997004m ,000303,000369,30033$,500375,0-003k3,m361,500
107,800 LO4,4OOllljooo 404,500252,000 145,000133,000 398,800176,000 350,000208*000 100,000245;000 _=--,lg;o(x)25,000 303,000256j000 i20900045,000 33~,50085,000 375,00058,COO 348,000
243,000 110,000
00
lL6,00c23,00075,@o168,000-J~3,000.,--
0
4Acuity
0 3/32” holeo “102 n
5 IT
20 “100 “100..~o J.H.Saw cut
mo “o “5“o “MO II
TABLE1-13
Aspect.Ratio 6
Code: T-1 Specimen Size: l+” x 9“
Block Spec. Temp. To Visible Crack To !~zximm Load TO Fracture ,j%ergy RX “Tllterflal
l\]o. No . Deg Energy E Load Energy El LCad Energy E2 Load Differerice Y=m !Iotctl
F in,lbs. lbs. in.lbs. lbs. in.lbs. lbs. !32-El 1417,
in.lbs. L,
11 18 100,000 507,500 210,Oco 56L,0cc 568,000 185,000 358,000 100 3/32”~0~~11 5 :; 67,000 459,500 200,000 56k,000 4/+0,0:0190,000 240,000 100 ‘!1! 13 50 84,003 495,000 165,000 568,000 165,000 568,000 0 0 “lt 4 50 70,000 @o,2C0 205,0Cc 568,500 477,009 155,000 2’72,000 100 “If 16 4c 6.L,500 463,000 206,000 578,500 534,000 150,0m 3m,ooo 100 “M 14 30 ,70,0W 480,0Q0 193,000 579,000 193,000 579,0m o 0 “!1 15 @ 71,000 l+79,0m 203,000 574,0N 203,000 574,000 0 3 “
1,
TABE3 1-14
Aspect Ratio 4
Cede: T-2 Specimen Size: 3/4~rx ?rix 12rf
Spec. Temp. To VisibleCrack To MSJ&UUM Load TO Fracture Energy %No. Deg. Energy E Load
InternalEhergy El Load Energy E? Load Difference Shear NotCh
F in.lbs. lbs. in.lbs. lbs.. in.lbs. lbs. E2 - El ~in.lbe. L
XB-9
XE1
XB-3
x13-f3
XE-7
XE-6
o 5,0C0 94,000
-lo 5,000 93>5@3
-20 5>500 94,000
-20 5,750 96,703
-w 59590 94,m
-40 !4,5m 89,000
17,000 112,500 36,750 20,mc 19,750 100 .046°Hole
16,500 1.12,mo **375 35,000 21,875 100 11
18,250 114,200 25,0m 108,600 6,750 20 n
14,000 113,030 37,m 52,(M3O 21,000 60 n
13,625 114,000 13,625 lu,000 o 0 11
15,003 115,000 15,000 115,C-W o 0 H
1-15
Aspect Ratio 8
Code: T-2 Specimen Size: 3/L” x
TO Visible Crack TO Maximum Load To Fracture Energy $ InternalSpec. Temp.
No. Deg. Ener~ E Load j?ner~ El Load Energy E2 oad Difference Shear Notch
F. in.lbs. lbs. in.lbs. lbs. in.lbs. lbs. E2 - El ~in.lbs. 4
Acuit ~
XJP5 +10 10,000 161,700 l+l$,ooo .046’1204,500 103,OOO I+o,oco 59,000 100Hole
Xo-1 o 12,000 165,000 43,~o 207,3W 112,CO0 25,000 69,000 100 “
XE-6 -5 10,OW 161,80Q U,ooo 204,800 102,000 40,000 58,000 100 “
XD-3 -lo 13,00Q 168,500 45YNo 206,500 54,0~ 198,000 8,500 15 “
XD-2 -20 12,500 169,500 .L6,50Q 20S,900 49,500 26,500 3,0W 15 “
XD-4 -30 10,000 164,0C0 28,500 199,000 28,5N 199,0m o 0 ‘1
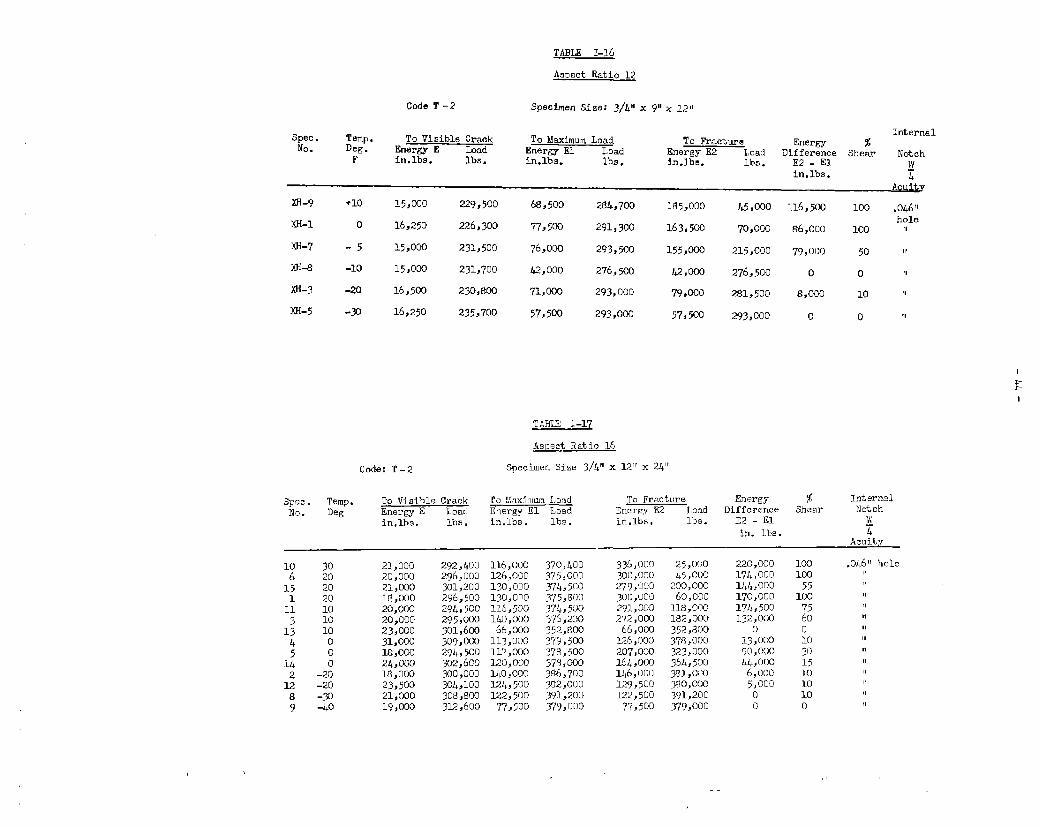
TABLE 1-16
Aspect 8atio 12
Code T-2 Specimen Size: 3/4kH
Spec. Temp. To Visible crackNo.
To Maximum LoadDeg. Energy E Load Energy ElF
Loadin.lbs. lbs. in.lbs. lbs.
InternalTo Fracture Energy %
Energy E2 Lmad Difference Shearin.lbs.
Notchlbs. E2 - El w
in.lbs. T
ill-9 +10 15,m0 229,500 68,500 28k,700 185,000 )+5,000116,500 100 .046’1
XH-1 o 16,250 226,w 77,5mhole
291,300 163,50c 70,000 86,000 100 ~fl
XH-7 -5 15,000 231,500 76,0cQ 293,500 155,000 215,000 79,000 50 l!
XII-8 -lo 15,0C0 231,700 42,000 276,500 42,CH30 276,50Q o 0 11
m-3 -20 16,5c0 230,wm 71,000 293,000 79,0m 281,500 8,000 10 11
m-5 -m 16,250 235,700 57,5CQ 293,002 57,50) 293,000 0 Ofl
TABII 1-1?
Aspect Ratio 16
Code:T-2 SpecimenSize 3/4fux 12’1x 24”
Spec. Temp. To Visible Crack To 5fzxLmm Load To Fracture Energy $
No. Deg Energy E
Internal
Load Energy El Load Snerg,yE2 Load Difference Shear Notch
in,lbs, lbs . in.lbs. 1’0s. in,lbs, lbs. X2 - El ~
in. its. L
10 306 2015 201 2011 103 1013 104 05 014 0
-202 -208 -309 -40
21,00020,00021,0001%,00020,00020,00023,00031,00018,00024,00018,00023,50021,00019,000
292, koo296,000301,200296,500294,500295,000301,600309,000294,500302,600300,000304,100308,801312,600
116,00012.6,030130,020130,0:’0116,5C0ll+o,o,2066,000113,02Cll?,000120,000140,00012k,500122,5007?,500
370,Loo375,000374,5C0375,800374,500376,200352,800379,5m373,50037?,coo386,700392,000391,200379,000
335,000300,000279,030300,000291,000272,00066,0201.26,000207,0:0W+ ,000146,000129,500122,50077,5~
25,0co45,000
200,00060, ow
11s ,000182,000352,80037fi,ooo323,000364,500391,9:0330,030391,200379>000
220,000174,0C0lLL,000170,0C0174,500132,000
013,Oco90,03044,0006,0005,00000
1~~ .04k” hole100
1,
55 ,E100 ,1
,1
:: 11
0 11
10 11
30 ,1
15 1110 11
10 11
10 11
0 ,1
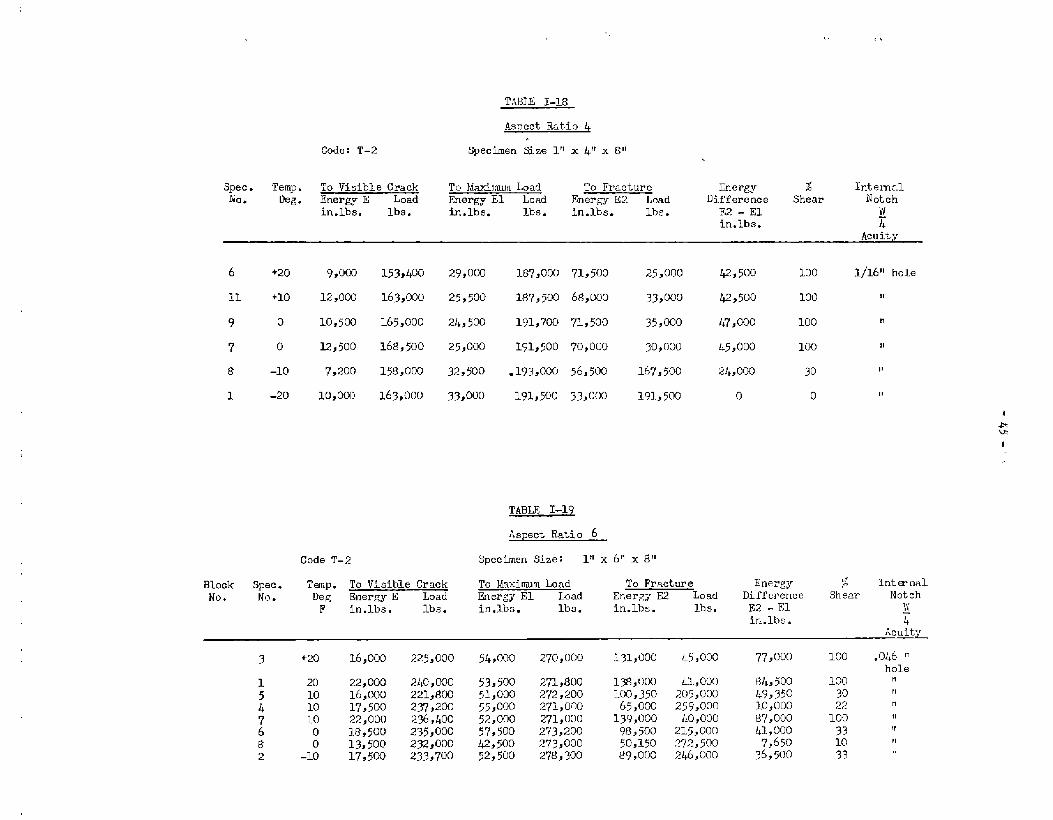
TABLE 1-18
Aspect Ratio 4
Code: T-2 Specimen Size 1“ x 41t x 8’1
Spec. Temp. To Visible Crack To MaximnmILoad To Fracture Energy d InternalNo. Deg. Energy E Load Energy El Load Energy E2 Load Difference Sh~ar Notch
in.lbs. lbs. in.lbs. lbs. in.lbs. lb. E2 - El yin.lbs. 4
Acuity
6 +20 9,002 153,400 29,0m 187,0C0 71,500 25,000 4-2,500 100 1/16”hole
u +10 12,003 163,000 25,500 187,500 68,000 33,000 42,500 100 11
9 0 10,500 165,000 24,500 191,700 71,500 35,000 47,~o 100 !7
7 0 12,500 168,500 25,000 191,500 70,000 30,000 45,000 100 !1
8 -lo 7,200 158,0C0 32,%o .193,CO0 56,500 167,500 24,000 30 II
1 -20 10,003 163,000 33,000 191,500 33,000 191,500 0 0 11
t
TABLF 1-19
Aspect Ratio 6
Code T-2 Specimen Size: 1!1~ 6!!x 8!1
Block Spec. Tamp. To Visible Crack To MaximJM Load To Fracture Energy 6 Intw na.1
No. No. Deg Energy E Load Energy El Load Energy IQ Load Difference Sh~ar Notch
F in.lbs. lbs. in.lbs. lbs. in.lbs. lbs. E2 -El ,?,,,in.lbs. I
3 +20
1 .2010
i 107 106 08 02 -lo
16,000
22,00016,00017,50022,00018,50013,50017,500
225,000
2.40,OQO221,800237,200236,400235,000232,000233,700
54,000
53,50051,00055,00052,00057,500@, 50052,500
270,000 131,000
271,800 138,0M272,200 100,350271,020 65,000271,000 139,000273,200 98,500273,000 50,150278,300 89,000
45,000
41,000205,000259,00040,00021.5,000272,500246,000
77,000
84,50049,35010,00087,00041,0007,65036,500
100 .046“hole
100 “30 “22 IT100 1’33 “10 “33 “
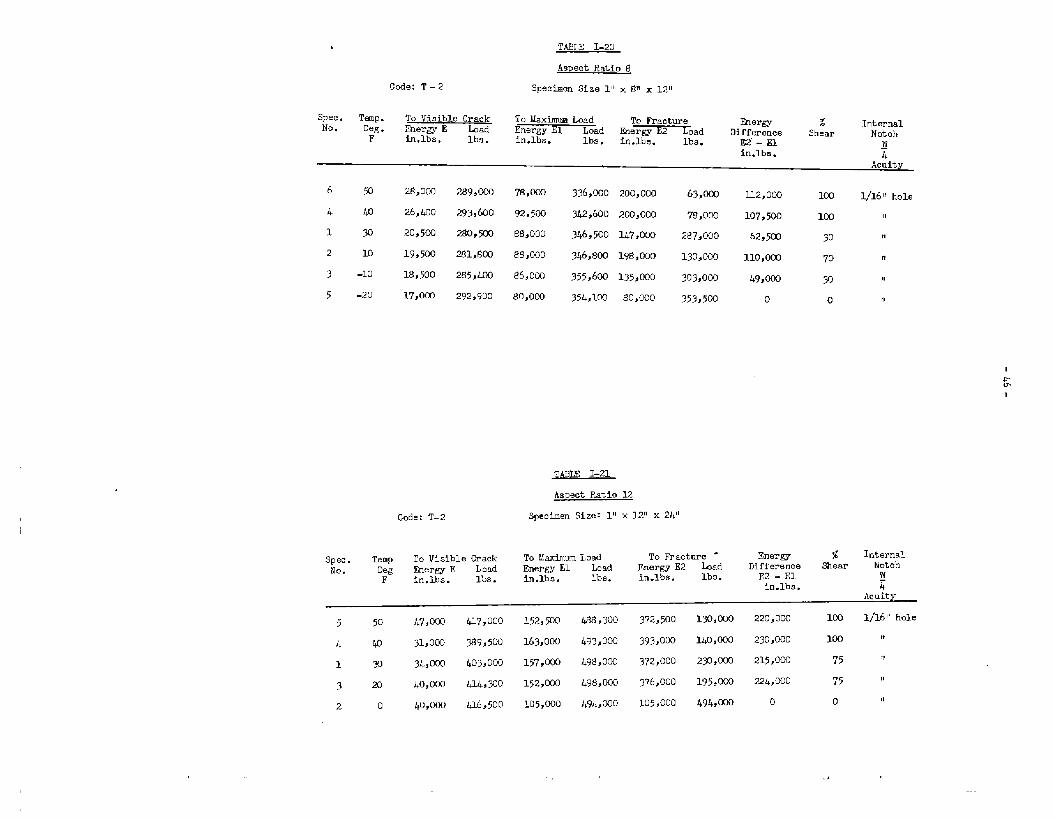
TABLE 1-20
hspect Ratio 8
Code: T-2 Specimen Size 111x 8H x 121!
Spec, Temp. To Visible Crack To Maxinmm LoadNo. Deg.
To FractureEnergy E Load Energy El
EnergyLoad
% InternalFmergy E2
FLoad Difference Shear
in,lbs, lbs.Notch
in.lbs. lbs. in.lbs. lbs. E2”- El ~in.lbs. L
6 50 28,0m 289,000 76,0XI 336,030 200,000 63,003 l12,0fM 1!20 1/16 IF hole
km 26,I+oo 293,600 92,5C0 3&2,6oo 200,000 78,0CKI 107,500 lCO n
1 30 20,5aI 280,5cQ 68,000 346,500 U7 ,OCO 287,000 62,5C0 30 H
2 10 19,500 281,8(M 88,000 346,80C198,000 130,mo 110,000 70 n
3 -lo 18,500 285,400 86,0m 355,6oo135moo 303,0C0 49,000 w 11
5 -20 17,003 292,900 80,0c0 354,1m 80,000 353J50C o 0 rl
TABLE 1-21
Aspect Ratio 12
Cede: T-2 Specimen Size: 1’[x 12” x 24”
Spec. Temp To Visible Crack To MaxtiwrJLoad To Fracture - Energy g Internal
No. Deg Ener~ E Load Energy El Load Energy E2 Load Difference Shear Notch
F in.lbs. lbs. in,lbs. lbs. in.lbs. lbs. E2 - El yin.lbs. 4
Acuity
5 50 47,0~ 417,000 152,500 @,m 372, Wo 130,000 220,000 102 1/16 H hole
4 40 31,0m 3%9,500 163,000 L93,00Q 393,000 140,000 230,000 100 “
1 3 34,0m L03,000 157,0m I@,ocm 372,000 2y3,0cn 215,CG0 75 n
3~ 40,0CKI 43.4, m 152,0co l+98,0co 376,ooo 195,mxl 224,000 75 “
2 0 40,0c0 &16,500 105,OOO 49LOO0 105,000 494,~o o 0 11
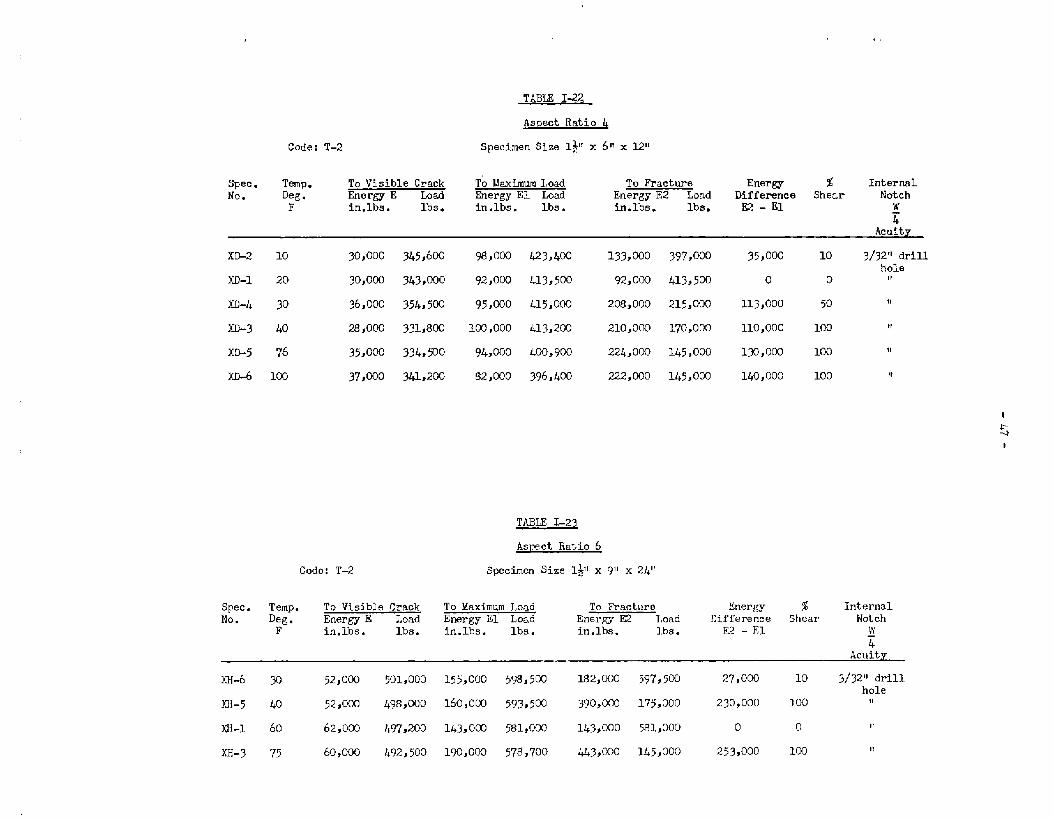
TABLE 1=22,
Aspect Ratio 4
Code: T-2 Specimen Size I+” x 61f
Spec. Temp. To Visible Crack To Maximum Load To Fracture Energy %NO. Deg.
InternalEner~E had Energy El Load Energy E2 Load Difference Shear Notch
F in.lbs. lbs. in.lbs. lbs. in.lbs. lbe. D - El ~4
Acuity
XW2 10 30,000 345,600 9$,000 Q3,400 133,000 397,~ 35,000 10 3/32” drillhole
X&l 20 30,0CHI 343,000 92,000 413,500 92,000 413,5~ o 0 It
XO-4 30 36,000 354,500 95,W0 .u5,000 208,000 215,000 113,000 50 71
x&3 .l+O 28,000 331,800 lm,ooo 1+13,200 210,000 170,000 110,000 100 H
x%5 76 35,0~ 334,90 94,000 400,900 224,000 145,000 lW,OW 100 !1
X0-6 100 37,~o 3U,200 82,000 396,400 222,030 145,m lLO,000 100 lt
I
-&--J
TABIF I-21
AsEct Ratio 6
Code: T-2 Specimen Size l& x
Spec. Temp. To Visible Crack To Maximum Load To Fracture Energy % InternalNo. Deg. Energy E Load Energy El Load Energy E2 Load Difference Shear Notch
F in.lbs. lbs. in.lbs. lbs. in.lbs. lbs. E2-E1 ~Ji
IAcuity
XH-6 w 52,002 5ol,ooc 155,000 59,5W 182,000 597,5~ 27,000 10 3/32”drillhole
XH-5 Lo 52,0W 1+98,000 160,003 593,5~ 390,0m 175,000 230,000 100 !1
XH-1 60 62,003 .497,200143,Om 581,000 1.J+3,000581,000 0 0 If
XII-3 75 60,000 L92,500 lW,00Q 578,700 443,000 1L5,000 253,000 Ill 11
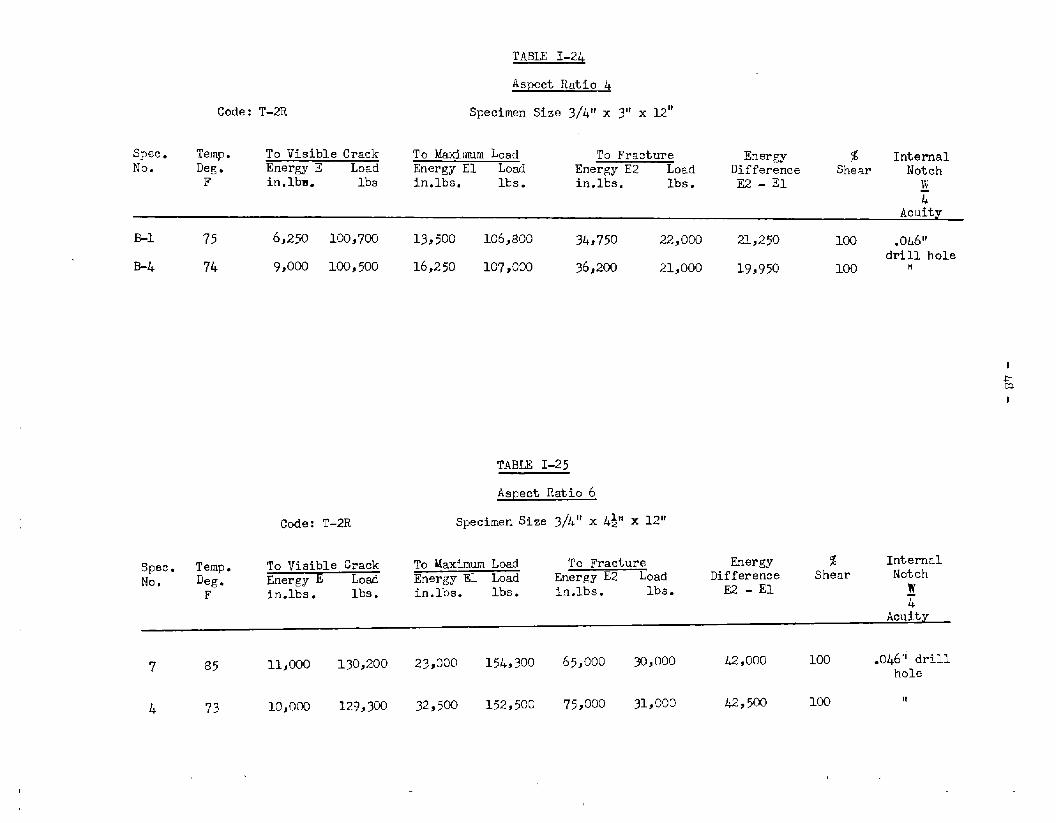
TABLE I-24
Aspect Ratio 4
Code: T-2R Specimen Size 3/.4l~ x 3“ x ).2”
Spec. Temp. To VisibleCrack To MaximumLoad To Fracture Energy % InternalNo. Deg. EnergyE Load EnergyEl Load EnergyE2 Load Difference Shear Notch
F in.lba. lbs in.lbs. lbs. in.lbs, Ibs. E2 - El ~.4
Acuity
B-l 75 6,250 100,700 13,500 106,800 3.4,750 22,000 21,250 100 .046’1
B-4 74 9,0cm lm ,500 16,25o 107 ,Om 36,200 21,000 19,950drtll hole
100 H
I
TABLE I-25
Aspect Ratio 6
Code: T-2R Specimensize 3/4” x 4*H x 1211
Spec. Temp. To VisibleCrack To MaximumLoad To Fracture Energy % InternalNo, Deg. EnergyE Load EnergyEl Load EnergyE2 Load Difference Shear Notch
F in.lbs. lbs. Ln.lbs. lbs. in.lbs. lbs. E2-E1 yL
Acuity
7 85 11,000 130,200 23,000 154,300 65,000 30,000 42,000 10Q .0461idrillhole
4 73 lo,om 129,300 32,500 152,500 75,000 31,000 .42,5M 100 II
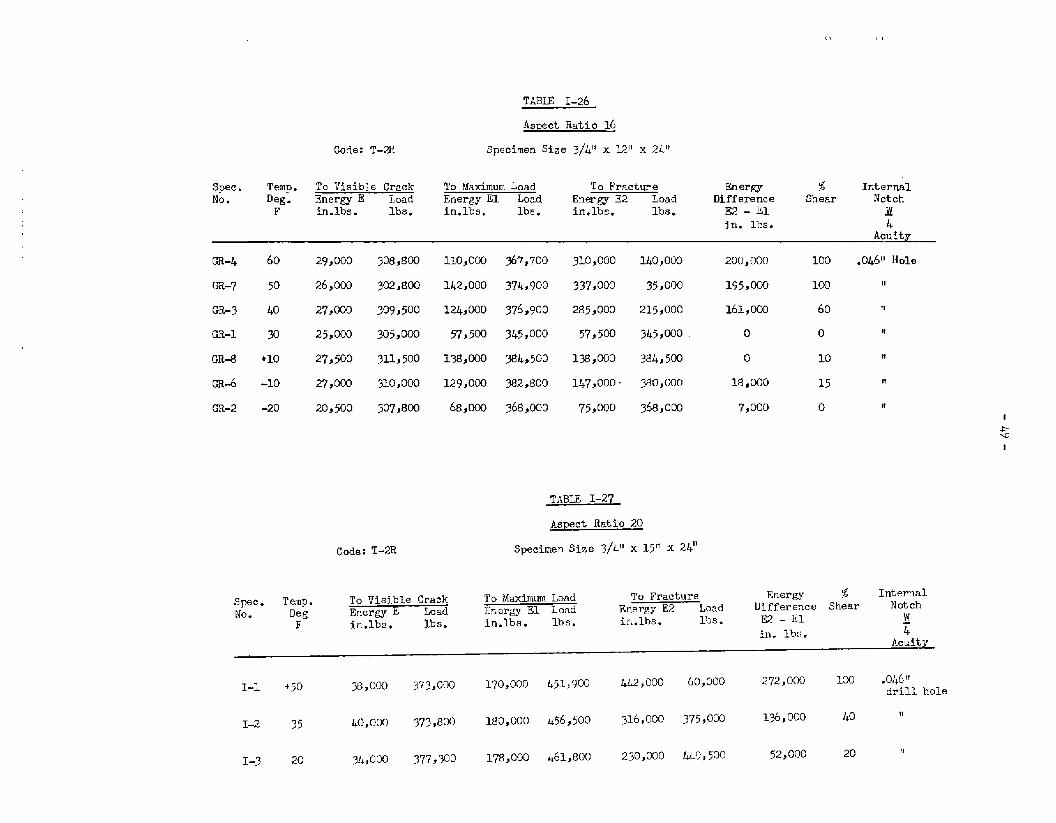
TABLE I-26
Aspect,Ratio 16
Code: T-2R Spscimen Size 3/4” x K?r’x 24’i
Spec. Temp. To Visible Crack To Maximum Load To Fracture En erg % InternalNo. Deg. Ener~ E Load Energy El Load Ener~ E2 Load Difference Shear Notch
F in.lbs. lbs. in.lbs. lba. in.lbs. lbs. E2 - El 1in. lbs. 4
Acuity
OR-4 60 29,0m 308,800 11O,OCO ?67,700 310,000 IAo,om 200,000 100 .0k61’ Hole
OR-7 50 26,002 302,800 142,000 374,w 337,0~ 35,000 195,m lco n
GR-3 40 27,000 309,500 124,000 376,9oo 285,000 215,000 161,m 60 “
GR-1 w 25,000 ?05,000 57,5~ 3k5,000 57,5cf3 345,cm3 o 0 n
GR-8 +10 27,500 311,500 138,000 384,500 1%,000 384,500 0 10 n
OR-6 -lo 27,0C0 310,000 1.29,000 ?s2,800 147,000- 30,000 18,COo 15 11
GR-2 -20 20,500 W7,8~ 68,000 368,000 75,@30 368,0C0 7,000 0 If
TABLE I-27
AspectRatio20
code:T-2R specimenSize 3/4nx 15” x 24”
Spec . To Visible Crack To Maximum Load %Te,mp. To Fracture llner~ Internal
No. Deg Ener~ E Laad Energy El Load Energy E2 Load Difference Shear uOtCh
F i.n.lbs. lbs. in.lbs. lbs. in.lbs. lbs. E2-E1 Y{7
in. lb. 4
1-1 +50 38,00Q 373,0m 170,000 L51,9m U-2,o~ 60,000 272,000 lCO .046’7drill hole
1-2 35 40,0C0 373,8c0 180,000 456,500 316,000 375,0m 136,000 40 “
I-3 20 34,0m 377,300 178,000 L61,800 230,000 449,500 52,000 20 “
-5~-
APPENDIX 11
GRAPHICAL SUMMARIES OF BASIC DATA
.
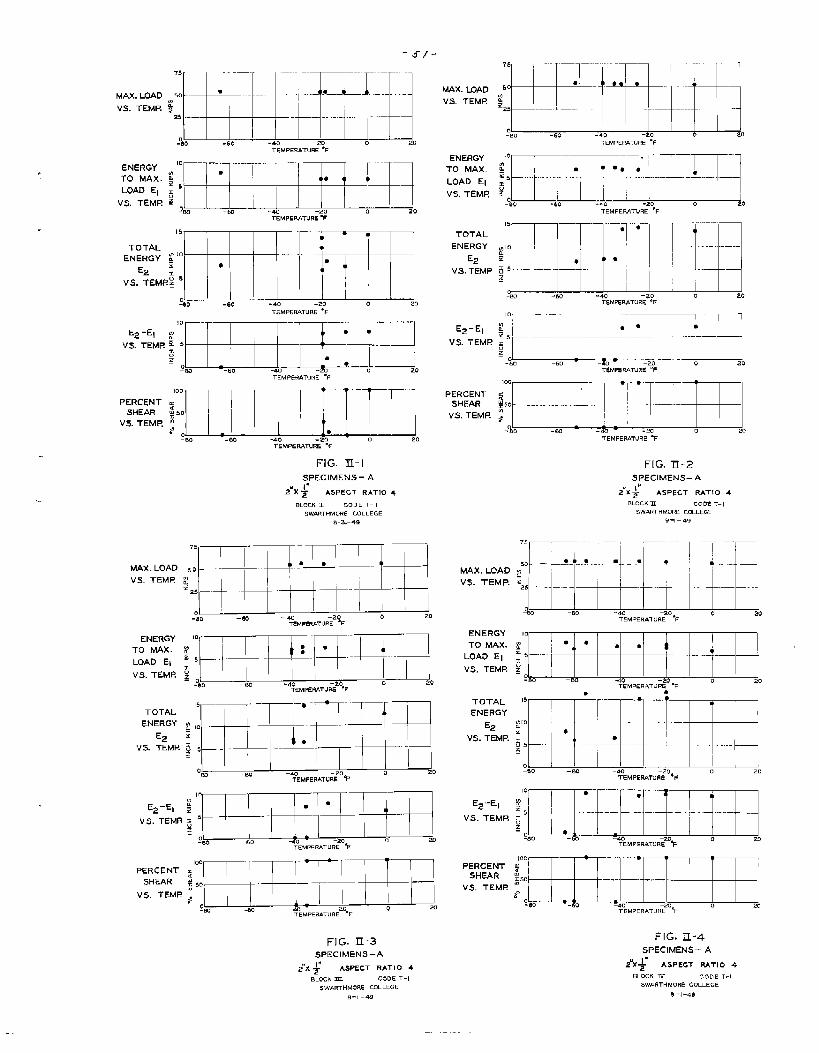
-5/-
75
1“-:.._.““--”-~:..-.,,..-
MAX. LOAD 50● 9 4I ). . .– ..––
vS. TEMP. $25 -–-–
-%0 -60 -40 –20 0 20TEMPERATuRE “F
ENERGY ‘0 .
TO MAx. f 4I* 4b #I*5
LOAD El I
:VS. TEMP -% -m “40 -20 0 20
TEMPERATURE “F
ToTAL
ENERGY $
E2 .
vS. TEMF+
15 .—. ..--. — bb d
4P10
●●
#b4D
~
%0 -60 -40 -20TEMPEU4TURE “F
‘IB333&iTEF.4PEU4TURE “F
100
T“’“0””=.-..
PERCENT .
SHEAR ; 50 -——
VS. TEMP. m.>.
●
f 00 -60 -40 -50 0 20TEMPERATURE ‘F
MAX . LOAD
VS. TEMP
ENERGY
TO MAX.
LOAD EI
VS. TEMP
TOTAL
ENERGY
E2
VS. TEMP
E2 ‘El
FIG. ~-l
:PECIMENS - A
~“x; ASPECT RATIO 4
BLOLX I CODE T-1SWPRTHMORE COLLEGE
8.31–49
~~fl-pfw]o
–m ~MERATuR~2Q*-4U
MAX. UIAD
vS. TEMP
ENERGY
TO MAX.
LOAD EI
VS. TEMR
TOTAL
ENERGY
E~
VS. TEMP
E2-EI
VS. TEMP
PERCENTSHEAR
vS. TEMP
~~yf::~F~:[~+
-60 -40 –20TEMPERATURE %
$,.””1~ ‘“- ‘“”””””””-:~“60 “40 -20 0 20
TEMPERATURE “F
i:-Elm4!~!‘:”--W -4C –20 o 20
TEMPERATURE ‘F
MAX. LOAD
VS. TEMP.
ENERGY
TO MAX.
LOAD E I
VS. TEMP,
TOTAL
ENERGY
VS. TEMP
E2-EI
VS. TEMP
PERCENT5HEAR
,S, TEMP
TEMPERATURE “F
FIG. n-2SPECIMENS- A,,.
~“x ~ ASPECT RATIO 4
BLOCK x COUE T–1SWAPTHM08E COLLEGE
9-1–49
7’“---L;]“-”D”-““‘1;”’j ~““”0““”””””
I
““--’50 —.
r3
25 -- —-– —.
% -60 “40 –20 0 20TEMPERATuRE “F
10
EIm ● J I
-5 —.””—.4.
j 1 “ “ “ ‘~80 –00
; -:,.; LJ -’;_20-20 0 20
TEMPERATURE %
fi~oTEMPERATURE “F
FIG. IL-3SPECIMENS-A
;X + ASPECT RATIO 4
BLOCK = CODE T-lSWARTHMORE COLLEGE
9- I –49
FIG. IL-4
SPECIMENS- A
Z“x& ASPECT R4TI0 4
BLOCK TJ! CODE T-1SWARTHMORE COLLEGE
9-1-49
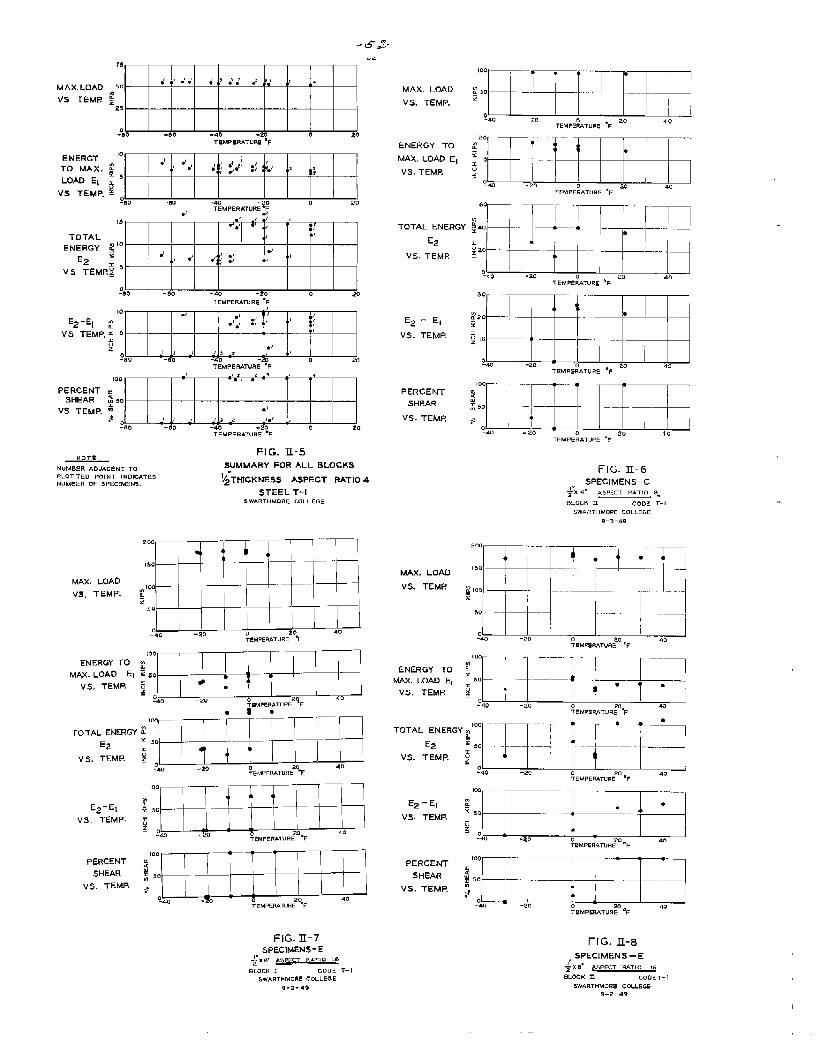
75
J a ., ., ,’ > J,z J ,,MAX. LOAD 50 — — — ~ : ‘ - $
.
VS TEMI? $25
-ono -no -40 -20 0 20TEMPERATURE “F
ENERGY ‘0 .’ , .’*,TO MAX. ; J ; ::# J 4;*, ,
I tLOAD EI ; 5
VS TEMP. ~%0 .m ~40 .20 0 20
TEMPERATURE ~;J
TEMPERATuRE “F
MAX. LOAD
VS. TEMP.
ENERGY TO
MAX. LOAD El
VS. TEMP,
TOTAL ENERGY
E2
VS, TEMR
lo- .,
E2-EI f., ‘:: , ,
.’.,
VS TEMP. : ~ t
5< ./
J ,, , ,,%0
/ *,-60 -40 .? 0 20 ‘“p E!JEfE3
TEMPERAWRi i 20TEMPERATURE “F
40
z ,., .,4100
PERCENT mSHEAR % 50
VS TEMP. :<,0
I ,, , ,: ,,, ,
-80 -00 -40 -20 0 20TEMPERATURE ‘F
NOTE:FIG. IL-5
NuMBER ADJACENT TO SUMMARY FOR ALL 13LOCKS
[bHTWcKNESS ASPECT RAT[04PLOTTED POINT INDICATESNUMBER OF $PEC!MEN9.
STEEL T-ISWARTHMORE COLLEGE
200
T~“u* “;{4 b“ _.E
I50
MAX. LOAD* Icu
VS. TEMP. ~z
50—
–040 -20 0 40TEMFfR4TURE20°F
,2 f+~p~pp;
TOTAL ENERGY~
VS. TEMP.-40 -20 0 40
TEMPERATURE20°F
‘2’”PiammTEMPERATURE ‘F
‘= E13EB3BTEMPERATURE “F
FIG. D-6
SPECIMENS-C+id? ~3pEcT ~*T,o ~
—.BLOCK X CODE T-1
SWARTHMORE COLLEGE
0-3-49
~= :.=1
MAX. LOAD El
-20
‘:Y[[F];’-1” 1 I 1’ w
o 20 40TEMPERATURE “F
““pill 0 20TEMPERA7JRE % 40
FIG. II-7SPECIMENS- E
~*xB. ~EcT ~AT,o ,8z
BLOCK Z CODE T-1
SWARTHMORE COLLEGE9-2-49
FIG. J1-8
SPECIMENS–E
+’XU’ @SPECT RATIo !6
BLOCK ~ CODE T-I5WARTHMOWE COLLE~-
9–2-49
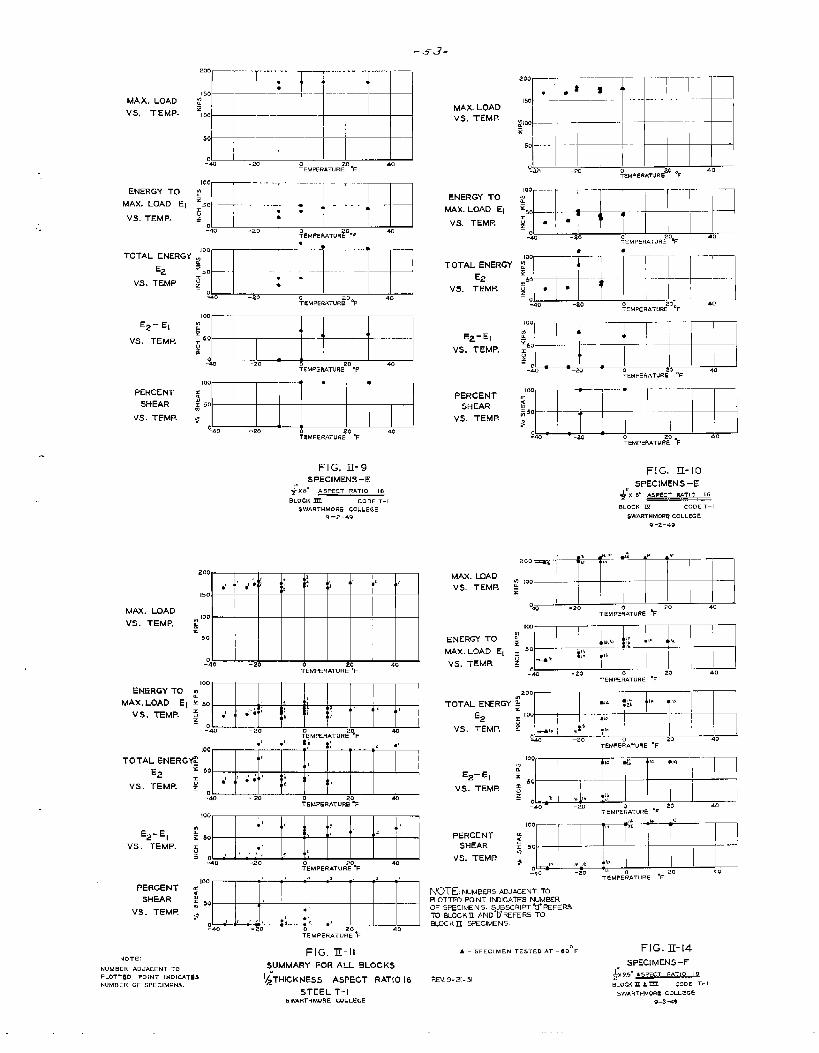
-.53.
200 —- ---- . . . . .
:N
-T . . . . .. . . ..
●
t50
f3
100 ““””-”“--T’””-”-
50 -— ‘,
-o& -20 40? EMFCRATUUC= ‘F
200 -.--..r- -..
It--’”””” ““ ‘ -
.-
.*150--
I ‘: “-:. “:
1 .-
:100 ——.— ——
x
50 -– -- L-–——, .-
!I,odo%0 -20
%PERATURE ‘F
MAX. LOAD
VS, TEMP.MAX. LOADvS. TEMR
ENERGy ToMAX. LOAD El
VS. TEMP, :EhEH+E3‘:’-0% -20~EMPERATURC20’F 40
ENERGY TO
MAX. LOAD EI
vS. TEMP.
;~;-;]---~: ,:_~””--T
-40 –20isTEMPERATURE % 4Elmi-i’”l-”””-TEMPERATUR~‘F
TOTAL ENERGY
E2
VS. TEMP.
E2
vS. TEMP
~.~-20
%MPER4TURE ‘F
i--20 0 20 40
TEMPEPATUW ,F
E2- El
VS. TEMP.E2-E,
vS. TEMP.
PERCENT
SHEAR
VS. TEMP.
PERCENT
SHEAR
vS. TEMP
FIG. II-9
SPECIMENS-E
+’XB’r AsPECT R4T[0 IB
BLoCK HC CODE T-1$WARTUMORE COLLEGE
9-2-49
FIG. 11-10SPECIMENS -E
,,+% B<’ ASPECT RATIO 16
BLOCK ZZ CODE T–1
SW&RTHMCUE COLLEGE
9 -2-’I9
200ri--77-f’W7- rzoo .,, , ,,
k, , ,
●,,,,J ●,,i
150
[00&*
30
-040 -20 &~EMPERATUP;?F
MAX.LOADvS. TEMP.
~lo:r. .Jm . . ..T II
-20 20 doTEMK-iATURE ‘F
1
IA&X. LOAD
VS. TEMP.
ENERGY TO
MAx. LOAD El
VS. TEMP.
ENERGY TO
TOTAL ENERGYtzE2 ~
vs. TEMP. i
NOTE: NUMBERS ADJMENT TOIIOTTED POiNT INDICATES NUMBEROF SPECIMENs. E#FSCRIPT ‘d REFERSTO BLOCI(D AND bREFERS TOBLOCK X =CIMENS.
FIG. II-14A - SPECIMEN TEsTED AT -OO° FNOTE:
NUMBER ADJACENT TOPLOTTED FOINT INDICATESNUMBER OF SPECIMENS,
FIG. 1-11
SUMMARY FOR ALL BLOCKSI “TH,,-KNEss AsPECT RAT~o ‘E4
sTEEL T-1
“ SPECIMENS-F
;X 9.5” QP--T RbT!O 19
BLOCX Z & ~ CODE T-1REV 9-2[-51
5wARTHMORE COLLEGE9–3 +9SWARTHMORE COLLEGE
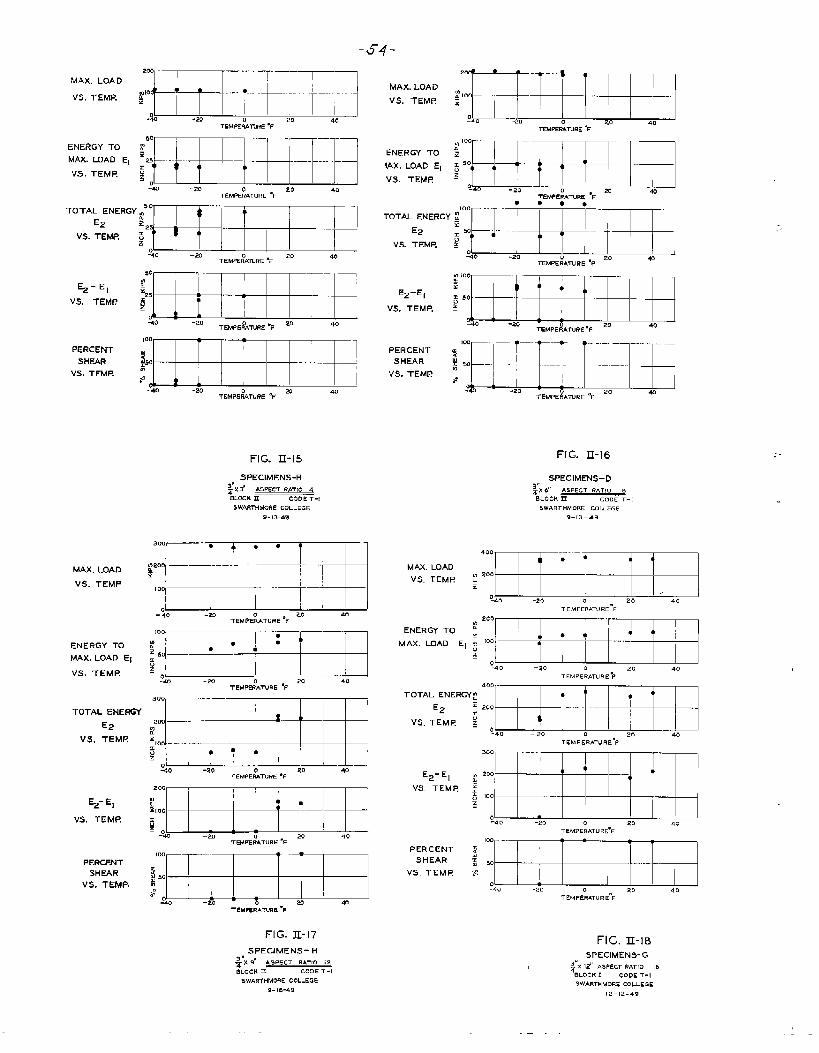
ij+Ff-:}”+’!T’~-20 20 40
TEMFfROAIV?E “F“’’”~iEBEIEE
TEMPER4TJRE“F
u’::~:~+<’m~~1iAX LOAD El
20TEh4PE;ATuRE *F
40
MAx. LoAD
VS. TEMP.
ENERGY TO
MAx. LOAD El
VS. TEME
‘oTALENERG’’E13+HHb%0 –20
TEM&UPE *F20 40
‘:K:tEiwmE1-20 m
TEMPERATURE “F+
E2
V&. TEME
HHEEIll# -20TEMPERATURE ‘F 20
40 ‘EBEEB3TEMPERATuRE “F
EZ-EI
vs. TEMI?E2–EI
VS. TEMP.
EfEHEEI-+0 -20TEMPEI?ATuRE “F
20 40 1-”E TEMPERATURE“F
PERCENT
SHE4R
VS. TEMP
PERCENT
SHEAR
VS, TEMP
FIG. II-16 ..FIG. II-15
SPECIM”ENS-B
$ X 2? ASPECT RATIO 4
BLccN Z CODE T-1
SPECIMENS-D3’” ,,XX 6 ASPECT RATIO BBLOCK II CODE T-1
5WARTHMOWE COLLEGE
9-13–49
3WARTHF.+ORE COLLEGE
9-13-49
qf~+
–20 20TEMPE&uRE ‘F
40
MAX, LOAD
VS. TEMPI
~40I I I I I 1 1- 1 I
-2’0 0 20 40Temperature” F
. . .-
iBEEEEH“’’’’’i==+=%3 -20 20 40
TEMP~OATU@E “F 400- —...
TOTAL ENERGY?
E2 ~ 200~
VS. TEMi? ~ f
~40 - 20 0 Zo 40
ENERGY TO
MAx, LOAD El
vs. TEME~40 –20 o 20 40
TEMPERATURE”F
iHIEEE%0 -20 20
TEMPERATuRE ‘F40
TOTAL ENE-
E2
vs. TEME TEMPERATURE-F
EEFH-40 -20 0 Zo 40
TEMPERATURE%iEEIBER– 20 20 40
TEMPERATURE “F
EZ- El
VS. TEMP
‘EEEHB3a.40 -20 0 20 40
T EM PER4TUR E-F
PERCENT $SHEAR ~Y
VS. TEMP. sL+EEmBTEMPERATURE“F
PERCENT
SHUR
VS. TEMP.
FIG. II-17FIG. II-18
, SPECIMENS-H
+X 9“ 4SPECT RATIO 12
QLoCK n COD E T~l
SWA~HMORE COLLEGE
9. I 6-49
SPECIMEN9-G,“~ x 12”ASPELT RAT,O ,8
BLOCK 1 CODE T-1
SWARTHMORE COLLEGE
12-12-49
—
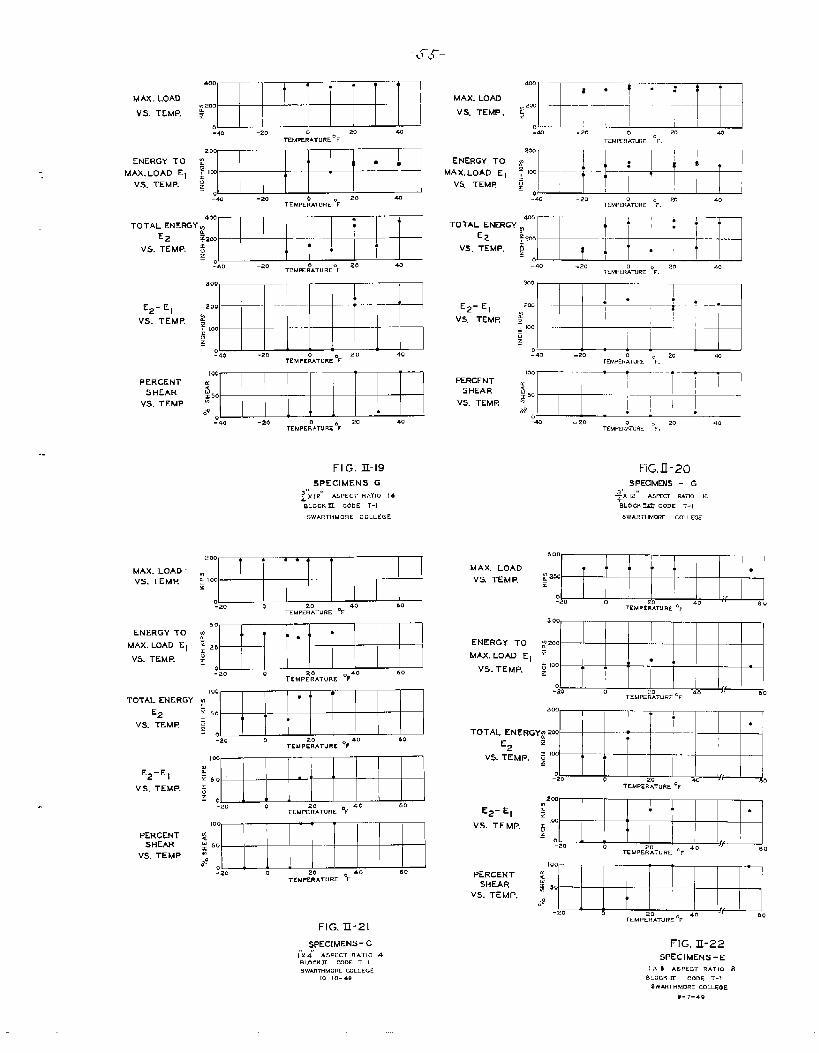
FEEHEEEl-40 -20 0 20 40
TEMPERATuRE*F
+EEEm3n.40 -20 0 20 40
TEMFERATLRE “F,
MAx. LOAD
VS. TEMP.
MAX. LOAD
VS. TEMP.
c:.~-20 20 40TEMPE~ATUFE “F
i“fB3RH-20
TEhWERiTURE “F.20 40
ENERGY TO
MA X, LOAD El
VS. TEMP
ENERGY TO
MAX. LOAD El
VS. TEMP.
E2
VS. TEMP. VS. TEMP.
ill-20 20
TEMFER;TURE ‘F.40
E2- El
vs. TEMF
E2- El
VS. TEMP.
100
2:50.
.+
-040
T T
-20 20 40TEMPE;ATUFE ‘F
PCRCENT
S HEAR
vS. TEMP.
PERCENTSHEAR
VS. TEMI?
FIG. ~-19 FIG, H-,20,, SPECIMENS G
:X12’” ASPECT RATIO !6
BLOCKU cODE T-l
SWARTHMORE COLLEGE
SPECJMENS - G
:x 12“ ASPECTR4T[a [6BLOCK IUI CODE T-[
SWARTHMCRE COLLEGZ
“’””+EBHEEl-20 0
TEMPE~A7URE ‘F40 eo
MAx. LOAD
VS. TEMP.
ENERGY TO
14Ax. LOAD El
VS. TEMP.
‘:::::EEEEEEI-20 0 40 60
TEMP&?ATURE ‘F
.-.
E2-EI ;fso “-
VS. TEMP. 5:0 ●
-z 0 0 40 60TEMPE2R0ATURE ‘F
i’:~
100 .—.
—.—
0
:20 0 40 60TEMPE%ATURr *F
33EIEERTEMPEiiT”RE‘F 60
E2- El
VS. TEMP.PERCENT
SHEAR
vS. TEMP
PERCENTSHEAR
vs. TEMP.
FIG. II-21
SPECIMENS- Ci’x4“ ASFECT RATIO 4RLOLKS CODE7-1SWb$lWIJORKCOLLECC
lo–la-do
FIG. II-22SPECIMENS -E
I X * ASPECT R~TIo 8BLOCKu- cou T-r
3WARFHUOPEco~~~~~9-7-40
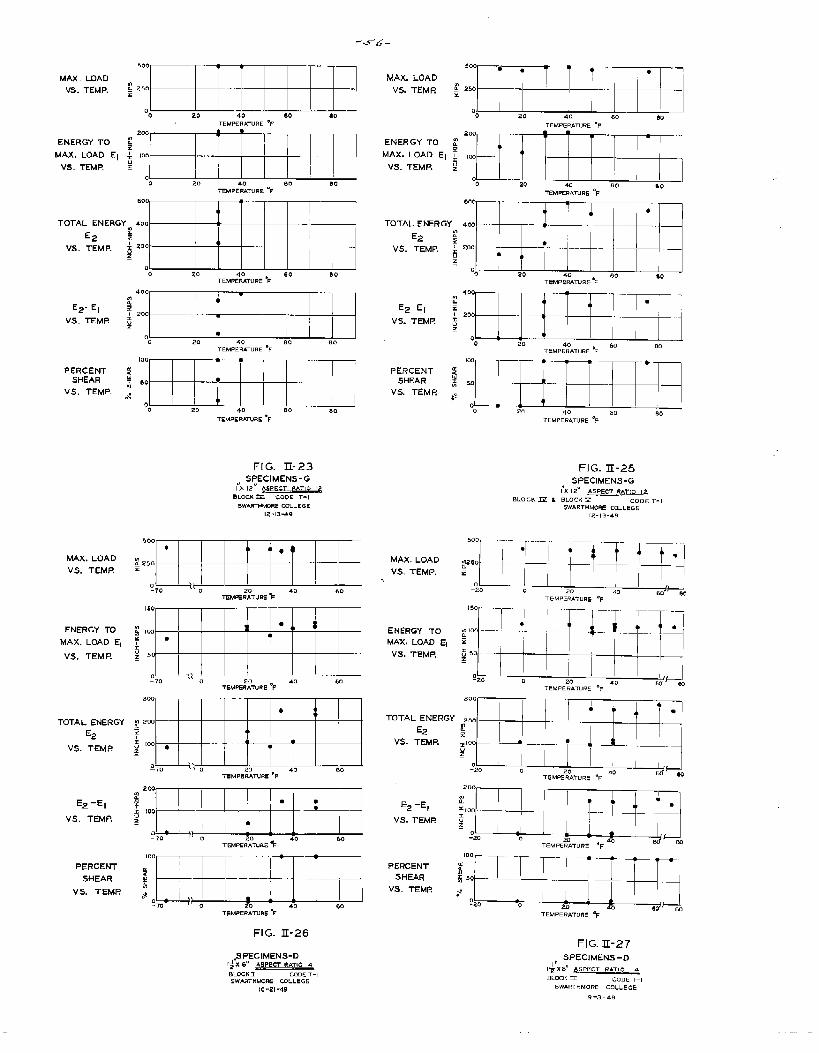
‘g’”;’‘+&EEEEH20 40 60 *O
TEMPERATURE ‘F
:qTm_~l20 40 60 80
MAx. LOAD
VS. TEM E ~
~R~J~~2ErEEBElMAX LOAD El
0 20 40 eo aoEMPEP.ATURE “F
ENERGY TO [
MAx. LOAD E, 73VS. TEMP. ~
‘OTALENER’yIEEEBTlo 20 60 80
TEMP~ROATURE‘F
TOTAL ENERGY
E2
VS. TEMP.
qIHH3H20 40 eo 80
TEMPERATURE “F
100 .. .
2:~ 50 .,. 4*
.e0 T
0 20 40 60 aoTEMPERATURE “F
ZIIHEH0 20 40 60TEMPERATuRE ‘F
80
E2-EI
VS. TEMR
‘f+~+’fl-p-”fl20 40 @o 80
TEMPER4TUFE “F
PERCENTSHEAR
vs. TEMP.
PERCENTSHEAR ~
VS. TEME ~
PILI. JL<3
SPECIMENS-G
FIG. II-25SPECIMENS-G
ix I 2“ A5EECT ~ATIo 12— .—= ..—_BLOCK= & BLOCK T C013F T-1
SWARWMRE MLLEGE12-(3-+9
5WAETWMRE coLLEGE--
lz-l a-49
MAX. LOAD
VS. TEMP.
ENERGY TO
MAX. LOAD ~
VS. TEMP.
TOTAL ENERGY
Ez
VS. TEMP
I I I I Ill:20
Io jdm
T EMFE2R0ATuRE *F40
E2 -El
vS. T~P.
E2 -El
vs. TEMR
HEmEEBT EMPERATUFIE “F
PERGENT
SHEAR
VS. TEMI?
PERCENT
SHEAR
VS < TEMF?
FIG. II-26FIG. D-27
,,SPECIMENS- D SPECIMENS -DI;*X 6“ !$.$P@C7 PATIO 4BLOCK~ CODET-l
5WARTHMORFCOLLEGE
9-3-49
1~~ 6“ ASPECT RATIO 4
BLOCK T— CODE T-1SWAdT141MRE COLLEGE
10-21-49
-..
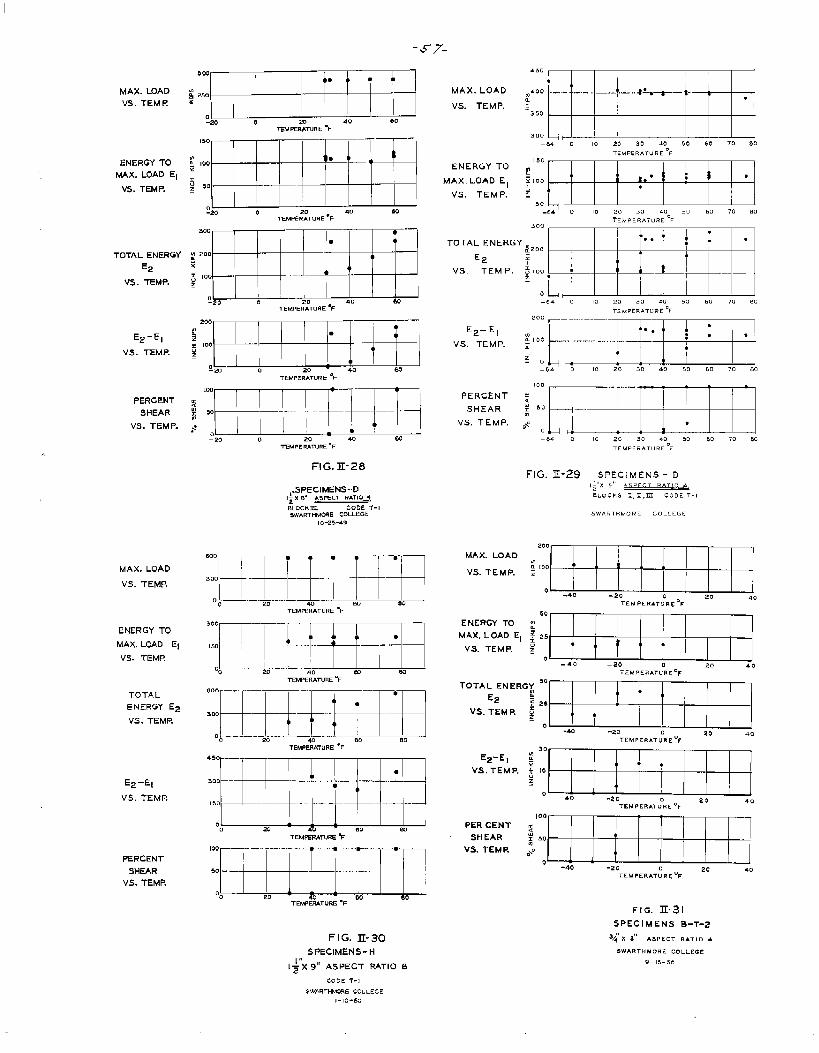
-5,%-
vS. TEMR X
ENERGYTO ~
MAX. LOAD Elz
VS. TEMP. s
TOTAL ENERGY
E2
VS. TEMP.
E2-EI
VS. TEMP.
PERCENT
SHEAR
VS, TEMP.
MAX. LOAD
VS. TEMP.
ENERGY TO
MAX, LOAD El
VS. TEMP.
TOTAL
ENERGY E2
VS. TEMP.
E2-E,
vs. TEMP.
PERCENT
SHEAR
vS. TEMP.
.
‘:f3m31H0 20 40 wTEMPERATURE “F
FIG. 1-28
,.SPECIMENS-D1~~ # ASFECT RAmO 4
BLOCK?5 CODE T-l$WART ME COLLEGE
10-2549
‘EHEEEBTEMPERATURE “F
MAX. LOAD
vs. TEMP.
ENERGY TO
MAX. LOAD El
VS. TEMP.
450I I I I I I I I
!iwMi4–64 O 10 20 30 40 50 60 70 80
Temperature ‘F
~i~
-64 0 10 20 30 40 50 60 70 80TEMPERATURE “F
“’;’yiLe.6.4 0 10 20 30 LO 50 60 70 80
TI)4PER*TURE ‘F200 __ .,..,. ...._r ________
V::-:p.~lo:l-.:l......~........l...j... ~ \ I .1–64 O 10 20 30 40 50 60 70 80
“’’”TTEEEEEEvS. TEMP. ~+
.64 0 10 20 30 40 50 60 70 EC
TEMPER AT URE°F
FIG. 31-29 SPECIMENS- D,lllX ~!l2
-T ~’lAELOCMS 1, ’U, IT CODE T-1
5WARTHMORE COLLEGE
200
MAx. LOADm
VS. TEMP. ~ ’00I1
0.-40 -20 0 20 40
TEMPERATURE”F
‘~~R~’EEEE-40 –20 0 20 40TEMPERATUREOF
30-
E2-E, :
VS. TEMP, ~ m;
0-40 -20 20
TEMPERATURE ‘f40
‘ ‘;;::iEBEEEH-40 -20 0 20 40
TEMFERATUREOF
FIG. ~-31SPECIMENS B-T-2
FIG. 11-30SPECIMENS - H
I +“X 9“ ASPECT RATl O 6
34 h’ 3“ ASPECT RATIO +
$WARTHMORz COLLEGE
0- 15-50
COOE T-1
3WARTHM3RE COLLEGE
1-10-50
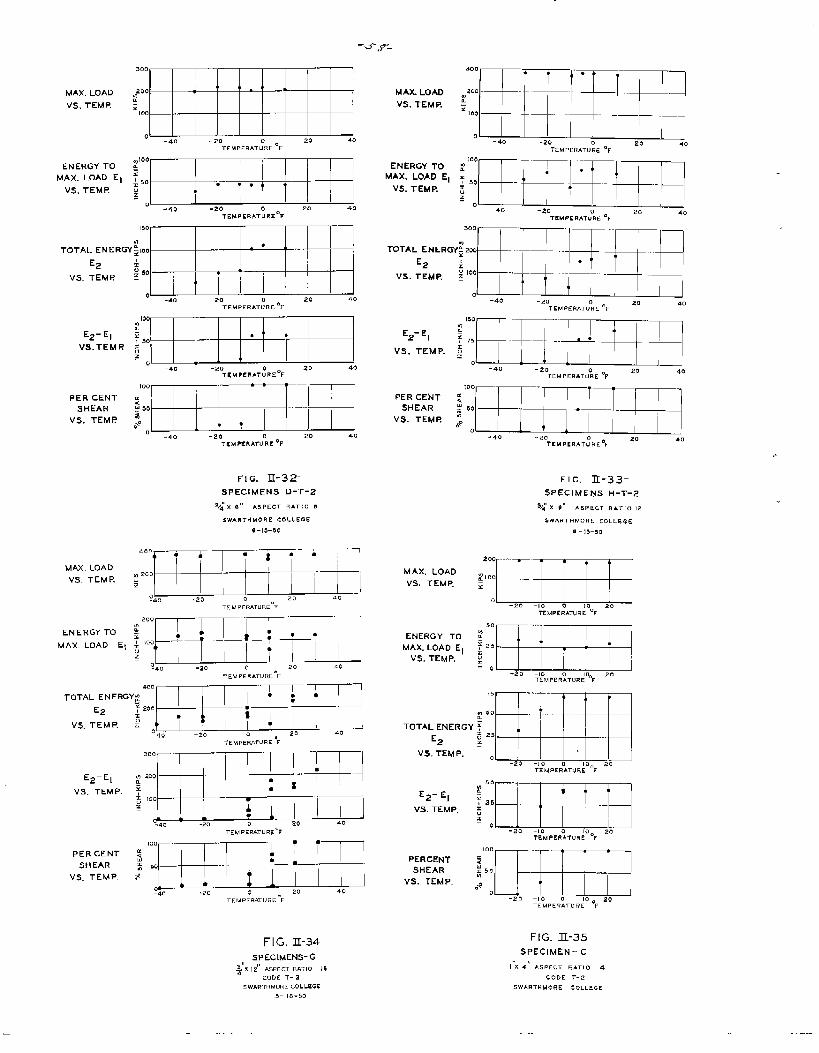
“;’iBEl%fH-40 -20 0 20 40
TEMPERATURE ‘F
::; [~+++MAX. LOAD EI
-40 -20 O.zo 40Temperate RE”F
E2
VS. TEMI?‘oTALENERGyiwB-40 -20 0 20 40
TEMPERATURE *F
E2-EI
VS. TEMR
PER CENT
SHEAR
VS. TEMP
MAX. LOAD
VS. TEMP.
ENERGY TO
MAX. LOAD El
E2
VS. TEMR
E2-EI
VS. TEMP
PER CENT
SHEAR
VS. TEMP.
M AX. LOAD
VS. TEMP. :IiEEBEH-20
TEMPERATU!W ‘F
$~~’Emil%-40 -20 2G
TEMPERATURE ‘F40
,~TEMF’ERATUORL ‘F
40
[~:+++l=pq ,~EzMp ;’:~fl:~~~-40 -Zo 20 40
TEMPER AT~REOF’40 -20
TEM PERATU\E ‘F20 40
ffql++++f: .+-40 -20 20 40
00TEMPERATURE F
FIG. lT-32-SPECIMENS D-T-2
a/; x ~“ AsPECT RATIO 8
SWARTHM08E COLLEGE
9–15–50
iI+EEELRF].20 0 20
TEMPERATURE%
TEMPERATURE-F
TEMPERATURE ‘F
iBEBs-40
TEMPERATuRE%
~’:=-40 -20
TEMPERATUBE ‘F
FIG. ~-33-SPECIMEIYS H-T-Z
34 x 9“ A9PEC7 RATIo 12
$WAFTHMOR& COLLEGE
o – 15.50
‘x”’!FI13Hl-.20 -,0 0 20
TEMPERATURiOOF
75
w
.“ . .. ..—
w $0 . . . . . .m
TOTAL ENERGY f: 23
Ez .
VS. TEMP. - ~-20 -10 0 10. 20
TEMPERATURE ‘F -
E2- El
VS. TEMP.
PERCENT
SHEAR
VS. TEMP,
iEFiEEElTEMPER; TUR~OoF
:=-20 -,0 20
TEMPEW;TURi O “F
FIG. Itu34
,,SPECIMENS-G
; x 12” AsPECT RfiTIO 16CODE T- 2
5WARTHMORE cOLLEGE
5- 18-50
FIG. II-35
SPECIMEN- c
I x 4“ 4SPELT R*T,O 4
CODE T-2
SWARTHMORE COLLEGE
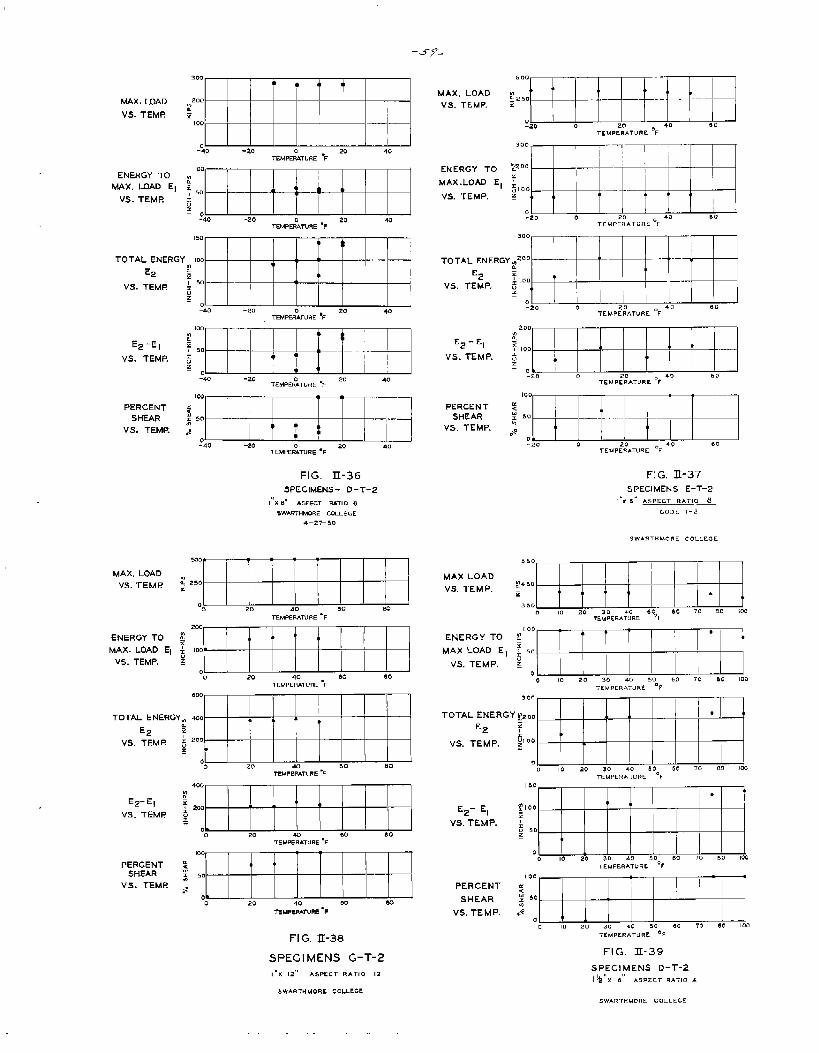
-5-$-.
q+HEEl-20 20 40
TEMPE~TURE “F
3jIEuHR0 20 40 00TEMPERATURE ‘F
MAX. LOAD
vS. TEMP.M4X. WAD
VS. TEMR
‘;:;”3HIEEEHMAX.@AD El $
-40 -20 0 20 m
ENERGY TO
MAX. LOAD El
VS. TEMP.
—.TEMPERATURE “FTEMPEF!ATURE “F
ToTALENRG~~ff~l
-20 0 40 00TEMP;;ATURE ‘F
150
I lTf
‘“TALENERG’E4=-20 20
TEMFfR%URE ●F40
E2
vs. TEME%
vs. TEMP.
!’:=:0 -20
TEMP~TuRE “F20 40
200
t; ,00 . .
$z
O*-Zo
QiZFikE“ 20 0 40 60
TEMP;;&TUFE %
Ez - El
vs. TEMP.
E2‘E 1
vS. TEMP.
qJ+f+++++p20
TEMPEiTuRE “F40
PERCENT
SHEAR
VS. TEMP.
PERCENTSHEAR
vs. TEMP.
FIG. ~-36SPECIMENS- D-T-2
I“x e“ A3PECT SAIIO a
?.WWHMORE CmLEGE
4 -27– 50
FIG. It-37SPECIMENS E-T-2
I’x 8“ ASPECT RATIOLCODE T-2
SWA.QTHMORE COLLEGE
‘STEMP‘!OEIEEEEH20 ’40 00 en iEEEEEl
i,,0 10 20 30 40 50 60 70 80 100TEMPERATuRE “F
MAX. LOAD . MAX-LOAD
VS. TEMP.
TEMPERATURE ‘F
2!~o 20 40 60 80
TEMPERATUP& “F
ENERGY TO #
MAX. LOAD El +
vs. TEMP. :
ENERGY TO
MAX. LOAD E,
VS. TEMP,
iBEH3110 20 40 80 aoTEMPE~TURE “F
‘OTALENn ,0 20 30 40 50 60 70 60 100
TOTAL ENERGY.
E2 E
vS. TEMP 6z
EZ
VS. TEMP.
—.TEMPERATuRE “F
.
Ez- E,
vs. TEMP.
TEMPERATuRE “F100
PERCENT %SHEAR : 50
VS. TEME ~
0●
0 20 40 no C4 H+EEEER0 10 20 60 70 80 100
T~MPER%RE50° F
PERCENT
SHEAR
VS. TEMP.TEMPERATURE “F
FIG. IC-38FIG. II-39
SPECIMENS D- T-2
Ik”x e“ ASPECT RATIO 4
SPFGI MENS G-T-2I“X 12” ASPECT RATIO 13
SWARTHMORE COLLEGE
SWARTHMORE COLLEGE
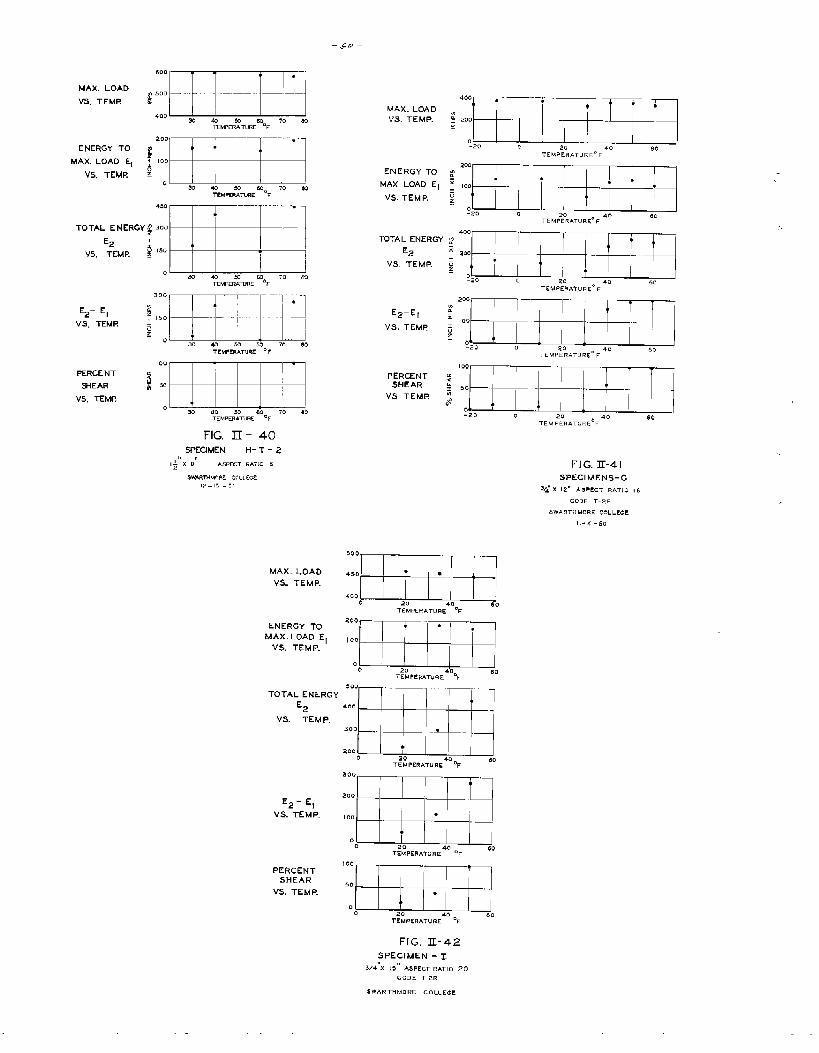
‘:x’’”‘ZEIIEF53043 70 ~
TEMPERATuRE%r
E2- El
VS. TEMi?
PERCENT
WEAR
VS. TEMi?
Em3040%6070 80
TEMPERATuRE “ F
TEEEEEm m 60 70 80
TEMPER5&JRE 0F
FIG. H - 40
swATw.ir w c< Li [m,;, —,: .!.
ENERGY TO ;
MAX LOAD El -z
VS. TEMP. :
.E2-EI ~
VS. TEMF j
PERCENTSHEAR
;#
VS TEMR ;
i3dIEHlmziTki3
20 40 60TE!”l PE%4TuRE”f
200 —
f
100
~2 o?
‘:i%il%ll:20 0 20 40 60
TEMPERATURE” F
509
w
TOTAL ENERGY
~2 400 . .
VS. TEMP.300 . .
2000 40
T;; PERATu RE ‘F.50
E2- El
VS. TEMP.
PERcENTSHEAR
VS. TEMP.
300
=
-.
200 .
100 - .
00 40
T~; PERATu RE ‘r60
FIG. II-41
SPECIMENS-G
3/:x 12,, A5PECT R&’j-,o ,G
CODE T-ZR
SWARTHMORE COLLEGE
11-4-50
FIG. II-42
SPECIMEN -I
3/4 x 13” ASPECT RAT,O 20
LODE T-2R
SWARTHMORE COLLEGE
-61-
ATPENBIX111
.LOAD-ELONGATION CURVEQ
.—
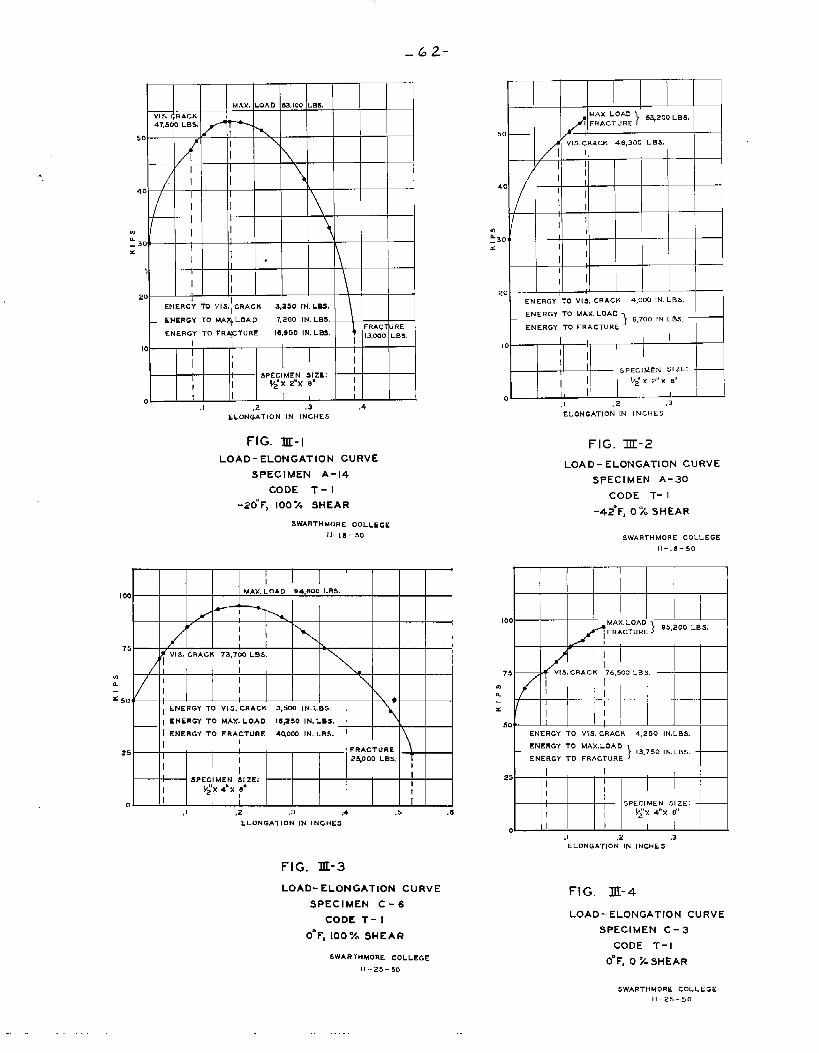
— 62-
..
M Ah’. LOAD 53,100 LBS.
Vls, ( ,RACK47,50 0 LB?,,
50 I \
I
I \/ I I
I40
I I\
I I
I I
w I I
:30/ I
xI
II
..\
)I
II
I20 1 I
ENERGY TO VI S. ICRACK 3,35o IN. LBS,\
tENERGY TO MAXI LOAD
ENERGY TO FR&TURE ~’=::wkdI 1
101
I1
II
II
I SPECIMEN SIZE:
I I L#x Z“x 8“
I0. I I 1
.1 .2 ,3 .4
ELONGATION IN INCHES
FIG. III-l
LOAD-ELONGATION CURVE
SPECIMEN A-14
CODE T-1
-20°F, 100% SHEAR
SWARTHMORE COLLEGE
ll-[a -50
I00MAX. LOAD 04,800 LBS.
/ *r’ I
I
75 1 \VIS. CRACK 73,700 LBS.
1
/ ! ! I L
: I
I I
f-50, I \*
, ENERGY TO VI S. CRACK 3,500 IN. LBS.
1 ENERGY TO MAX. LOAD 16,250 IN. LBs. \
I ENERGY TO FRACTURE 40.OC.3 IN. LBS.
I!
25 I FRACTUREI
I 25,000 LBs, 1If
ISPECIMEN SIZE:
I
I I/:x 4“X :“II
n I I,1 .2 .3 ,4 .5 .6
ELONGATION IN INCHES
;:;;;;}’ 53,moLBs.
50 /VIS. CRACK 413,300 LBS.
I 1
/ ! /
I40 I
II
II
* /If
:30 q 1I
x I
1;
1
I I20
ENERGY TO VI E., cRAc K 4.0~ IN. LBS.
tENERGY TO hlAX. LOAD
ENERGY TO FRACTURE) 6,700 IN Lea.
H
‘EEIEiZm.1 ,2 .3
ELONGATION IN INCHES
FIG. Itt-2
LOAD-ELONGATION CURVE
SPECIMEN .A-30
CODE T-1
-42”F, O% 5NEAR
SWARTHMORE COLLEGE
11-18-50
,.
—
I 00~;:fl,} 95,200 LB3.
I
1VI S, CRACK 76,500 LBs,
W [
L II I
x ( I I
50* 1
IENERGY TO VI S. CRACK 4,250 lN. LBS.
ENERGY TO MAX, LOAD
}13,750 IN, LBS,
ENERGY TO FRACTUREH
2131FKm.1 .2 .3ELONGATION IN INCHES
FIG. III-3
LOAD-ELONGATION CURVE
SPECIMEN C-6
CODE T-1
o“F, 100% SHEAR
SWARTHMORE COLLEGE
11-2s-50
FIG. ~-4
LOAD-ELONGATION CURVE
SPECIMEN C-3
CODE T-1
O*F, O % SHEAR
SWARTHMORE COLLEGE
11–2S -50
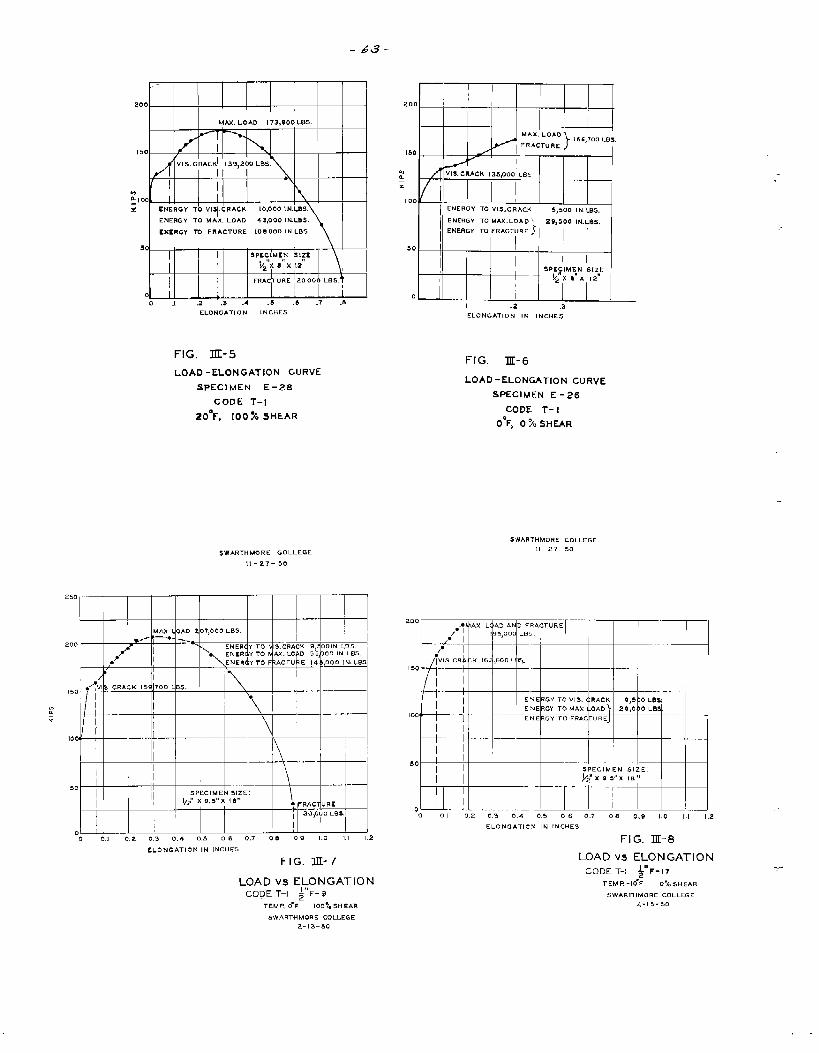
-6 J-
Jrm=mMAX. LOAD 173,900 LBS.
150 I/V!S, G RACK1 139,2 00 LOS
[
~ — ~ — — 7 — ‘.
wflea , !, I
x ENERGY TO vIq. cRhcK 10,000 IN, LBS,
IENERGY TO MA;. LOAD 43,000 INLBS.
ENERGY To FRACTURE 108000 lN.LB$. M I50 \
I –1 SPECIMEN klzE “
V2”X a“ x 12”
I FR.4$URE ;20 00< I LBS.l
0 I0 .1 ,2 .3 .4 .5 .6 .7 .U
ELONGATION INCHES
FIG. IU-5
LOAD-ELONGATION CURVE
SPECIMEN E-28
CODE T- I
20”F, IOO%5HEAR
SWARTHMORE GO LLECIE
11-27-50
250 ~~ .
MAX ~O*D 2 07,000 LBS.
~__ . ..-
w-- : —* - I200
# ‘p I “ Im
/
1
I
‘ ‘ “: ,j 1
ENERd YTO~ 19~CPACK 9,d ODIN lBS.ENERC .Y TO u h. LO D 55, 000 IN LB5,
.,” tENERd ;Y TO F3ACTU E 14 3000 lN, L@S~..
,50 .Li! I5. CR* VK 15~ 700 <es.
p,
. . . ..—. ‘)
l– --- . . .
100 —.. —.-.
I. . ...1
: F ‘-
~ .—–
50 ——
I ‘ sPZCIME N SIZE:l,; x 9.5,1X la,,
● FRAC URE
II 30’O\OLe=
o I .-,. — ..0 0,1 0.2 0.3 0,+ 0,5 Oe 0,7 on 09 1.0 1.1 1.2
ELONGATION IN INCHES
FIG. 31C-7
LOAD VS ELONGATIONCODE T-I ;’t F- 9
TEMF! O“F 100%SHEAR
5WARTHMORE COLLEGE2-13-50
ELONGATION IN INCHES
FIG. IE-6
LOAD-ELONGATION CURVE
SPECIMEN E -213
CODE T- I
o°F, O % SHEAR
SWARTHMORE COLLEGE
11–27-50
200
8( : :1
.,* AX L< AD AM D FI?Ao:TURE/ I 95,000 LB:,
.—.. -.. .—
/
Iv S CR!4 F 16? ,600 L 3s.150 ,-. —
EVE RGY TL Vls, <tRACK 9,3 30 LBS
100 ./.. ‘ME ‘G’ ‘< ‘Ax ‘-o~”)29,08 >0 LBS
ENE RGY r< D FRAC ?UREJ
1--1 -- -—I ~
50I I SPECIMEN SIZE;
).’$, ,,#’x 10,,
I I-- . . ..— .——
I 1o~ J,. II
0 0 l“” 0.2 0.3 0.4 0.5 0 6 0,7 0.9 0.9 1.0 1,1 1,2
ELONGATION IN INCHES
FIG. III-8
LOAD V9 ELONGATION
CODE T-1 ~F-17
TEMP. -IO”F O% ?,I’IEAF!
SWARrHMORE COLLEGE
2-15-50
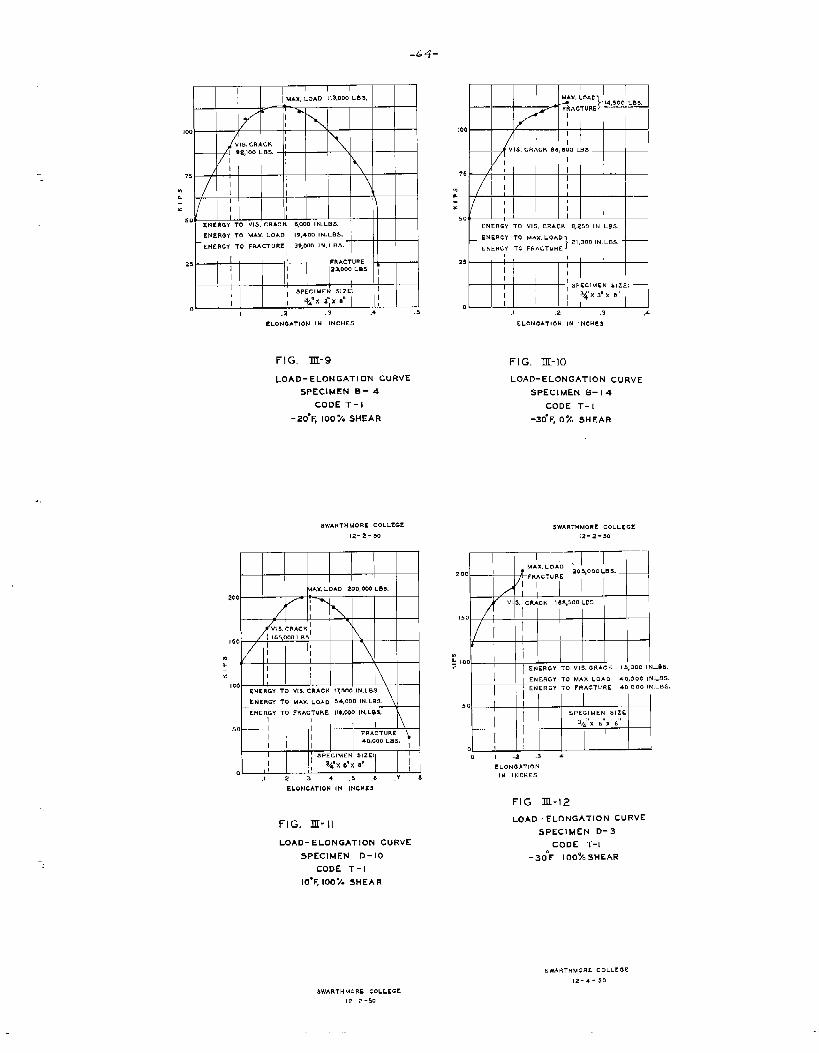
1 I IMAX LOAD 113,000 Lns.
8-1
-8.
1100
IVIS. CRACK ,
I 9Z,1OO LB5,
I 1I I
75 /
I11
w I \ ,. I
;/
II I
50 I 1 IENERGY TO VIS. CRACK 6,200 lN. LBS.
t
ENERGY TO MAX, LOAD 19,400 lN. Ln$.
ENERGY TO FRACTURE 3*,W lN. LHA.1 +M
25 [ I FRACTUF!E 1h
I 1 23,000 LES
I 1I
\1
, SPECIMENSIZE. I
I 1I
0~“x 3“ x n“
.2 .3 .* .5
ELoNGATION IN INCHES
FIG, IJI-9
1 I.—.- .— —./ &..a!fL?!?:!Fs
1100 I1
IVIS, CRACK LIEJ800 LHS
I
75 / II
. I 1
. I
;/
1I I
50, s I
ENERGY TO V15. CRACK 8,250 IN LBS.
‘EFFiii#,1 ,2 ,3 ,4
ELONGATION IN INCHES
FIG. III-IO
LOAD-ELONGATION CURVE LOAD-ELONGATION CURVE
SPECIMEN B- 4 SPECIMEN 6-14
CODE T-1 CODE T-1
-20”R 100% SHEAR -30” F, 0% SHEAR
SWARTHMORE COLLEGE
12-2-50
I I I I I 1 III I LAM. LOAD 20.. WLB5. I I
200 1.
I-%
!
VIS. CRACK ~\
/ I 165,000LRI150
I I.&
1 1
iI 11
I 00 IENERGY TO V[S, CRACK f7#O0 IN, LBS.
ENERGY To MAX. LOAD 34,000 lN. LBs.
ENERGY TO FRACTURE I18,CO0 IN. LBS. \
‘DIS!?Pa,1234,5 .8 .74
ELONGATION IN INCHES
FIG. III-II
LOAD-ELONGATION CURVE
SPECIMEN D-10
CODE T-1
IO*FIOO% SHEAR
SWARTHMORE COLLEGE
12-2-50
I T:~\200 ‘Ax’ LOAD 205bOOOLP._ _
? FRACTURE
/ ;
/vl
‘;S. CRACK 168,500L8S
!50 I
I !I \.:100
,!
I
IENEWTOVIS.C”RACK 15,000 MLB5
I ENERGY TO MAX LOAD 40,000 lN.LB5.
ENERGY TO FRACTURE 40 000 lN. LBs,I
5 0 )SPECIMEN SIZE
I \ 3/4”x B“X e“
I001.2. s4
ELoNGATIONIN INCHES
FIG. III-12
LOAD-ELONGATION CURVE
SPECIMEN D-3
CODE T-1
-300F 100’%SHEAR
SWARTHMORL COLLEGE
12-4-50
$WARTHMORE COLLEGE
[2- 2-%
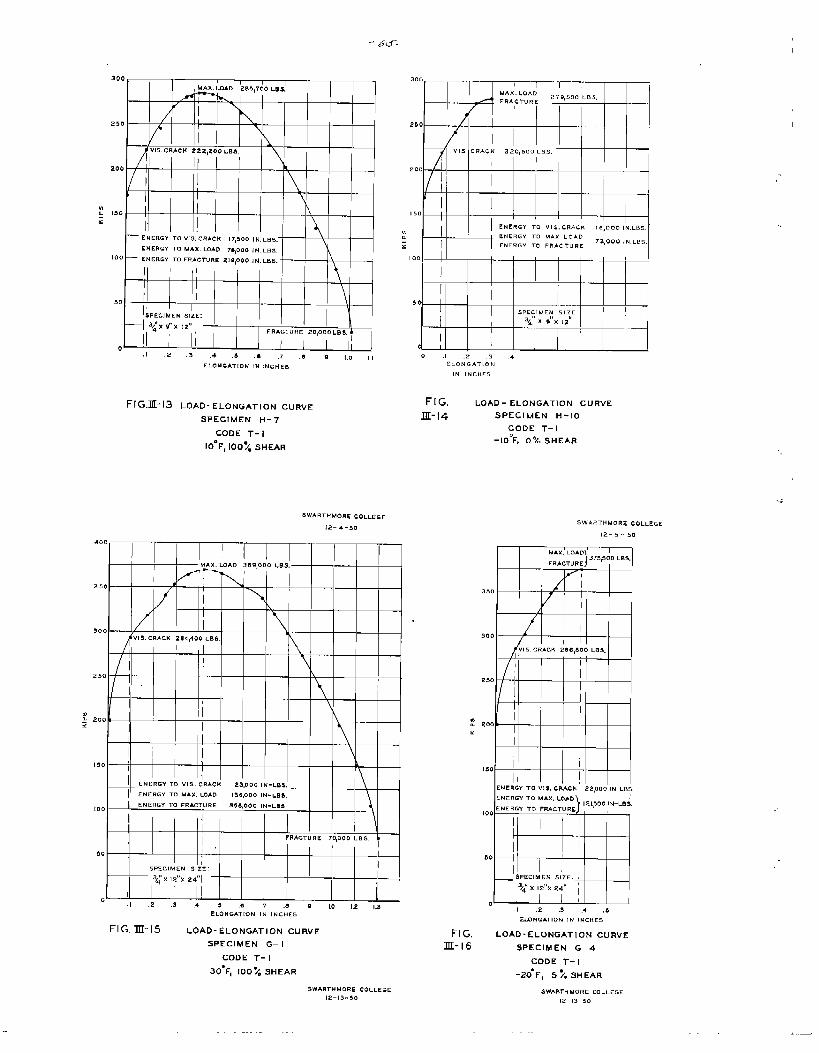
- 6d-
3001 1 I
MAX. LOAD 285,700 LBS,
d/ ~
I250 /
1
I\
v15.CR ACK 2 2z\zo o LBS.
200 .“ k
\
. —
? 150
z! “ - j
— ENERGY TO VI S. CRACK [7,s,30 IN. LB=.\ENERGY TO MAX. wAD qooo IWLBS
100 — ENERGY TO FRACTURE Z19,000 lN. LnS. -
1
I \
so
1- I“-— ——
SPEC!MEN SIZE:
—1 34’, ,“X ,,,, \FRACTURE .20,000 LBs, &
~!llllI I I
.1 ,2 .3 .+ .3 ,, ,7 ,a ~ ,0 ,,
ELONGATION IN INCHES
FIG.~-13 LOAD-ELONGATION CURVE
SpECt MEN H-7
CODE T-1
IO”F, 10o~ SHEAR
40o
I “rrr”-— MAX. LOAD 369,000 LBS,
350 n -..
\
300 --- I
VI S. CRACK 284400 Las.
I
.-
\
. .
250
I
I\
!flk 200 ax
[
I I \130
I1
II_ ENERGY TO “1S, CR+CK 23,0oo IN-LBS, \j ,N,RG, TO MAX,WAD ,36,00 .,...,.,
100 I ENERGY TO FRACTURE ase,000 IN. LRS
I I
\
I I “, FRACTU RE 70 ,000 L Ss.I
so 1 I
I 5PECI MEN slz’E: I
34X 12”X 24”1 L——
I I0“
.1 .2 .3 ,4 5 .6 7 .4 w ,~ ,2 ,,3
ELONGATION IN INCHES
300 .“.—1
~—-. r-_ rMA X. LOAD
270,5o0 LB$,
200
I
I150 — . .
( —1
tYTtHi0 .1 .2 .3 .4
ELONGATION
IN INCHES
FIG. 111’-I5 LOAD-ELONGATION CURVE
SPECIMEN G– I
CODE T- I
30”F, 100~. SHEAR
?.WARTHMORE COLLEGE12-13-50
FIG. LOAO - ELONGATION CURVE
lIt-14 SPECIMEN H-10
CODE T-1
-lo°F, 0% SHEAR
SWARTHMORE COLLEGE
12-5.50
“—MAX LOAD
}~
375,500 LRS,FRACTURE
350 / ‘!
/
-.
/I
I
I300
/ IVI%CRACK 28E,400 LB s.
*~ zoot
150
ENERGY TO VIS..CRACK 22,000 lN-LBS.
ENERGY To MAX. L.yfio
50
0.1 ,2 .3 .4 ,5
ELONGATION IN INCHES
FIG. LOAD-ELONGATION CURVE
III-16 SPECIMEN G-4
CODE T- I
-20” F, 5 % SHEAR
SW&RTHMORE COLLEGE
12-!3-50
. ..—
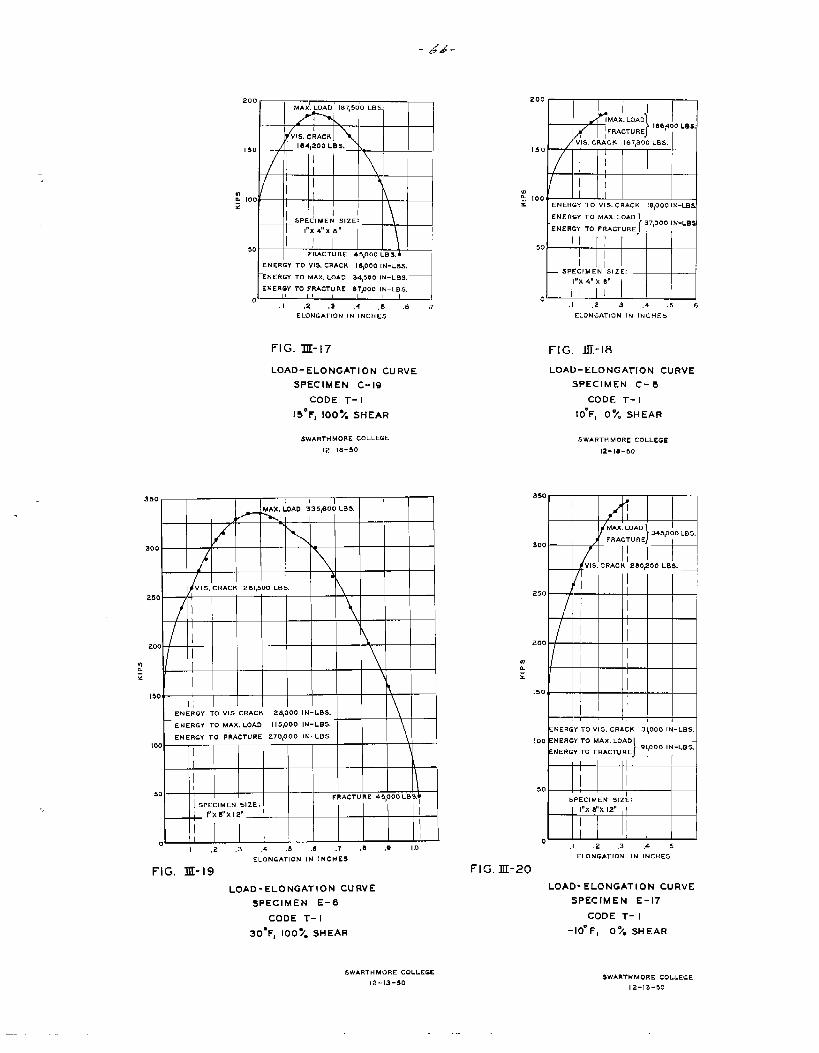
- .4A--
350
300
250
200
VI.:
I$0
Ioc
5C
200-MAX. LOAD 1678500 [email protected]. -
. ..II
\ . .
V!?,. cRACK
/ ] 1041200 L Bs. _150
I ;
I\
e I /: 100* I
I !$PECIMEN SIZE: \I“x 4“X 8“
I II50
F<ACTURE 4S,000 LBS.
L&-dENERGY TO VI% CRACK !e,000 [N-LB=.
ENERGY TO MAX. LOAD 34500 IN-LBS.
ENENGY TO FRACTURE 87,000 IN-LB$,
.1 ,2 ,3 .4 ,5 ,$ ,,
ELONGATION [N INCHES
FIG. IK-17
LOAD-Elongation CURVE
SPECIMEN C-19
CODE T- I
15°F, 100% SHEAR
SWAVTHMORE COLLEGE
12–16-50
I I IMAX.LOAD 335,800 LB%
>
A
Vls, c Fmc K Zel, 5 00 LB5,
II \
I\
I \EN E&Y TO $’1S.CRACK 28,000 IN- LB?..
\ENERGY TO MAX, LOAD 115,000 IM-LBS.
ENERGY TO FRACTURE 270,000 IN-LBS.
I \
\
I SPECIMEN sIZE:FRACTU RE 45 ,000 LB q
_ -l_ ,“X n“x ,2”
I
,2 .3 ,4 .5 .6 .7 .8 .e I.0
ELONGATION IN INCHES
FIG. III-19
LOAD-ELONGATION CURVE
SPECIMEN E-6
CODE T- I
30=F, 100~m SHEAR
$WARTHMORE COLLEGE
12-13-50
200
R
IMAX. LOAD
}1FRACTU RE
18&~00 LBs,
VIS. CRACK 187,300 LB$,1s0 —
-1 ‘ _
IImk 100x ENERGY To Vls. CRACK 1.9,000IN-LB
IT+?ldENERGY TO MAX. LOAD
1
37,000 !M-LBSENERGY 70 FRACTURE
50 . ~ ,..
IISPECIMEN SIZE:
I“x 4“ x 8“
oII j
,1 ,2 .3 ,4 ,5 .6
ELONGATION IN IN CHE5
FIG, 111-18
LOAD-ELONGATION CURVE
SPECIMEN C-8
CODE T-1
10”FI 0?. SHEAR
5WAPTHMORE COLLEGE
12- la–50
350
/300
II IVIS. CRACK 280,200 LE$.
I250 t
!I
III
II
:: I ;
150, ,
I
ilENERGYT0v15,cRACK 31,000 [N-Lss.l
-t%d100 ENERGY TO MAx, LOAD
191,000 IN-LB$.
ENERGY TO FRACTURE
II50
sPECIMEN SIZE:
l“x 8“% 12”
u.1 .2 ,3 .4 5
ELOMGATION IN INCHES
FIG. 111-20
LOAD-ELONGATION CURVE
SPECIMEN E-17
CODE T- I
‘IO-F, 0?. SHEAR
$wARTHMoRE COLLEGE
12-13-50
—.
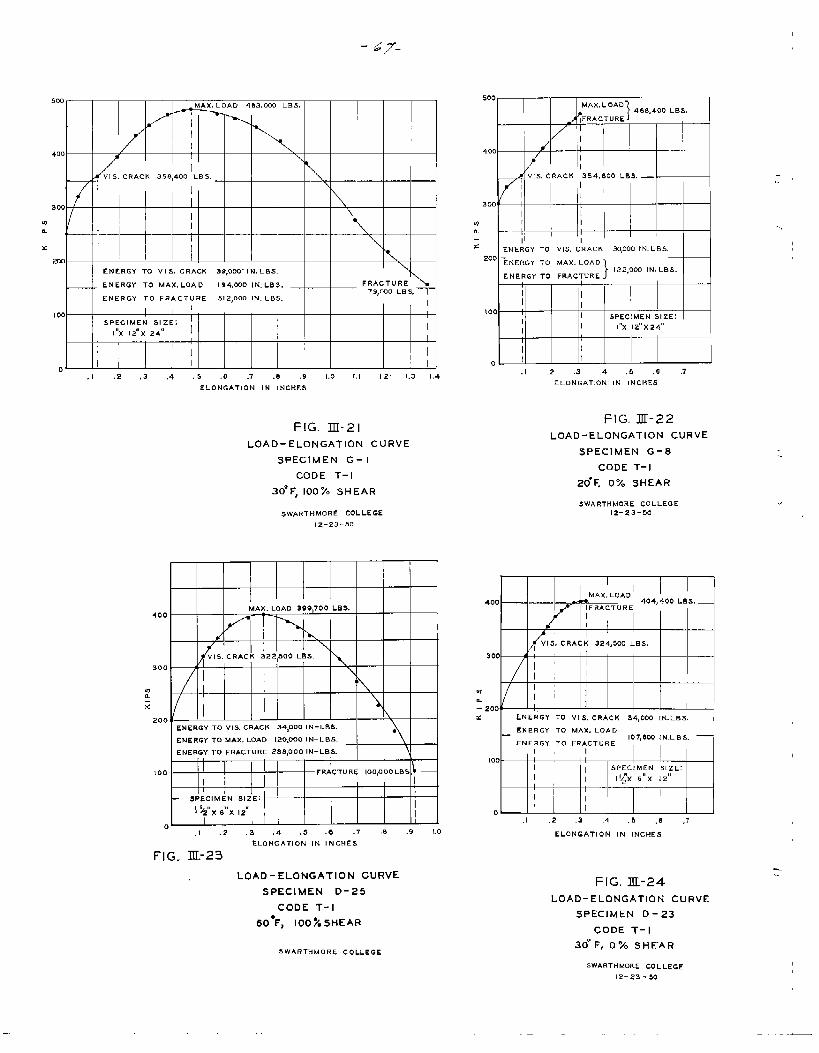
-67.
500-MAX, LOAD 483,000 LBS,
I
I
I400 1
I
\
VIS, CRACK 358,400 LBS.
I \
II
300I
Iw I
\
& 1— Ix I I
200 I \
I ENERGY TO VIS. CRACK 39,000 IN, LBS.
_ -l ENERGY TO MAX. LOAD 194,CO0 IN. LBS. FRAcTURE79,wo LF, S, l—
1ENERGY TO FRACTURE 512,000 IN, LBS.
1I
100 I! 1 I
ISPECIME!4 SIZE: I
I“X [2”X 24”I
I
I [
In I.
.1 .2 ,3 .4 .5 ,6 .7 .* ,9 1,0 1. I 12 1.3 I .4
ELONGATION IN INCHES
FIG. 111-21
LOAD-ELONGATION CURVE
SPECIMEN G-1
CODE T-1
30” F, 100% SHEAR
3WARTHhiORECOLLEGE12-23-50
MAX. LOAD 399,700 LBS.400
/ \
vI.S. CRAC K 322 ,500 LBs.
300\
wu
2I
\
200ENERGY TO VIS. CRACK 34,000 IN- LBS.
●
ENERGY TO MAX. LOAD 120,000 lN–!-Bs.
ENERGY TO FRACTURE 288,000 IM– LBS. \
I
100I FRACTURE 100,000 LB%
I I
SPECIMEN SIZE:I
I &“x ~“~ ,2”I
I0
I
.1 .2 .3 .4 .5 -e .7 ~ .9 1,0
ELONGATION IN INCHES
FIG- IIL-23
LOAD-ELONGATION CURVESPECIMEN D-25
CODE T-1
ISO”F) IOO%5HEAR
SWARTHMORE COLLEGE
ENERGY TO VIS, CRACK 30,000 tN. L 0S. II200 -
ENERGY TO MAX. LOAD
} n122,002 IN. LBS.
ENERGY TO FRACTURE1 -—..
I I
I I100
I SPECIMEN SIZE:I
II I“X 12”X 24”
l-.1
I 1
n I I
.1 .2 .3 .4 ,5 ,6 ,7
ELONGATION IN INCHES
FIG. III-22
LOAD-ELONGATION CURVE
SPECIMEN G-8CODE T-1
20” F, O% sHEAF?
SWARTHMORE COLLEGE12–23-50
IMAX. LOAD
400 — - ..— — 404,400 LBs. —IF RACTURE
d ~I
, VIS. CRACK 324,500 LBS,
300 I
I I
I
I
I I
I I!
w.- 200+ 1 I 1 Ix ENERGY TO VIS, CRACK s4,0c.c IN. LBs,
ENERGY TO MAX, LOAD—I07,6W3 [N,LBS.
ENERGY To FRACTUREI I
100 - I
I I SPECIMEN SIZE:
I I I1+”X 6“X [2,,
1.. .
I I
nI 1
,1 .2 ,3 .4 .5 .6 .7
ELONGATION IN INCHES
FIG. III-24
LOAD-ELONGATION CURVE
SPECIMEN D-23
CODE T-1
30” F, O% SHEAR
.,,
...
SWARTHMORE COLLEGE
12-23-50
— .- -L—
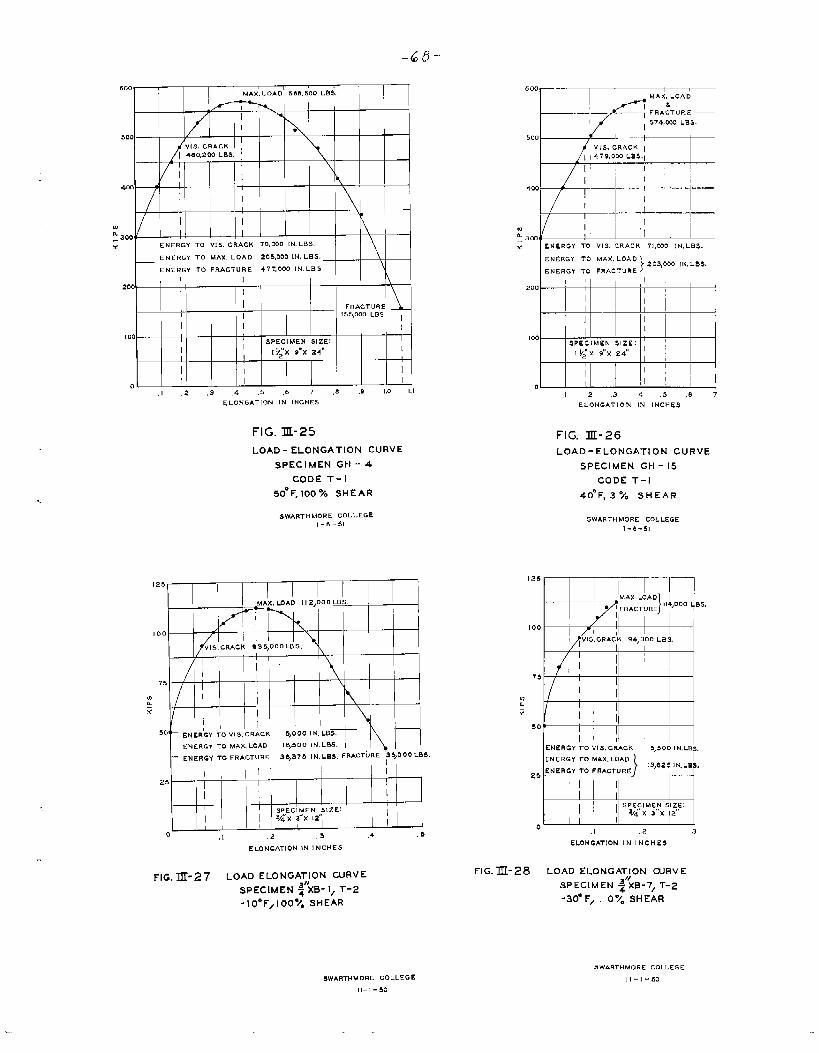
-.4&
600MAX, LOAD 568.500 LBS.
1
I h
I ●
500 IV($. CRACK
I 4e0,2W LBS .1—.
I 1
I\
I400 i ! 1
I I
I I
I I
\
!0
~ 300 f !, I —
Y ENERGY TO VI E., CRACK 7Q.~0 IN. LBs. \
}ENERGY TO MAX. LOAD 205.00o 1~. LBs.
+-l+ENERGY TO FRACTURE 477,000 lN. LBs.I I
200h. —
1 I II I FRACTUREI I !55,000 LBS. ,
I I I[00 1
ISPECIMEN SIZE: r
I I $:X 9“X 24” I
! --
I I I
I0 . I I
.1 2 ,3 .4 .5 .6 7 .8 .9 lo 1,!
ELONGATION IN INCHES
FIG. XL-25
LOAD-ELONGATION CURVE
SPECIMEN GH-4
CODE T-l
50” F, 100% SHEAR
SWARTH MORE cOLLEGE1-8.5!
MAX. LOAD I I 2,000 LBs.
II
100 /I
,Vls CRAC K 935 ,000 LB s.
I
\
II
75I
II
\
u!m I
z ““ I I
I ks o, + EN ER’GY TO VIS. CRACK 5,000 1N, LBS.
ENERGY TO MAX, LOAD 19,500 IN, LBS. I 1)1 I“-ENERGY TO FRACTu RE 38,375 IN, LBS. FRAcT~RE ?5,000LBs-
1
I I I23 .
I I I
I I
I I SPECIMEN SIZE:
I I *:X f-x 12”I
I Io ,1 ,2 ,3 .4 ,5
ELOMGATION IN INCHES
FIG. 711-27 LOAD ELONGATION CURVE
SPECIMEN +%B- 1, T-2
-lee F,l OO~o SHEAR
SWARTHMORE cOLLEGE
11–1-50
u 00
574,EO0 LB5.
500
[ 479,000 LB$,,
4C0
[ ‘1 i; ! -
.. . . . - ““.-..,
.L– —.... ,-
Wy 300$* ENERGY TO VIS. CRACK 71,~0 lN, L@S.
tENERGY TO MAX, LOAD
)203,000 (N, LBS.
LNERGY TO FRACTURE i
200 -.-—’1 I
II II _ I1 I
I100
I
.5PECIMEN $lZE:
1&X 9“X 24”1,
I
~1 I ,; ~ ,n.1 .2 .3 4 .5 .6 .;
ELONGATION IN INCHES
FIG. TIC-26
LoAD-ELONGATION CURVE
SPECIMEN GH - IS
CODE T-1
40” F, 3% SHEAR
SWARTi+MORE COLLEGE
1-6-51
125
100
I
II
75 1
II
: I: / I
I
30, II !
1ENERGY TO VI S, CR4C6 $,500 !N. LBi.
ENERGY TO MAX, LOAD
}
13,625 lN. LBS.ENERGY TO FRACTURE
25 ~-- 4
,t&kw,1 ,2 3
ELONGATION IN lhl GHE$
FIG. ~-28 LOAD ELONGATION CURVE
SPECIMEN +k, T-2
’30” F, O?w SHEAR
3WARTHMORE COLLEGE
11-1-50
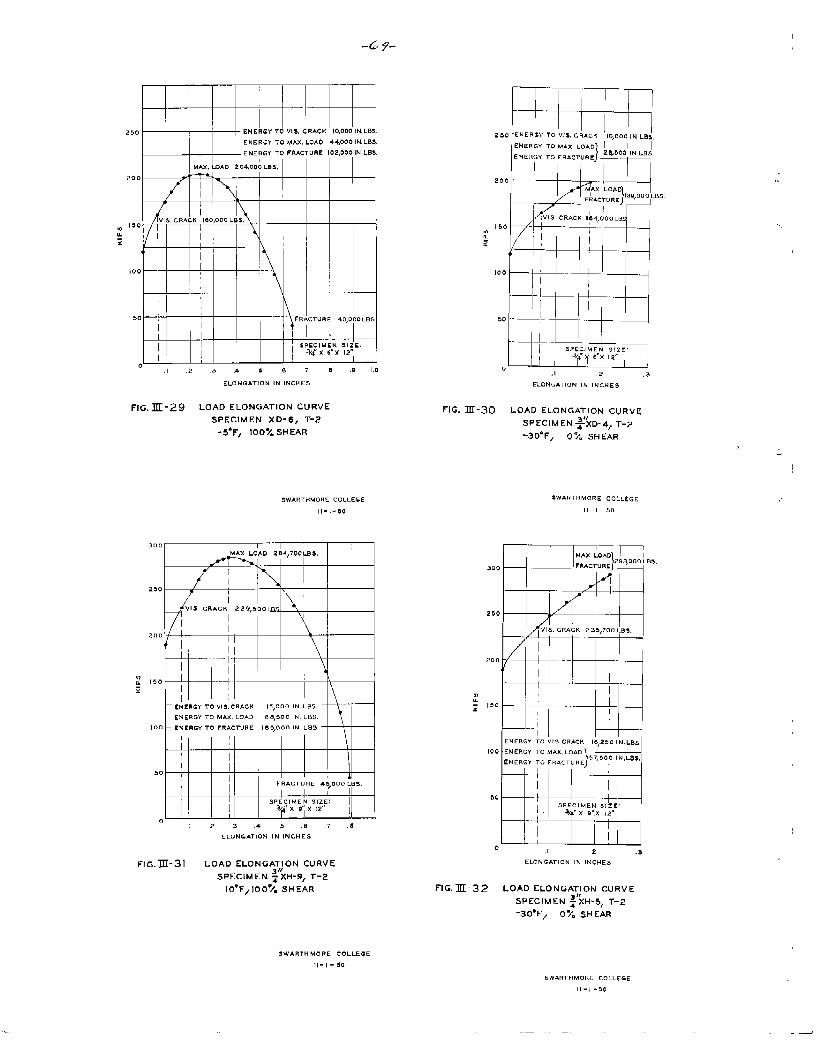
-6 y-
.—
.-. -
Z50 ENERGY TO Vl$, CRACK 10,000IN.LB5,
Ulm ENERGY TO MAX LOAD 44,000 lN.LBSi
ENERGY TO FRACTURE 102.000 IN LBS.
& ~..+’.~-200
I —
—..I
VIs, CBA Cv 180,000 LB?., .,150
:z
I.. . \
100
.— —-- —
I
50 —1 -– ‘ - ““~RP,CTURE 40,000 LBS
II1
-.]. ,d_
ISPECIMEN SIZE,
j 3/<X 6“X 12”
“.1.2 .3.4s.6 7B.91.o
ELONGATION IN INCHES
FIG.~-Z9 LOAD ELONGATION CURVE
SPECIMEN XD-6, T-2
‘5*F, 100% SHEAR
SW.4RTHMORE COLLEGE
11-1-50
300 I,-....
IMAX LOAD 284,700 LBS,
250? (
v Is CR ACK 229, n OoL&
I \
200 I. ..
–. ~.-.
I \: 150 — - – — .. —., .-
:I ! \
[
,,ENERGY TO VIS. CRACK
w
15,000 IN. LB5. - ‘----
ENERGY TO MAX, LOAD e8,500 IN. LBS,
100 ENERGY TO FRACTURE I 65)000 IN LBS.
-L --—1 \50 —
AFRACTURE 43,000 LBs,
I——.. . 1SPECIMEN SIZE:
*“X 9“X 12’” I
o.1 .2 .3 ,4 5 ,8 ,7 .8
ELONGATION IN INCHES
FIG.~-Sl LOAD ELONGATION CURVE
SPECIMEN ;’iH-9, T-2
10-F, 100”/. SHEAR
[?~. -Tfl250 ENERGY TO VIS, CRACK ,0,000 ,M LB,,
‘00+++++4ILL. IL..LI
50diH”&EELONGATION IN INCHES
FIG. 111-313 LOAD ELONGATION CURVE
SPECIMEN +D-4, T-2
‘300F, O% SHEAR
SWARTHMORE COLLEGE
11-1-50
“.‘— yMAx LOAD
}
~RAcTu RE .293,000 L@.$,300
—. .—.
~‘“ I “ ;i
1.
250
V15 CRAC K 235,700 LBS,
200
,,
150 I_
. .
cuERGY TO VIS CPACK 18,25’0 !N, LBS
w100 ENERGY TO MAX, LOAD
}ENERGY TO FRACTI.IRE 5’>’”; 1“’8s
-1
50 -1-- ,P,C,MEN;j~,1. *~x 9“% ,2”
0 .1 2 .3
ELONGATION IN INCHES
FIG,~-3p LOAD ELONGATION CURVE
SPECIMEN ~’iH-5, T-2
‘30”F, 0~. St+ EAR
...
SWARTHMORE COLLEGE
11-1-50
5WAFTHMOPE COLLEGE
11-1-50
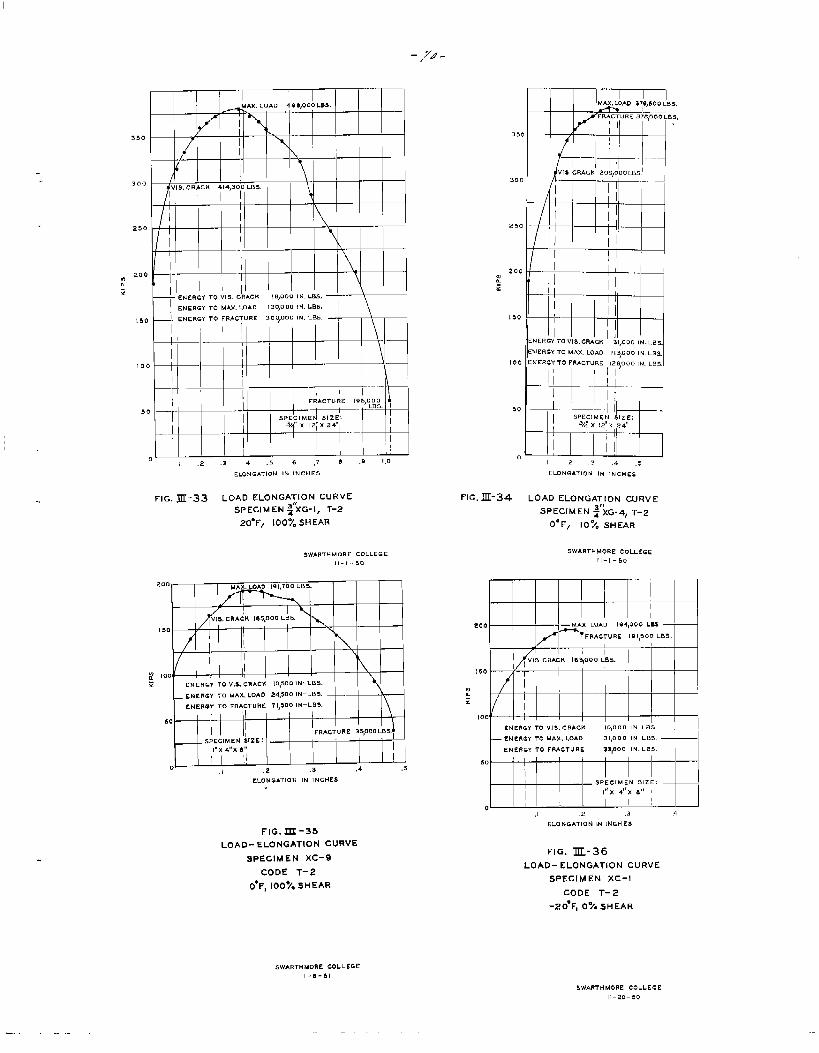
-/7J.
.
.
350
300
250
~ 200
&
:
150
10(
3(
.—I
MAX, LOAD 4*8,000 !-0S.
VIS, C-R-Ac k 414,30 0 LBS.
~ ENERGY TO V15, cRACK jE,OOO IN- L=. . ‘ \I ENERGY TO MAX. LOAO 13~Q001NLB5 I I \ I I1.ENERGY TO FRACTURE 300,000 [N. LB5. — 1~
I II I \.- 1 I I
1’ I ‘“- ““- /
.1 ,2,34.5 e,7e.9 !.0
ELONGATION IN INCHES
FIG. ~-33 LOAD ELONGATION CURVE
SPECIMEN ~“XG-1, T-2
20”F, 100~e SHEAR
SWARTHMORE COLLEGEH-l-50
.?00
! 50
: 100 u
? ENERGY TO Vl$. CRACK 1o,500 lM-LBs.
_ ENERGY TO MAX. L04D ~4,500 !N-LBS. h
ENERGY TO FRACTuRE 71,5°0 lN– LBS.
150
I I II
II 1! FRACTURE 35,a00LBS.1
_ SPECIMEN SIZE:
I,, X 4“X a“ I
! I 1!o .2 .3 ,4 ,5
ELONGATION IN INCHES
FIG. m-35
LOAD- ELONGATION CURVE
SPECIMEN XC-9
CODE T-2
O*F,100% sHEAR
35
301
Z5[
20[
?z
150
100
50
0
‘ ““””~1MAX, LO&D 379,500 LRS,
—
—. .I
;11’
V13 CRACK 309,0 QOLB5.
I
II
/j 1“‘“
/ III
.-
—./ “
IIil ‘ ‘-
-. II
II
.. “.J I ““
UERGJ ,0”, ,. CRACK 1 /,,000 ,..LB=,
ti
dERGY TO MAX. LOAD 113,000 IN. LBS
dERCY TO FRAcTURE 12e,000 IN, LB$.
II
i—.
H—...! ISPEC, MEN *,ZE:
3/. 12“ x 24”-. —.
II12 .3.4,5
ELONSATION IN !NCHCS
FIG. m-34 LOAD ELONGATION CURVE
SPECIMEN ;’;G-4, T-2
O-F, 10 ~. SHEAR
SWARTHMOPE COLLEGE
[1-1-50
. .
200 MAX LOAD 194,000 LBS
FRACTUF!E 19!,500 L8S.
1I
VI3.CRACK 183,000LB3.
150 /I
w.;
I
II
100 ~
ENERGY TO Vl$, CRACl! 10,000 lN. LaS.
— EN ERGr TO MAX, LOAD 31,000 IN LB%
ENERGY TO FRACTURE 3a,000 lN, LE5. N
5EEi3EBl,1 ,2 .3 4
ELONGATIOF4 IN lNLHE$
FIG. IU--36
LOAD- ELONGATION CURVE
SPECIMEN XC-1
CODE T-2
-20”F, 0% SHEAR
SWAF!THMOUE COLLEGE1-8-91
9WARTHMORE COLLEGE
11-20-50
-..
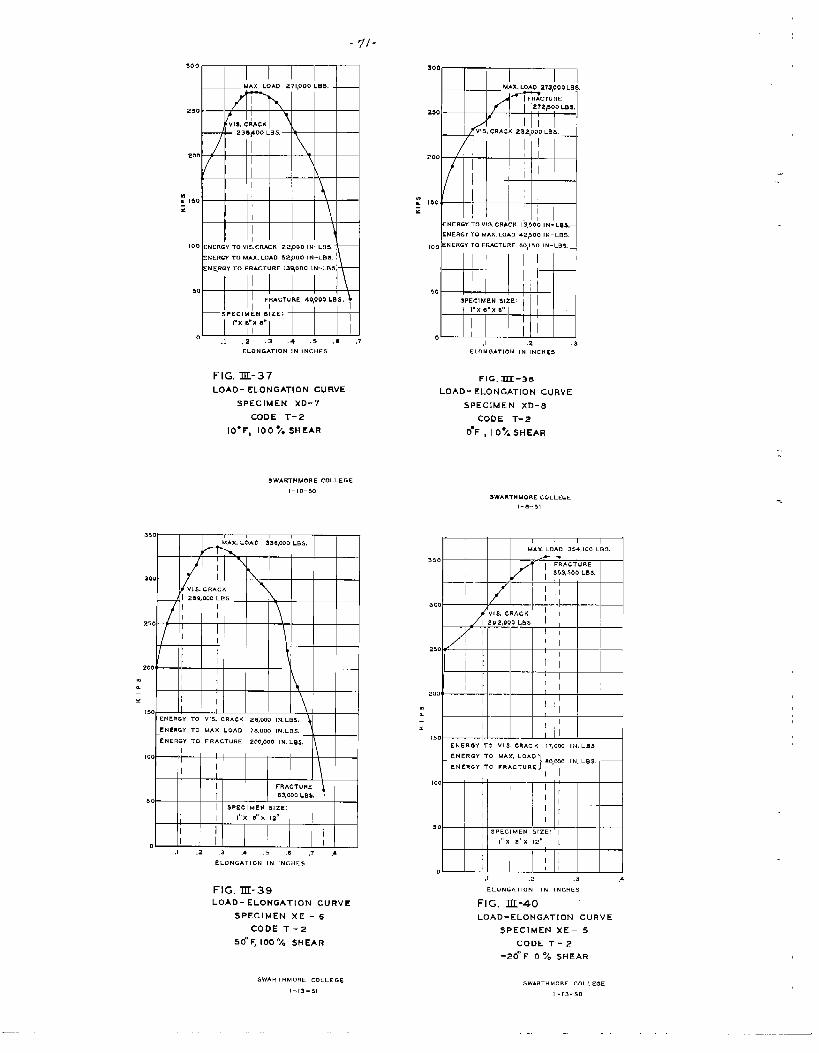
-rl -
3“0rTrrT-1-rlMAX. LOAD 271,000 LU$,
250 \
11VIS. CRACK
236,400 LB$,
I\
200 1
I\
I Imx !30 I \
z I ~II ! \
100 EN EP.ZY TO VI!j. CRACK 2ZOO0 !N-LBS.
ENERCY TO MAX. LOAD 52~00 IN-LBS.
EN&RGY To FRACTURE 130,000 lN-LB$
I Iso
FRACTURE 40,000 LB s, \I II
—s ?ECIMEN SIZE: I 1
I r x .,,r .,, I
Io
.1 .2 .3 .+ .5 .a ,7
ELONGATION IN INCHES
FIG. IIC-37LOAD- ELONGATION CURVE
SPECIMEN xD-7
CODE T-2
10-F, 100 ~. SHEAR
300
II=J
T : :4
+CTURE‘272,500 LBS,
250
IllVls CRACH 232,000 LBS,
11—200
I l—
: 150 -1
z ~~
ENERGY TO V!S, CPACK 13,500 IN- LBS,
ENERGY TO MAX. LOAD 42,S00 IN- LBs.
100 ENERGY TO FRACTURE 50,150 IN-LB*, 1
&+II
50
‘%%” I 1
0,1 ,2 ,3
ELONGATION (N INCHES
FIG. m-3.9
LoAD- ELONGATION CURVE
SPECIMEN XD-B
CODE T-2
O-F , I O~. SHEAR
SWARTHMOFIE COLLEGE
1-10-50SWARTHMORE COLLEGE
l-a.51
.-. ,,,MAX, LOAD 336,000 LBS,
I
I \
300 ,
VIS. CRACK \] 2B9, W0 LB5
II
1250 \
r :
I
/1
200, -!I \I
. I ,
. I .
Y I I \[50 1! I 1 I I I I \l I
ENERGY TO VIS. CRACK 28,030 )N. LBS,
tENERGY TO M4X LOAD 78,000 IN, LBS, \ENERGY To FRACTURE 200,000 IN. LBS, I
I100I
1 I \
II
III FRACIUUE iI 83,000LB!., I
50 1
1I SPECIMEN 51ZE: I
I I“x 8“ x 12”I
1 I 1
I I I0
IJ .2 .3 .4 .5 .6 ,7 .8
ELONGATION IN IN LHES
FIG. III-39LOAD- ELONGATION CURVE
SPECIMEN XE - 6
CODE T-2
50” FJ 100% SHEAR
SWARTMMORE COLLEGE
1-.13-51
r I I I 1 1 1 I 1I I I I MAX. LOAD 354.100 LB% I
350 -
300
250
I
I —-’- “1 ,
II ,
200 —. . .— -.— ,.. . I
I I.. ; II
Ii I
150 —1; I.—
IENERGY To Vls. CRACK !7,0G0 IN, LHS
ENERGY TO MAX, LO*D
)80,M0 [N. LBS,
ENERGY TO FRACTUREII 4
(90 I
II
I ;1
II I
I ,50 1
SPECIMEN SIZE!’ ,I
I“x a“ x 12” II
I1
I I
n I 1 1
.1 .2 ,3 ,4
ELONGATION IN INCHES
FIG. IIL-40
LOAD-ELONGATION CURVE
SPECIMEN XE - 5
CODE T-2
-20° F O% SHEAR
SWARTHMORE COLLEGE
l-r3-50
_
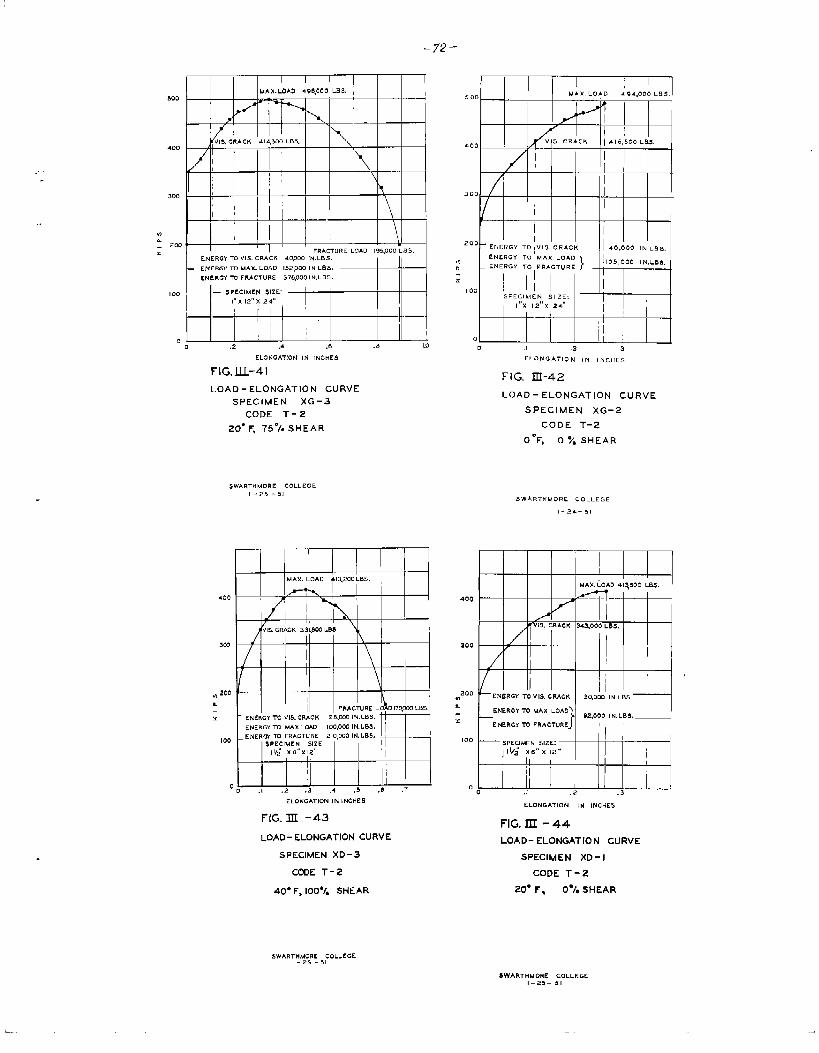
-72-
.
I I I
14AX.LOAD 49~000 LBS.500
/
VW,, CRACK d14300 LB5.400 /
I I /300
I
!,3
E 2ca\]
. I FRACTURE LO*D 195,000 L85,ENERGY TO V15, CRACK 4QOO0 lN. LB5. I I II
tENERGY TO MAX. LOAD 152,000 IN LB5.
ENERGY 75 FRACTURE 370,000 IN, LB5. ~I
100 SPECIMEN $12E:
I“X 12T’X 24,’
00 .2 .4 .6 .B 1.0
ELONGATION IN INCHES
FIG.111-41
LOAD-ELONGATION CURVE
SPECIMEN XG-3
CODE T- 2
20” ~ 75”/. SHEAR
SWAeTHMORE COLLEGE1-25 ’51
400
3m
MAX. LOAD .U3,200 L@S
k
~S, CRACK 33 l.~ LBS )
~
/ \
F& ACTURE LO D !70,0~ LBS
ENERGY TC VIS. CRACK 2B,CCC IN. LBS. IEtdERC~TO !4AX.LOAD 100,003lN.LBS.
100_ ENERGY TO FRACTURE .210,wo lN\LBs.
$PECIMEN SIZE,1~ XU’’XI2’
1I
00 .1 ,2 .3 ,4 ,5 .E .7
ELONGATION IN INCHES
FIG. III -43
LOAD-ELONGATION CURVE
SPECIMEN XD-3
CODE T-2
40” F,100”/. SHEAR
.—I I I
500 MA X. LOAD 494,000 L8S.
/ A
?
I
400[ 416, 500,0 s.
300
200 - ENERGY To, vls. cR4c K 40.000 IN LB3,
mL - :=: :::.:::: } !’05’000‘N:LB’G
,00 _l II I i
SPECIMEN SIZE,
I“x 12”X 24”
I I
o Io .1 .2 3
ELONGATION ,N ,NCHE5
FIG. ID-42
LOAD -E L0t4GAT10N CURVE
SPECIMEN XG-2
CODE T-2
O “F, O?o SHEAR
400
300
200L5
5WARTWMORE COLLEGE
1-24-s1
MAX, ~OAD 4 Iqsoo LB5.
r
—— .. .
ENERGY TO VIS. CRACK 30,0CQ IN.LBS.m
-1-- }1ENERGYTO MAX LOAD ~2000 ,NLB5,
xENERGY TO FRACTURE ‘1, I +4
100 —3PECIMEN ~,zE:lb; X6-X 12-
[! I
0 I0 .1 .2 ,3
FIG. 131-44
LOAD-ELONGATION CURVE
SPECIMEN xD-I
CODE T-2
20” F, O“feSHEAR
SWARTWMORE COLLEGL1-25– 51
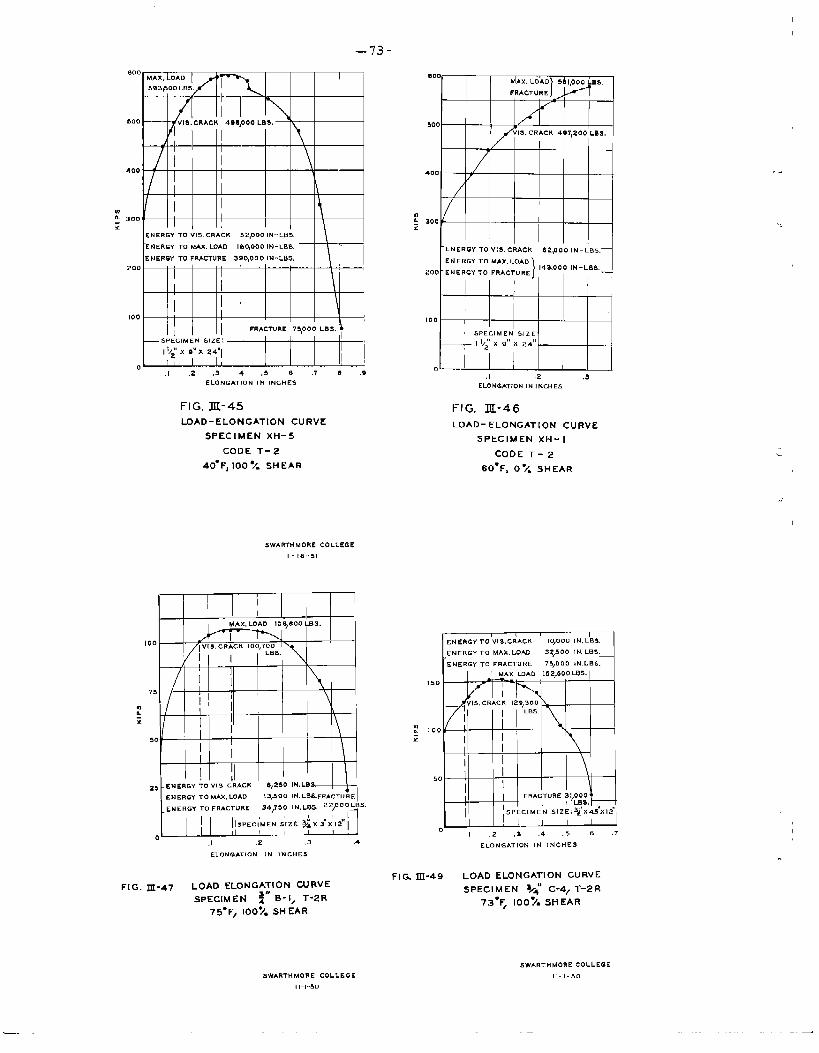
–73-
600
5Ei3p500 LBS.
500 — VIS. CRACK 40e, 000 LB s.
1!
I !400
[ I
1
m: 300 / \,
* IENERGY TO VIS. CRACK 52,0001 NULBS.
\ I‘ENERGY TO MAx. LOAD lao,ooolM-LBs.
ENERGY TO FRAcTUUE 300,000 lN-LB$.
200I
~ \ I
I ~100
I I FR4CTURE 75,000 LBS.
—SPECIMEN SIZE: I I II
lb; x 9“X 24”1I
o I 1 I
.l.2. ~4.5e .78.9ELONGATION IN INCHE$
FIG. IU-45
LOAD-ELONGATION CURVE
SPECIMEN XH-5
CODE T-2
40” FI 100”/- SHEAR
SWARTHMORE COLLEGE
1“18-51
MAx, LOAD 10e,aoo LBS.
100~lvIs, cRACK !00,700
I I ‘us”A
1
I i
75
m/
I ~ \&z
[ /
50
I ;
\
II
=$-ENERGY TO VIS cRACK 6,2S0 IN. LBSb
ENERGY TO MAX. LOAD 13,500 lN. LB$. FVACTU RE
34750 IN. LE.S, 22?00~Bs.ENERGY TO FRACTUFIE ,
I ISPEC(MEN SIZE >iX 3“~12”~
o,1 ,2 ,3 A
800
:1=--JdAX, LOAD 5~1,000 LBS.
FRACTURE
5001 VI S. CRACK 4 07,200 LBS,
400
/
/’
dE 300x
lEMRGYTQ”,S.CRACK,2,!300,H’B~,+ENERGY TO MAX, LOAD
200 ‘ENERGY TO FRACTURE)
143,000 IN– LB$,
100 .
SPECIMEN SIZE
I 1/~ X U“ X 24”
0,1 ,2 ,2!
ELOMGATION IN INCHES
FIG. III-46
LoAD-ELONGATION CURVE
SPECIMEN Xi+-l
CODE T- 2
60”F, o“~ SHEAR
1 i 1ENERGY TO vIs. CRACk 10,000 IN. LRS,
ENERGY TO MAX. LOAD 32,500 IN, LBS.
ENERGY TO FRACTURE 73,000 lN. LB$.
MAX. L9AD 152,500 L5s-
150
IVIS.. CR ACK 120,300 L
LBS.
100
I\
50
I /FRACTURE 3!/000 ~,
I LBS, —
I ;’SPECIMEN $lZE:3~X4~’Xl? “
I I0
.Z .3 .4 .5 6 7
ELONGATION IN INCHES
.-
...
ELONGATION IN INCHES
FIG. lJ1-47 LOAD ELONGATION CURVE
SPECIMEN ;“ B-1, T“2R75*F, 100% SH EAR
FIG. 111-49 LOAD ELONGATION CURVESPECIMEN 3/; C-4{ T-2R
73”~ 100% SHEAR
sWARTHMORE COLLEGE
1!–!-50
SW& RTHMORE COLLEGE
11-1”50
— —.-J
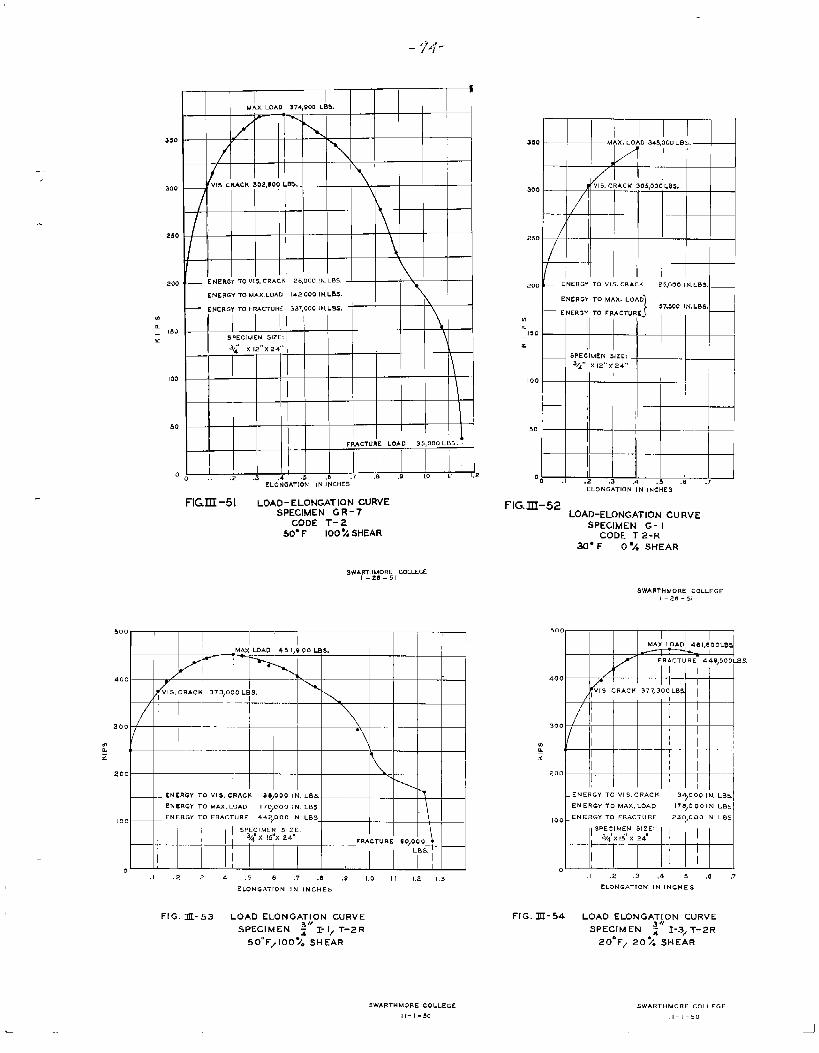
-74<
350
300
250
200
m
100
0
I
MAX. LOAD 37d,9~ LB%
1- \ –. .
—
Vls. L RACK 302#ao0 L=.
I
/ r
—
— ENERGY TO Vl$, CRACK 25000 lN.LB5-
ENERGY TO MhX. LOAD 142000 lN.LB5- \
ENERGY TO FRACTURE 337.000 lWLBS.
SPECIMEN $IZE:
~i’ x 12’”%24”’\,
1
\
FRACTURE LOAD 35,000 LBS, I
I
0 .1 .2 .3 ,6 .7 ..9 .U 1.0 l.] 1.2ELtiiGATl Oi IN INCHES
FIGIII-51 LOAD-ELONGATION CURVESPECIMEN GR-7
CODE T-250= F IOO%SHEAR
‘r~- —350 MA X, LOAD 345,000 LB5,
*
d 1“
300 -~ Vls, c RACK 305,000 LBs.
I.. . .
—
250 1 /J
-1
200 ENERGY TO V15. CRACti 25.000 lN. LBS. _
}ENERGY TO MAX, LOAD
57,500 IN. LBS,— ENERGY TO FF4CTURE
mm._150
t
-—
x
SPECIMEN SIZE, . .3/4” x 12,,’f24-
100 ..
-.
30 ..-. —
00 .1 .2 .3 ,4 .5 ,6 .,ELONGATION IN INCHES
FIG. IU-52LOAD-ELONGATION CURVE
SPECIMEN G- ICODE T2. R
30” F 0“4 SHEAR
SWARTHMORE COLLEGE1-.?.3 -51
‘“”m+=l+fffflI l#vls. cRAcK 373,090L;s.
. . .
-%.
400 I AY
II -?—++
D ~.’‘:>7 ~
........-”.LA.....- ...
300 .!r.— . .- .-*L —.-. ...”- — ...-:
200
~ENERGYTOV[3, &RACK 38,0001 N, L8s,
L iEi-4ERcyTOwAx, LoAD
100 ‘70;00”’N”LB’u.....uLLENERGY To FRACTURE 442,000 IN. LBs
I SPECIMEN SIZE.3/~X 15”X 24”
II— .;---- I FRACTUe E 50,0001 J __
LB$, ]
I I
oI
1 .2 3 .4 .5 e .7 .8 ,9 1,0 II 1,2 1.3
ELONGATION IN INCHES
FIG. IIL-53 LOAD ELONGATION CURVE
SPECIMEN ~ I-1, T-2R
50mF/100>e SHEAR
500I I
MAx LOAD 4e!,000LB5m-
FRAGTURE 440,500 LBS
d c .1—L!400
,VIS CPACK 377,300LBs I
I1
I ;
300 1 I.m; r—
------ -.-..-–..+
I
~. .
I200 J
1“ I1
.,1 .2 ,3 ,4 5 ,0 ,7
ELONG4TION IN INCHES
FIG. IJI-54 LOAD ELONGA;j,ON CURVE
SPECIMEN z T-3, T-2R
20” F, 20>. SHEAR
5W4FTHMORE COLLEGE
11-1-50
SWARTHMORE COLLEGE
11-[–50
..J


![Anb Manual[RUS]](https://img.pdfslide.us/doc/110x75/55cf9063550346703ba56e34/anb-manualrus.jpg)