Embed Size (px)
Citation preview

1
How much biomass do we have? – Is UK supply from Miscanthus water-limited?
www.tsec-biosys.ac.uk
Dr. Goetz M RichterRothamsted Research
Biomass role in the UK energy futures The Royal Society, London: 28th & 29th July 2009
TSEC BiosysTSEC Biosys
TSEC BiosysTSEC Biosys
TSEC BiosysTSEC Biosys
TSEC BiosysTSEC BiosysContents
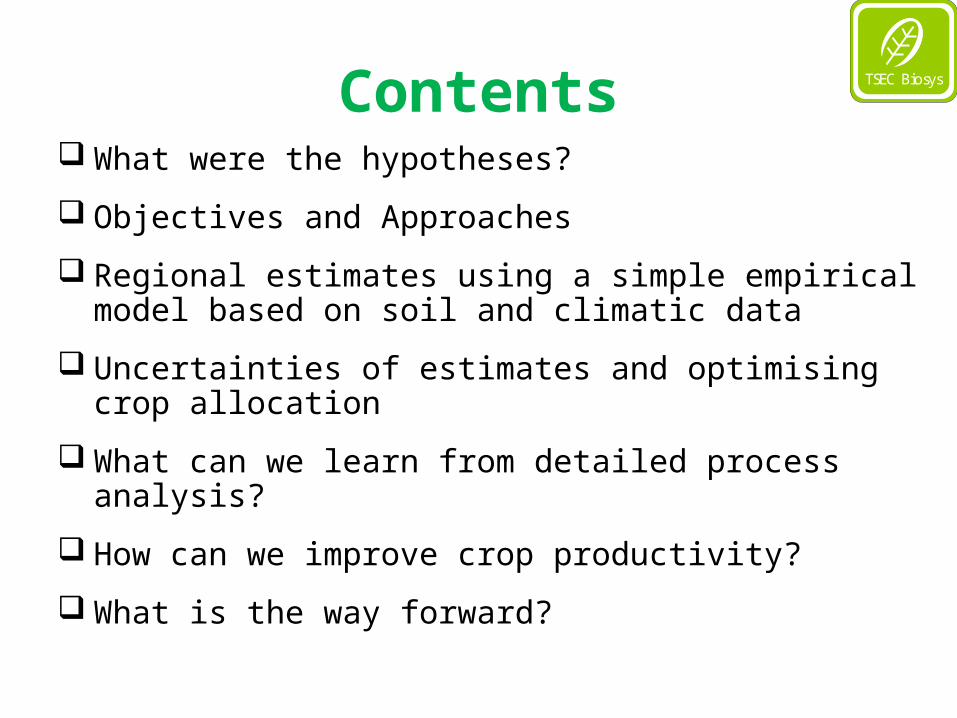
What were the hypotheses?
Objectives and Approaches
Regional estimates using a simple empirical model based on soil and climatic data
Uncertainties of estimates and optimising crop allocation
What can we learn from detailed process analysis?
How can we improve crop productivity?
What is the way forward?
TSEC BiosysTSEC Biosys
TSEC BiosysTSEC BiosysWhat were the hypotheses?
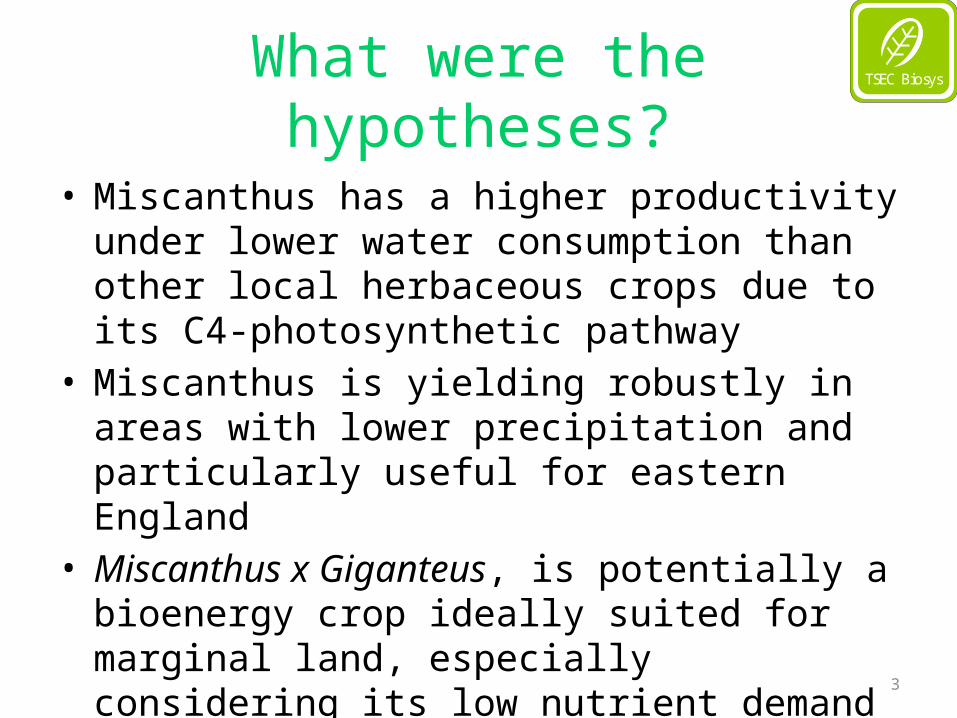
• Miscanthus has a higher productivity under lower water consumption than other local herbaceous crops due to its C4-photosynthetic pathway
• Miscanthus is yielding robustly in areas with lower precipitation and particularly useful for eastern England
• Miscanthus x Giganteus, is potentially a bioenergy crop ideally suited for marginal land, especially considering its low nutrient demand
3
TSEC BiosysTSEC Biosys
TSEC BiosysTSEC BiosysObjectives and approaches
Objective 1: Quantify yield effect of soil and agro-meteorological variables
Approach • Evaluate harvestable Miscanthus yields (litter-free, 15 Feb; 3+
year) from local long-term experiment and a UK-wide series of experiments
• Derive a universal empirical model for UK conditions• Up-scale empirical model to the agricultural landscape (yield
maps) using spatially distributed input data (soil, weather)
4
TSEC BiosysTSEC Biosys
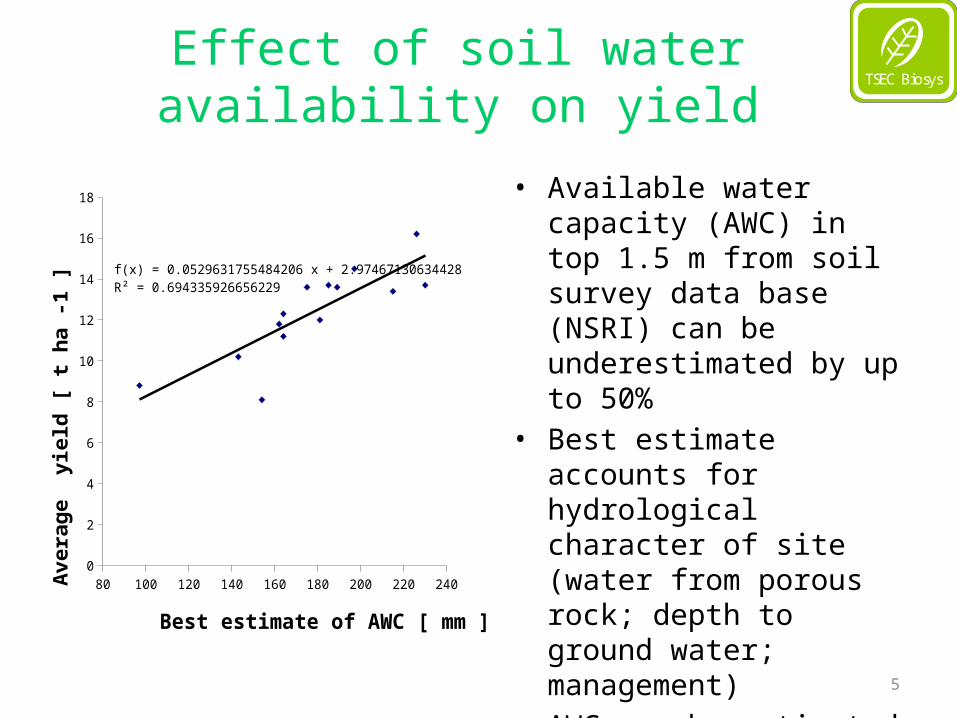
TSEC BiosysTSEC BiosysEffect of soil water availability on yield
• Available water capacity (AWC) in top 1.5 m from soil survey data base (NSRI) can be underestimated by up to 50%
• Best estimate accounts for hydrological character of site (water from porous rock; depth to ground water; management)
• AWC can be estimated using pedotransfer functions and applying first principles
5
80 100 120 140 160 180 200 220 2400
2
4
6
8
10
12
14
16
18
f(x) = 0.0529631755484206 x + 2.97467130634428R² = 0.694335926656229
Best estimate of AWC [ mm ]
Aver
age
yie
ld [
t ha
-1 ]
TSEC BiosysTSEC Biosys
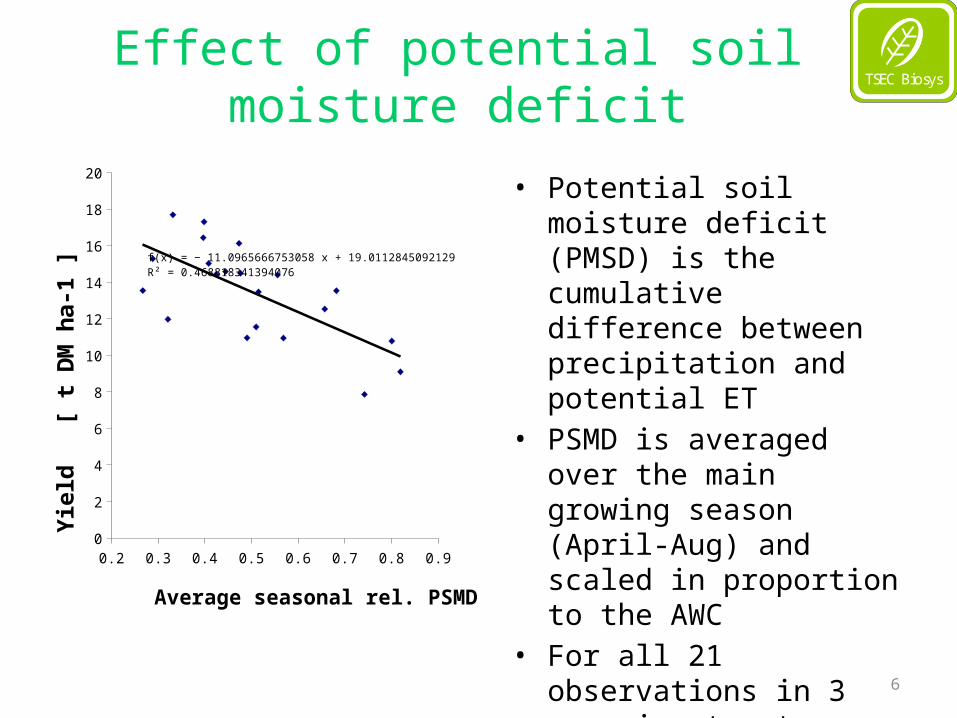
TSEC BiosysTSEC BiosysEffect of potential soil moisture deficit
• Potential soil moisture deficit (PMSD) is the cumulative difference between precipitation and potential ET
• PSMD is averaged over the main growing season (April-Aug) and scaled in proportion to the AWC
• For all 21 observations in 3 experiments at Rothamsted rPSMD explained about 50% of the observed yield variability
6
0.2 0.3 0.4 0.5 0.6 0.7 0.8 0.90
2
4
6
8
10
12
14
16
18
20
f(x) = − 11.0965666753058 x + 19.0112845092129R² = 0.468818341394072
Average seasonal rel. PSMD
Yiel
d [
t D
M h
a-1
]
TSEC BiosysTSEC Biosys
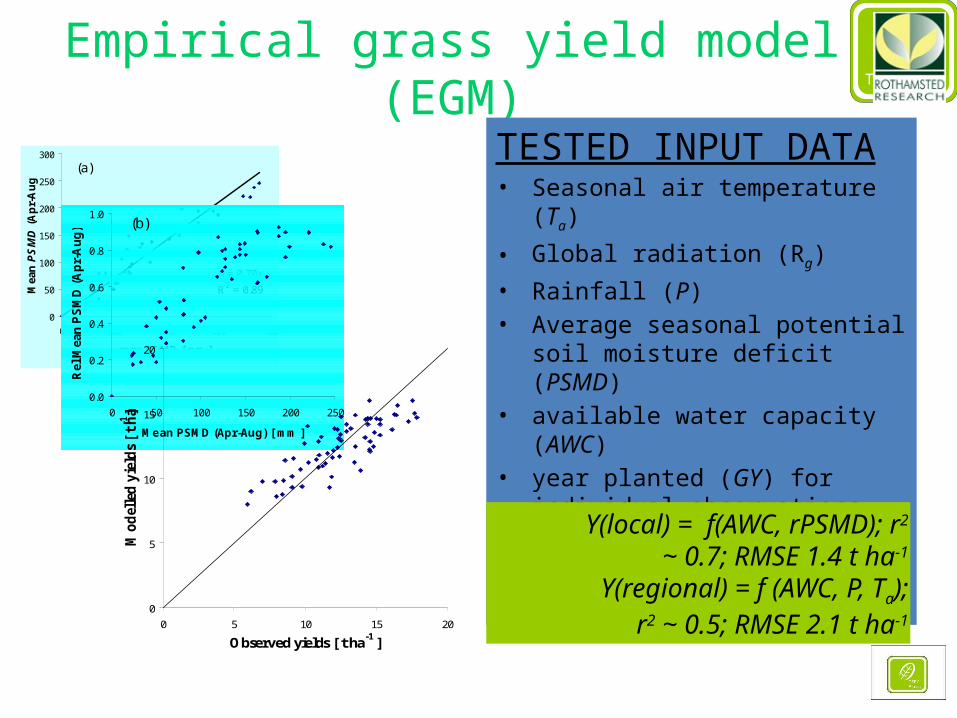
TSEC BiosysTSEC BiosysEmpirical grass yield model (EGM)
TESTED INPUT DATA• Seasonal air temperature (Ta)
• Global radiation (Rg)• Rainfall (P)• Average seasonal potential soil
moisture deficit (PSMD) • available water capacity (AWC)• year planted (GY) for individual
observations (year, a, location, l)
FINAL MODELY(local) = f(AWC, rPSMD);
r2 ~ 0.7; RMSE 1.4 t ha-1
Y(regional) = f (AWC, P, Ta); r2 ~ 0.5; RMSE 2.1 t ha-1
(a)
y = 0.70x
R2 = 0.89
0
50
100
150
200
250
300
0 100 200 300 400
max PSMD [ mm ]
Mea
n P
SM
D (
Ap
r-A
ug
)
(b)
0.0
0.2
0.4
0.6
0.8
1.0
0 50 100 150 200 250
Mean PSMD (Apr-Aug) [ mm ]
Rel
Mea
n P
SM
D (
Ap
r-A
ug
)
0
5
10
15
20
0 5 10 15 20
Observed yields [ t ha-1 ]
Mo
del
led
yie
lds
[ t
ha
-1 ]
TSEC BiosysTSEC Biosys
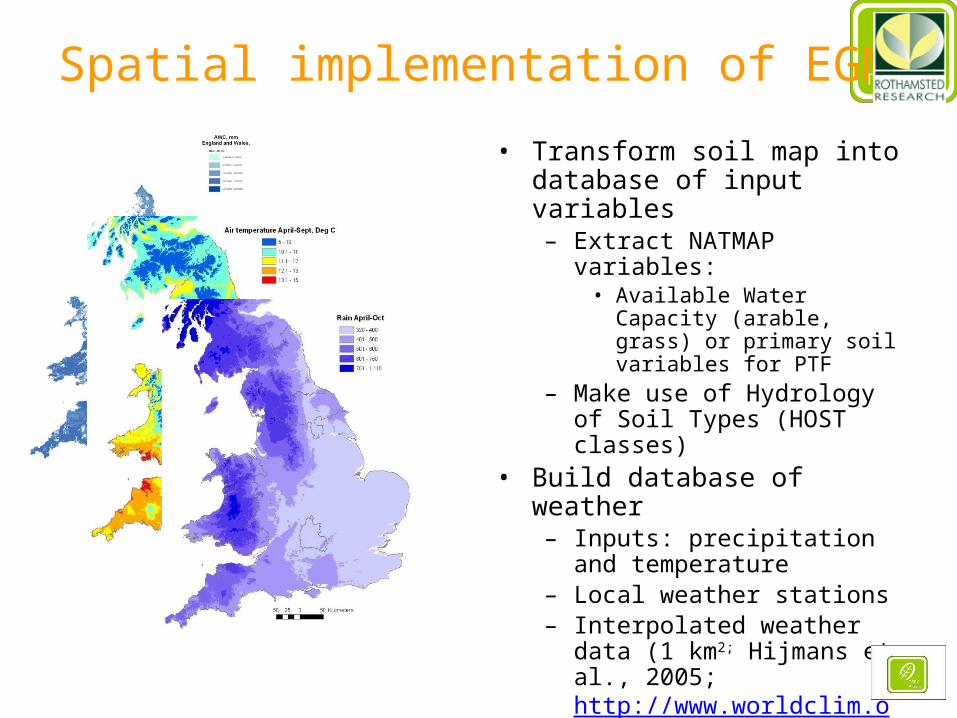
TSEC BiosysTSEC BiosysSpatial implementation of EGM
• Transform soil map into database of input variables– Extract NATMAP variables:
• Available Water Capacity (arable, grass) or primary soil variables for PTF
– Make use of Hydrology of Soil Types (HOST classes)
• Build database of weather– Inputs: precipitation and
temperature – Local weather stations– Interpolated weather data (1
km2; Hijmans et al., 2005; http://www.worldclim.org
TSEC BiosysTSEC Biosys
TSEC BiosysTSEC BiosysRevisiting the soil input data (AWC_PTF)
• Expanded HYPRES pedotransfer function (Woesten et al., 1999) to E&W• Estimated AWC (PTF) from soil texture, bulk density and organic matter• Set of rules considered four different soil groups:
– non-gley shallow soil overlying porous rock and other non-gleysol, and – deep gleysol and shallow gleysol above hard rock and sediments.
• AWC is water retention between FC and WP (-1500 kPa), water at FC was estimated at -10kPa for gleysols, and -33 kPa for any other soil
• For shallow soils over porous rock water was approximated for those soils classified as HOST classes 1 to 3 (Boorman et al., 1995) – AWC of porous rock was assumed to be between 10 vol% (chalk) and – 5 vol% (oolitic limestone, sandstone), estimated for the layers
exceeding depth of rock to the maximum profile depth.
9
TSEC BiosysTSEC Biosys
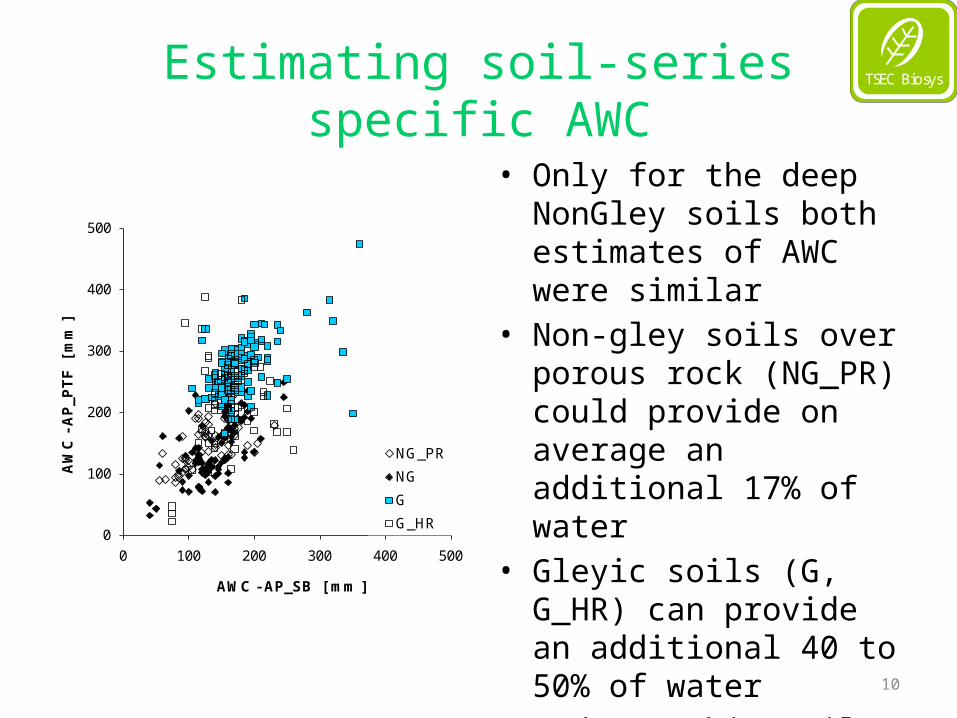
TSEC BiosysTSEC BiosysEstimating soil-series specific AWC
• Only for the deep NonGley soils both estimates of AWC were similar
• Non-gley soils over porous rock (NG_PR) could provide on average an additional 17% of water
• Gleyic soils (G, G_HR) can provide an additional 40 to 50% of water
• Hydromorphic soils cover large areas of the UK
10
0
100
200
300
400
500
0 100 200 300 400 500
AW
C -
AP
_PT
F
[ m
m ]
AWC - AP_SB [ mm ]
NG_PR
NG
G
G_HR
TSEC BiosysTSEC Biosys
TSEC BiosysTSEC Biosys
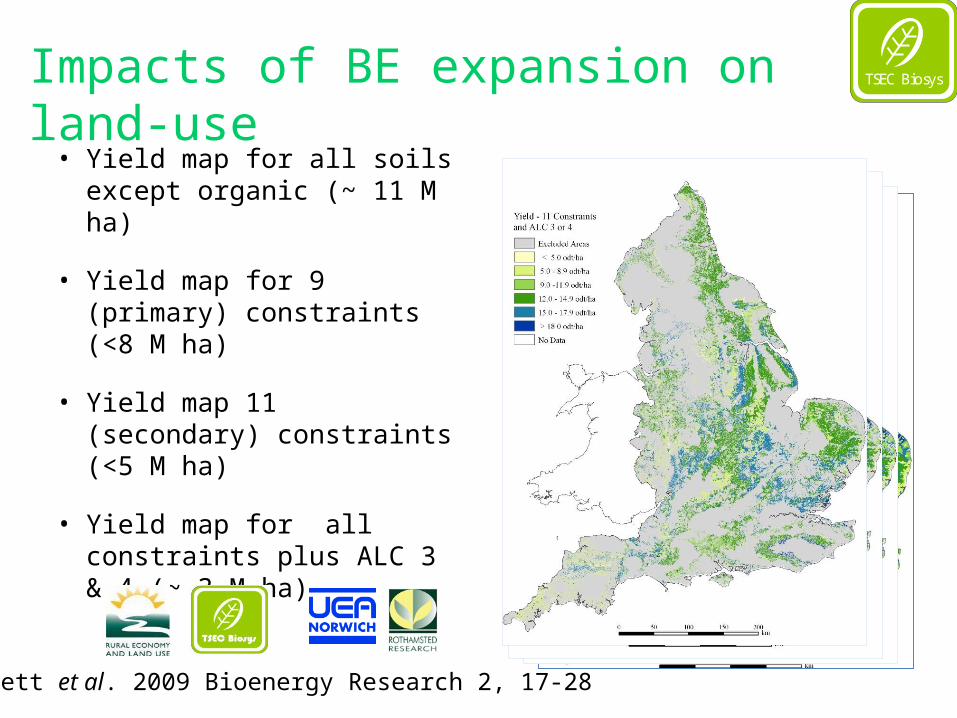
• Yield map for all soils except organic (~ 11 M ha)
• Yield map for 9 (primary) constraints (<8 M ha)
• Yield map 11 (secondary) constraints (<5 M ha)
• Yield map for all constraints plus ALC 3 & 4 (~ 3 M ha)
Lovett et al. 2009 Bioenergy Research 2, 17-28
Impacts of BE expansion on land-use
TSEC BiosysTSEC Biosys
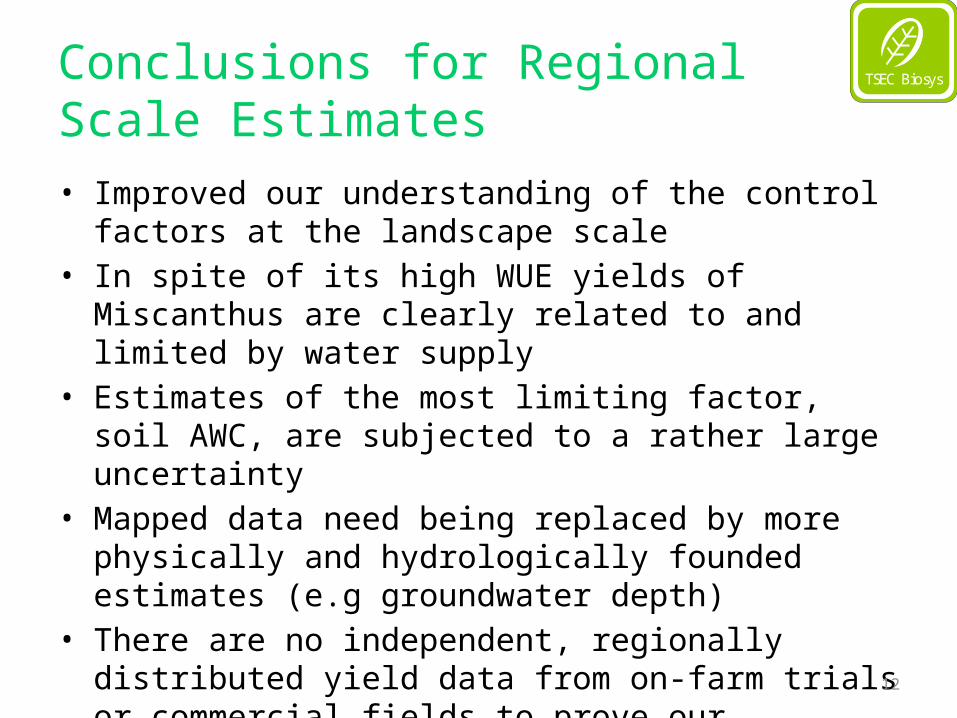
TSEC BiosysTSEC BiosysConclusions for Regional Scale Estimates
• Improved our understanding of the control factors at the landscape scale
• In spite of its high WUE yields of Miscanthus are clearly related to and limited by water supply
• Estimates of the most limiting factor, soil AWC, are subjected to a rather large uncertainty
• Mapped data need being replaced by more physically and hydrologically founded estimates (e.g groundwater depth)
• There are no independent, regionally distributed yield data from on-farm trials or commercial fields to prove our estimates
12
TSEC BiosysTSEC Biosys
TSEC BiosysTSEC BiosysObjectives and approaches
Objective 2: Adapt a process-based crop growth model describing above / belowground carbon partitioning and yield
Approach:• Parameterise model from literature and calibrate using initial
growth curves from a local long-term experiment• Conduct a sensitivity analysis to identify most growth limiting
parameters• Evaluate model using various indicators 14 years of the same
experiment
13
TSEC BiosysTSEC Biosys
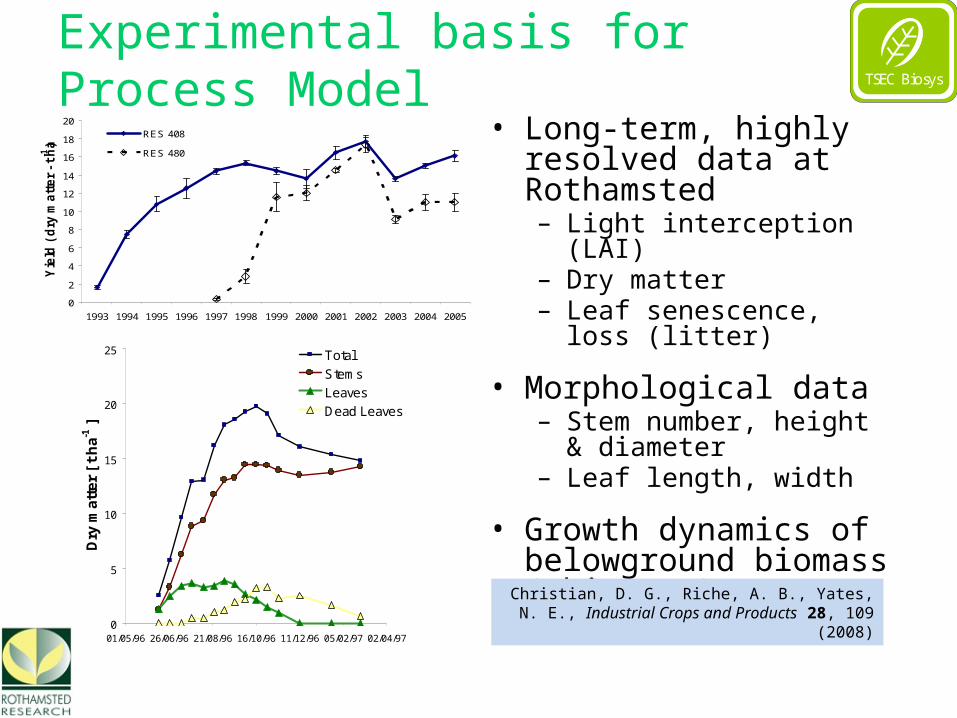
TSEC BiosysTSEC BiosysExperimental basis for Process Model
• Long-term, highly resolved data at Rothamsted– Light interception (LAI)– Dry matter – Leaf senescence, loss (litter)
• Morphological data – Stem number, height &
diameter– Leaf length, width
• Growth dynamics of belowground biomass (rhizomes)
0
5
10
15
20
25
01/05/96 26/06/96 21/08/96 16/10/96 11/12/96 05/02/97 02/04/97
Dry
ma
tte
r [
t h
a-1 ]
Total
Stems
Leaves
Dead Leaves
0
2
4
6
8
10
12
14
16
18
20
1993 1994 1995 1996 1997 1998 1999 2000 2001 2002 2003 2004 2005
Yie
ld (
dry
ma
tte
r -
t h
a-1
)
RES 408
RES 480
Christian, D. G., Riche, A. B., Yates, N. E., Industrial Crops and Products 28, 109 (2008)
TSEC BiosysTSEC Biosys
TSEC BiosysTSEC Biosys
kfrost
Carbohydrates
Reserves10-20%
StemsDensity (n),
Ht, Wt
RhizomesRGR(T), SRWT,
[RhDR(t)]
fT(A)
rad,
P, T,..
θfc, θpw, depth, ...
crf
fsht
cL/P
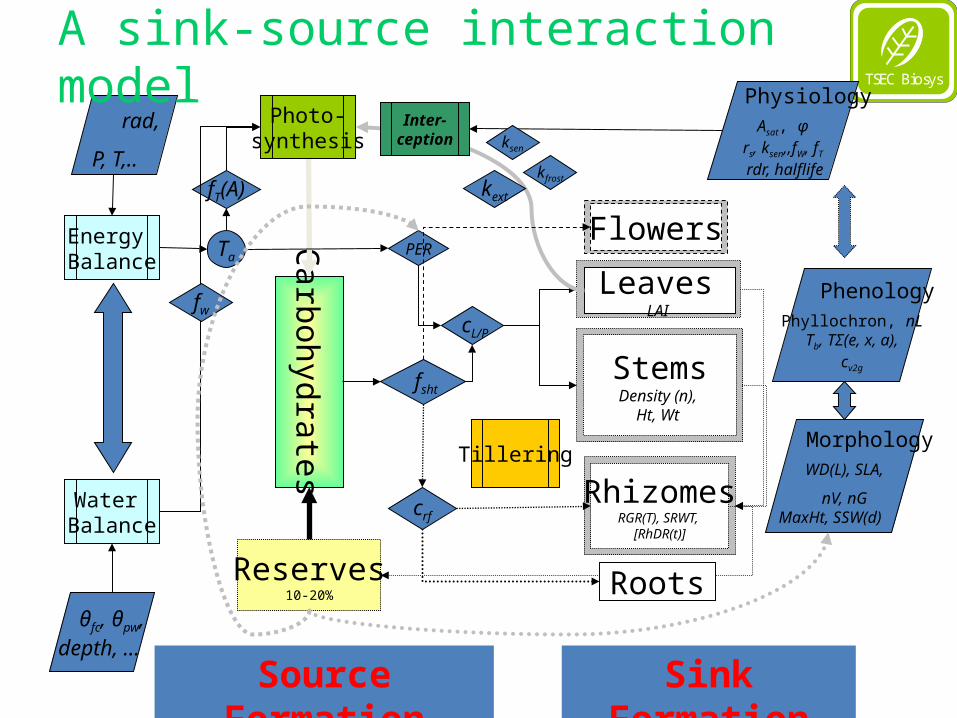
Source Formation Sink Formation
MorphologyWD(L), SLA,
nV, nGMaxHt, SSW(d)
PER
Photo-synthesis
Flowers
fw PhenologyPhyllochron, nLTb, TΣ(e, x, a),
cv2g
Energy Balance
Water Balance
Ta
Leaves
LAI
Inter-ception
kext
Roots
PhysiologyAsat, φ
rs, ksen,,fW, fT
rdr, halflife
ksen
A sink-source interaction model
Tillering
TSEC BiosysTSEC Biosys
TSEC BiosysTSEC Biosys
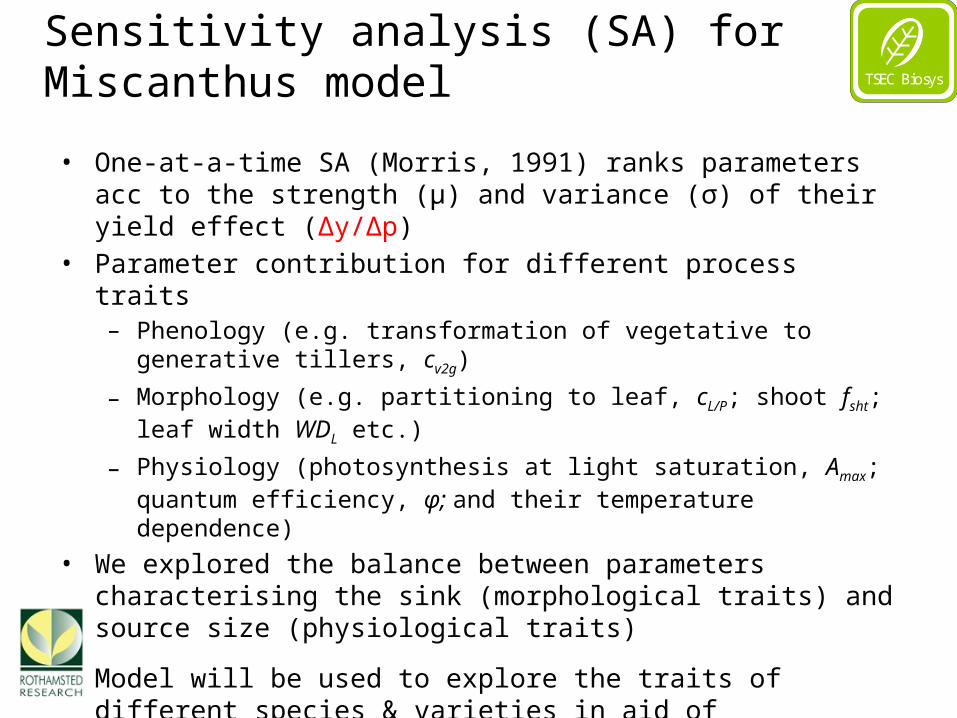
Sensitivity analysis (SA) for Miscanthus model
• One-at-a-time SA (Morris, 1991) ranks parameters acc to the strength (μ) and variance (σ) of their yield effect (Δy/Δp)
• Parameter contribution for different process traits – Phenology (e.g. transformation of vegetative to generative tillers, cv2g)
– Morphology (e.g. partitioning to leaf, cL/P; shoot fsht; leaf width WDL etc.)
– Physiology (photosynthesis at light saturation, Amax; quantum efficiency, φ; and their temperature dependence)
• We explored the balance between parameters characterising the sink (morphological traits) and source size (physiological traits)
• Model will be used to explore the traits of different species & varieties in aid of identifying optimal grass ideotypes
TSEC BiosysTSEC Biosys
TSEC BiosysTSEC Biosys
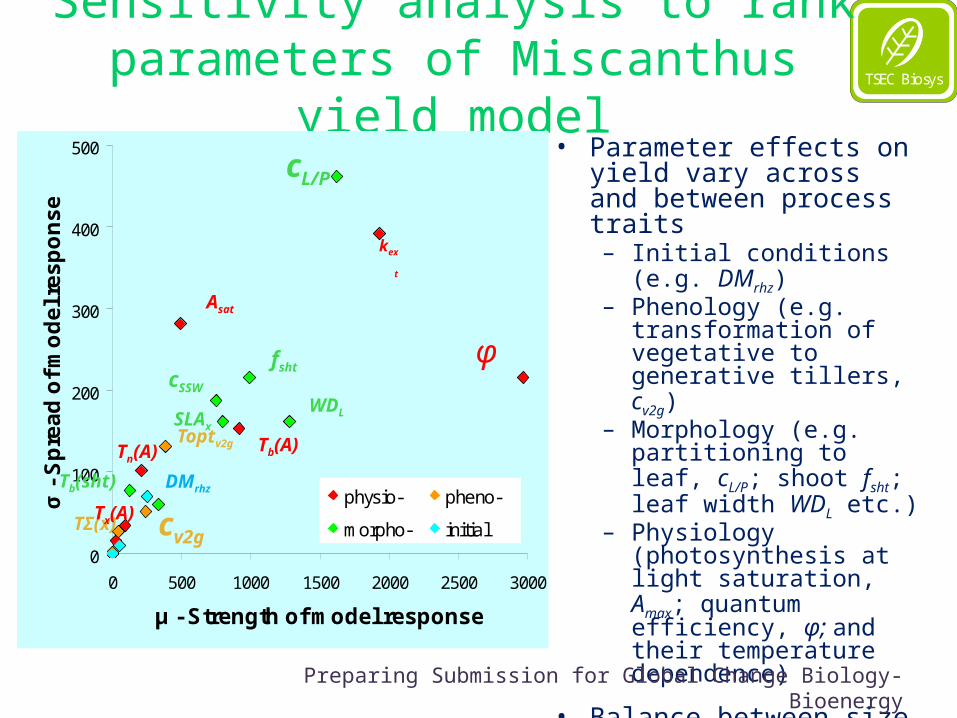
Sensitivity analysis to rank parameters of Miscanthus yield model
0
100
200
300
400
500
0 500 1000 1500 2000 2500 3000
μ - Strength of model response
σ -
Sp
rea
d o
f m
od
el r
es
po
ns
e
physio- pheno-
morpho- initial
• Parameter effects on yield vary across and between process traits – Initial conditions (e.g. DMrhz)– Phenology (e.g.
transformation of vegetative to generative tillers, cv2g)
– Morphology (e.g. partitioning to leaf, cL/P; shoot fsht; leaf width WDL etc.)
– Physiology (photosynthesis at light saturation, Amax; quantum efficiency, φ; and their temperature dependence)
• Balance between size of sinks and sources (morphological and physiological traits) is dynamic
cv2g
Toptv2g
TΣ(x)
φ
kext
Tb(A)
Asat
Tn(A)
Tx(A)
WDL
cL/P
fsht
SLAx
cSSW
Tb(sht) DMrhz
Preparing Submission for Global Change Biology- Bioenergy
TSEC BiosysTSEC Biosys
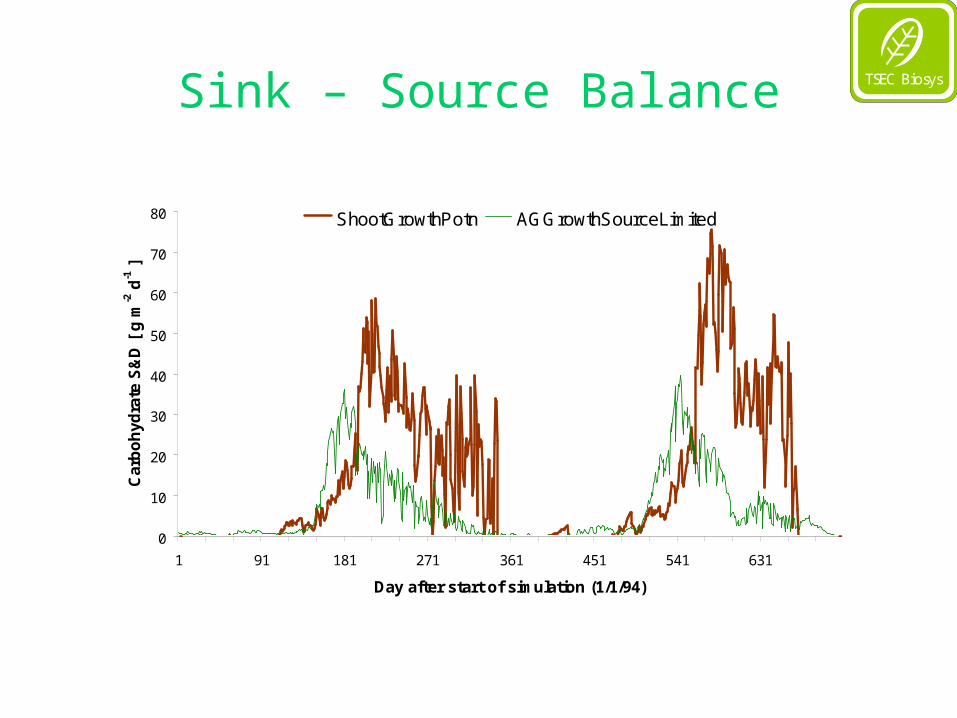
TSEC BiosysTSEC BiosysSink – Source Balance
0
10
20
30
40
50
60
70
80
1 91 181 271 361 451 541 631
Day after start of simulation (1/1/94)
Car
bo
hyd
rate
S&
D [
g m
-2 d
-1 ]
ShootGrowthPotn AGGrowthSourceLimited
TSEC BiosysTSEC Biosys
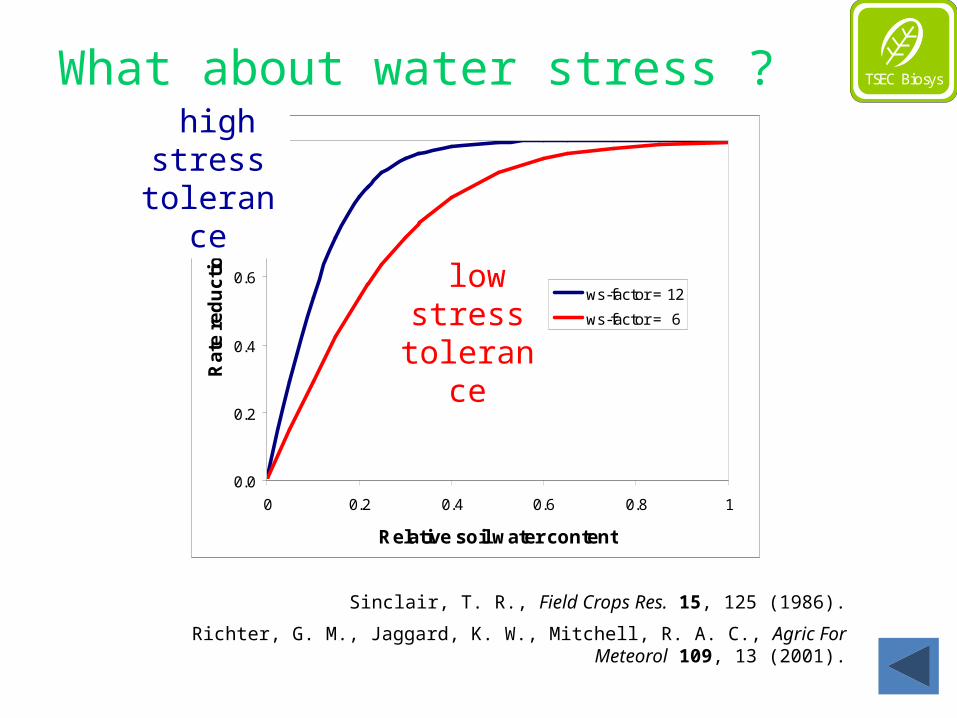
TSEC BiosysTSEC BiosysWhat about water stress ?
0.0
0.2
0.4
0.6
0.8
1.0
0 0.2 0.4 0.6 0.8 1
Relative soil water content
Ra
te r
ed
uc
tio
n
ws-factor = 12
ws-factor = 6
kws = 2 / ( 1 + exp (-Ws-factor * relSWC))
low stress tolerance
high stress tolerance
Sinclair, T. R., Field Crops Res. 15, 125 (1986).
Richter, G. M., Jaggard, K. W., Mitchell, R. A. C., Agric For Meteorol 109, 13 (2001).
TSEC BiosysTSEC Biosys
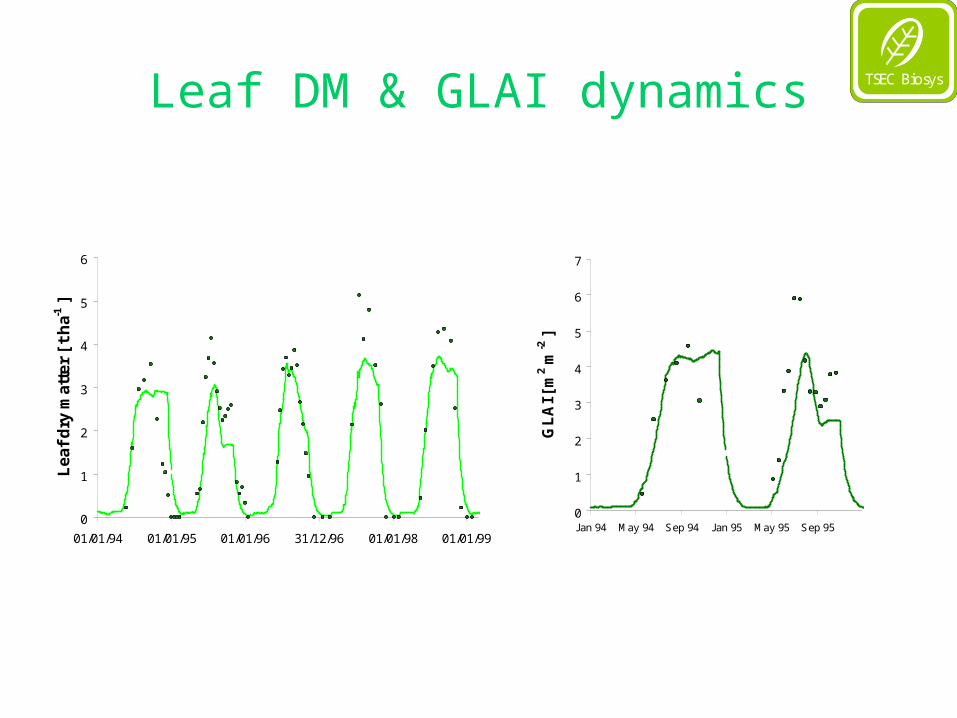
TSEC BiosysTSEC BiosysLeaf DM & GLAI dynamics
0
1
2
3
4
5
6
01/01/94 01/01/95 01/01/96 31/12/96 01/01/98 01/01/99
Le
af
dry
ma
tte
r [
t h
a-1 ]
0
1
2
3
4
5
6
7
Jan 94 May 94 Sep 94 Jan 95 May 95 Sep 95
GL
AI [
m2 m
-2 ]
TSEC BiosysTSEC Biosys
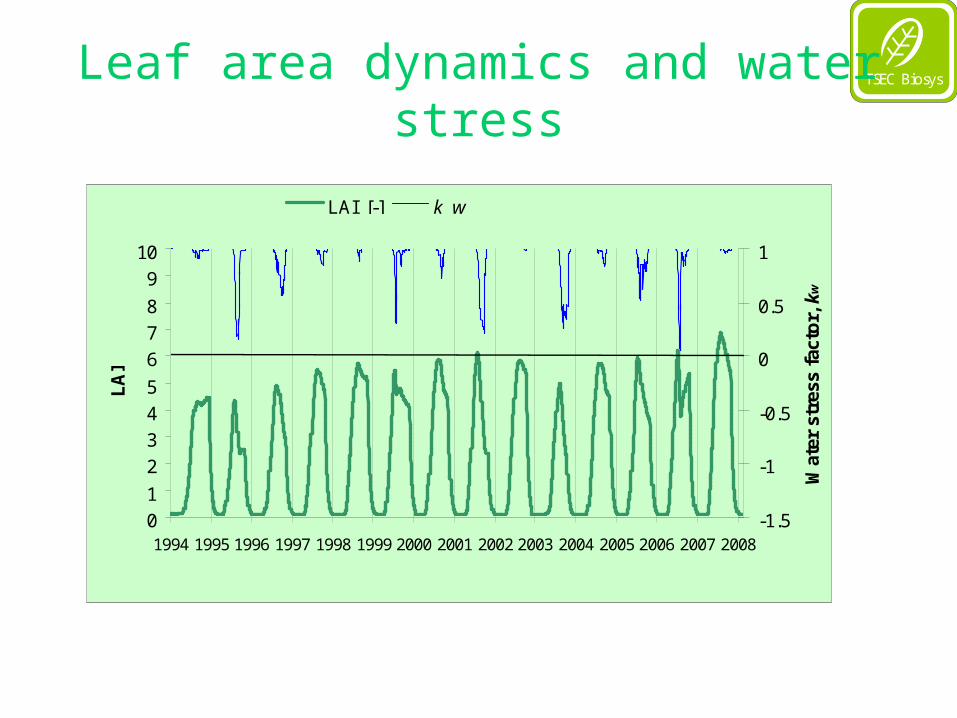
TSEC BiosysTSEC BiosysLeaf area dynamics and water stress
0
1
2
3
4
5
6
7
8
9
10
1994 1995 1996 1997 1998 1999 2000 2001 2002 2003 2004 2005 2006 2007 2008
LA
I
-1.5
-1
-0.5
0
0.5
1
Wat
er s
tres
s fa
cto
r, kw
LAI [-] k_w
TSEC BiosysTSEC Biosys
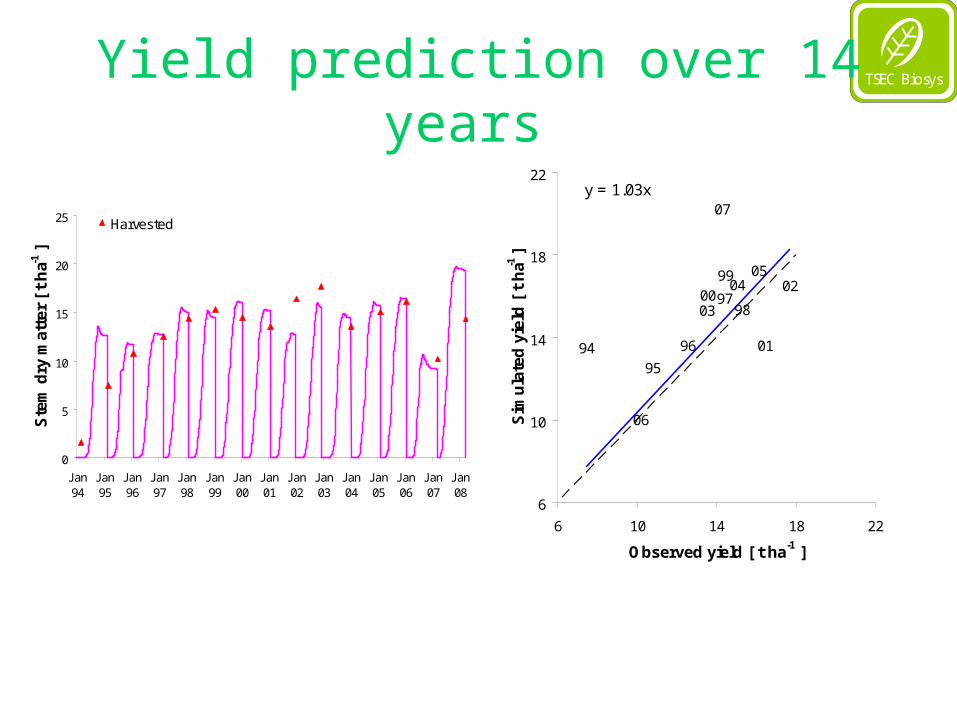
TSEC BiosysTSEC BiosysYield prediction over 14 years
9495
96
9798
9900
01
02
03
0405
06
07y = 1.03x
6
10
14
18
22
6 10 14 18 22
Observed yield [ t ha-1 ]
Sim
ula
ted
yie
ld [
t h
a-1 ]
0
5
10
15
20
25
Jan94
Jan95
Jan96
Jan97
Jan98
Jan99
Jan00
Jan01
Jan02
Jan03
Jan04
Jan05
Jan06
Jan07
Jan08
Ste
m d
ry m
att
er
[ t
ha-1
]
Harvested
TSEC BiosysTSEC Biosys
TSEC BiosysTSEC Biosys
Conclusions for process-based model
• A generic grass model was successfully adopted to simulate dry matter production of Miscanthus x giganteus– Identified important morphological traits– Calibrated & evaluated for one site, one variety– Ranked parameter using OAT sensitivity analysis– Explored sink-source balance, tillering dynamics
• Future applications of this model are needed– For different species & varieties to identify optimal grass
ideotypes – In different environments (G x E interaction)
TSEC BiosysTSEC Biosys
TSEC BiosysTSEC BiosysFinally – where do we go from here?
• We need feedback from the growers!• We need strengthening of the agronomy of these
crops, SRC and Miscanthus• Regionally distributed on-farm trials and
demonstrations on different soil types are needed• Research needs focus to improve our understanding
(e.g. water use) and the varieties to be grown• Get on with the work!
24
TSEC BiosysTSEC Biosys
TSEC BiosysTSEC Biosys
25
Thank you for your attention!
TSEC BiosysTSEC Biosys
TSEC BiosysTSEC Biosys
www.tsec-biosys.ac.uk