Embed Size (px)
Citation preview

1
High-Cell-Density Cultivations to Increase MVA Virus Production 1
Daniel Vázquez-Ramírez1*, Yvonne Genzel1, Ingo Jordan 2,3, Volker Sandig 2, Udo 2
Reichl1,4 3
1Max Planck Institute for Dynamics of Complex Technical Systems, Sandtorstr. 1, 4
39106, Magdeburg, Germany 5
2ProBioGen AG, Goethestr. 54, 13086 Berlin, Germany 6
3Current address: CureVac AG, Paul-Ehrlich-Str. 15, 72076 Tübingen, Germany 7
4Chair for Bioprocess Engineering, Otto-von-Guericke-University Magdeburg, 8
Universitätsplatz 2, 39106 Magdeburg, Germany 9
*Corresponding author 10
Email address: [email protected] 11
Keywords: viral vaccine production; process intensification; ATF; bioreactor; perfusion; 12
fed-batch; scale-down. 13
14
15
*Manuscript revision 3Click here to view linked References

2
Abstract 16
Increasing the yield and the productivity in cell culture-based vaccine manufacturing using high-cell-17 density (HCD) cultivations faces a number of challenges. For example, medium consumption should be 18 low to obtain a very high concentration of viable host cells in an economical way but must be balanced 19 against the requirement that accumulation of toxic metabolites and limitation of nutrients have to be 20 avoided. HCD cultivations should also be optimized to avoid unwanted induction of apoptosis or 21 autophagy during the early phase of virus infection. To realize the full potential of HCD cultivations, a 22 rational analysis of the cultivation conditions of the appropriate host cell line together with the optimal 23 infection conditions for the chosen viral vaccine strain needs to be performed for each particular 24 manufacturing process. 25
We here illustrate our strategy for production of the modified vaccinia Ankara (MVA) virus isolate MVA-26 CR19 in the avian suspension cell line AGE1.CR.pIX at HCD. As a first step we demonstrate that the 27 adjustment of the perfusion rate strictly based on the measured cell concentration and the glucose 28 consumption rate of cells enables optimal growth in a 0.8 L bioreactor equipped with an ATF2 system. 29 Concentrations up to 57 × 106 cells/mL (before infection) were obtained with a viability exceeding 95%, 30 and a maximum specific cell growth rate of 0.019 h-1 (doubling time = 36.5 h). However, not only the cell-31 specific MVA-CR19 virus yield but also the volumetric productivity was reduced compared to infections at 32 conventional-cell-density (CCD). 33
To facilitate optimization of the virus propagation phase at HCD, a larger set of feeding strategies was 34 analyzed in small-scale cultivations using shake flasks. Densities up to 63 × 106 cells/mL were obtained at 35 the end of the cell growth phase applying a discontinuous perfusion mode (semi-perfusion) with the same 36 cell-specific perfusion rate as in the bioreactor (0.060 nL/(cell d)). At this cell concentration, a medium 37 exchange at time of infection was required to obtain expected virus yields during the first 24 h after 38 infection. Applying an additional fed-batch feeding strategy during the whole virus replication phase 39 resulted in a faster virus titer increase during the first 36 h after infection. In contrast, a semi-continuous 40 virus harvest scheme improved virus accumulation and recovery at a rather later stage of infection. 41 Overall, a combination of both fed-batch and medium exchange strategies resulted in similar cell-specific 42 virus yields as those obtained for CCD processes but 10-fold higher MVA-CR19 titers, and four times 43 higher volumetric productivity. 44
45
46

3
Introduction 47
Modern recombinant vector vaccines combine the advantages of an attenuated or even host-restricted 48 infection with a highly immunogenic expression of an antigen of choice. Especially promising vectors are 49 highly attenuated poxviruses, including modified vaccinia virus Ankara (MVA) [1]. MVA has been 50 attenuated by repeated passaging in chicken fibroblast cultures [2], and its properties as potential human 51 vector vaccine have been well characterized [1, 3-11]. Various MVA recombinants that express different 52 viral heterologous antigens have been generated and extensively tested in pre-clinical and clinical trials as 53 candidate vaccine against diseases such as AIDS, influenza, severe acute respiratory syndrome (SARS) 54 and human respiratory syncytial virus (RSV) infection [7, 9-11]. The use of MVA as a vector-based 55 vaccine, however, is predicted to require highly concentrated doses of about 108 infectious units (IU) per 56 mL [1, 6], preferably produced in media free of animal-derived components. 57
MVA (similar to other viruses such as influenza A virus or yellow fever virus) is being produced in material 58 obtained from embryonated chicken eggs or primary chicken embryo fibroblasts (CEF) [8]. However, the 59 use of primary animal-derived material that is continuously fed into vaccine production processes is not an 60 optimal scenario. To overcome this problem, two fully permissive avian suspension cell lines, AGE1.CR 61 (in the following CR) and AGE1.CR.pIX (in the following CR.pIX) were developed [12] and adapted to 62 proliferation in a chemically defined medium to enable the establishment of robust high-yield production 63 processes [13-15]. Because MVA spreads preferably via cell-to-cell contact a culture format was 64 developed where cell agglomerates of infected and non-infected cells are being induced for production of 65 vaccine preparations. A MVA strain (MVA-CR19) was recently obtained with this system that propagates 66 also in non-agglomerated CR.pIX suspension cells [16]. With this new isolate that represents a different 67 genotype of MVA, titers in the order of 108 IU/mL can be obtained at conventional-cell-densities (CCD) of 68 about 2.0 × 10⁶ cells/mL. As a higher fraction of MVA-CR19 is released into the supernatant, harvest of 69 infectious units does not require whole-cell lysates anymore, facilitating the subsequent downstream 70 processing [16]. 71
To further increase virus titers, high-cell-density (HCD) processes can be established [17]. While virus 72 propagation in HCD often results either in a decrease in cell-specific yields [18, 19] – the so-called “cell-73 density effect” [20, 21] – or in low volumetric productivity [22], there are reports on positive effects on virus 74 titers and cell-specific yields if certain medium feeding/exchange strategies prior to or during virus 75 propagation are being applied. The described strategies can involve medium recirculation, medium 76 perfusion, and periodic virus harvesting [17]. However, in most of these approaches adherent cell lines 77 were used with limited options for scale-up and process intensification. A few authors described the use of 78 suspension cells at 107 cells/mL [22-26], but without addressing details of optimization. 79
Here, an analysis regarding the effect of various medium feeding strategies before and after infection on 80 the yields for production of MVA-CR19 in suspension CR.pIX cells at HCD (50 - 63 × 106 cells/mL) is 81 presented. Cultivations were performed in perfusion bioreactor and shake flasks as a small-scale model. 82

4
We demonstrate that by applying optimized feeding strategies at HCD, similar cell-specific virus yields can 83 be obtained while maximum virus titers as well as volumetric productivity can be increased significantly 84 compared to CCD cultivations. 85
Materials and Methods 86
Cells and Medium 87
Suspension CR.pIX cells [12] were cultivated in chemically defined CD-U3 medium (Biochrom GmbH) with 88 a glucose concentration of 33-40 mM, supplemented with glutamine, alanine (both 2 mM final 89 concentration, Sigma), and recombinant insulin-like growth factor (LONG-R3IGF, 10 ng/mL final 90 concentration, Sigma). Cells were passaged twice a week at a seed concentration of 0.8 × 10⁶ cells/mL. 91
Cultivation in Bioreactor 92
CR.pIX cells were cultivated in a lab-scale bioreactor (BIOSTAT®B plus, Sartorius AG) with a working 93 volume of 0.8 L. The bioreactor was inoculated at 0.8 × 10⁶ cells/mL with pre-cultures expanded in 250 mL 94 shake flasks and operated at 37°C, pH 7.2, and a stirring speed of 120-160 rpm. Dissolved oxygen 95 concentration (DO) was controlled at 40% by pulsed aeration with pure oxygen through a 20 µm pore size 96 micro-sparger to a maximum of 0.048 vvm, representing a volumetric oxygen transfer coefficient (kLa) of 97 10.85 h-1 at 142 rpm. Cells were initially cultivated in batch until a glucose concentration of 14-17 mM (60-98 72 h after inoculation) was reached. At that point, perfusion was started using an ATF2 perfusion system 99 controlled by the C24U –V2.0 controller from Refine Technology and a polysulfone 500 kDa hollow fiber 100 cartridge (UFP-500-E-4X2MA, GE Healthcare). Cell suspension was pumped through the hollow fiber with 101 a recirculation rate of 1.0 L/min and fed with defined perfusion rates to achieve a minimum concentration 102 of 50 × 106 cells/mL. 103
Feeding was based on a constant cell-specific perfusion rate (CSPR) [27] taking into account the steady 104 state mass balance for substrates as described by Kompala and Ozturk [28] with glucose as the major 105 energy source for CR.pIX cells [29] as: 106
CSPR= D/x = qg/x /(CgM - CgR) (eq. 1) 107
with the dilution rate (D, h-1), the viable cell concentration (x, cells/mL), a cell-specific glucose 108 consumption rate (qg/x) of 8.54 × 10⁻¹¹ mmol/(cell h) (based on previous data, not shown), a glucose 109 concentration in CD-U3 medium (CgM) of 33-40 mmol/mL, and a glucose concentration in the bioreactor 110 (CgR) of 6 mmol/mL. 111
As D is the ratio between the perfusion rate Q (mL/h) and the reactor’s working volume Vw (mL), the 112 perfusion rate Q as a function of time can be expressed as: 113
Q = xi eµt Vw CSPR (eq. 2) 114

5
Q was adjusted manually according to the initial cell concentration xi to cover the increasing nutrient 115 demand (i.e. glucose) until the next sampling time point (for simplicity reason either 12 or 24 h). Therefore, 116 the cascade control of the BIOSTAT®B plus module was used. For all calculations a constant cell-specific 117 growth rate µ = 0.026 h-1 was considered. 118
Three hours before infection, the perfusion rate was set to 2.5 times its calculated value to achieve a total 119 medium exchange of 0.85 reactor volumes to further reduce the risk of nutrient limitation, and to dilute 120 unwanted by-products that could negatively affect virus propagation. After infection, the perfusion rate was 121 adjusted to the calculated values, applying the same µ as for the cell growth phase. From 36 hours post 122 infection (hpi) a specific cell death rate of 0.028 h-1 was taken into account to compensate for increasing 123 cell losses due to progress of infection (based on previous data, not shown). 124
125
Shake Flask Cultivations 126
Small-scale cultivations were carried out in shake flasks with baffles (#215-2273, 125 mL (50 mL Vw) or 127 #215-2277, 250 mL (110 mL Vw), VWR International, LLC) at 37°C, 5% CO2 and 185 rpm agitation speed 128 in a Multitron incubation shaker (Infors AG) with 5 cm orbit. For experiments at CCD, shake flasks were 129 inoculated to 0.8-0.9 × 10⁶ cells/mL and cultivated for 72 h to reach about 4.0 × 10⁶ cells/mL before 130 infection. For experiments at HCD, the same inoculation procedure was performed and cells were 131 cultivated in batch for 72 h before starting semi-perfusion. 132
Semi-perfusion was carried out by exchanging periodically enough medium to cover the glucose demand 133 between two sampling time points. Assuming that the medium exchange volume (VE) should equal the 134 amount of medium exchanged in a continuous perfusion process for the same time period, VE can be 135 derived solving equation 2 for d(VE)/dt = xi eµt Vw CSPR to obtain: 136
VE = µ-1 xi (eµ Δt - 1) Vw CSPR (eq. 3) 137
Depending on the viable cell concentration xi at the initial sampling time point, VE (typically less than 60% 138 of Vw) was calculated considering a CSPR of 0.060 nL/(cell d) (based on the perfusion culture performed 139 in the bioreactor) and a Δt of 8 to 24 h. 140
The calculated volume was removed from the cell culture and centrifuged at 200 × g for 5 min. The 141 supernatant was discarded, the cell pellet re-suspended in the same volume of fresh medium and 142 returned to the shake flask. Fluctuations in the concentration of medium components were avoided by 143 regularly adjusting the frequency of medium exchange (maximum 60% Vw). In order to assure a 144 homogeneous cell population at time of infection (TOI), cells were expanded in parallel in 250 mL shake 145 flasks (110 mL Vw). Additionally, at each time point of medium exchange, cells from all shake flasks were 146 pooled, sampled and the exchange volume calculated based on the pooled cell concentration. When a 147

6
minimum target concentration of 50 × 106 cells/mL was achieved, cells were distributed to 125 mL shake 148 flasks (50 mL Vw) and infected accordingly. 149
At TOI, for infections comprising a total or a partial medium exchange, the corresponding volume of cell 150 broth was centrifuged at 200 × g for 5 min and the cell pellet re-suspended in the respective volume of 151 fresh medium containing the virus. When required, pH and DO were monitored online using an SFR® 152 system (PreSens). 153
154
Virus 155
A seed virus bank of the MVA-CR19 isolate (4.5 × 10⁸ virions/mL) propagated in CR.pIX cells was 156 prepared as described before [16]. Before infection, seed virus aliquots were treated for 1 min in a 157 sonication water bath to break up virus aggregates. All cultivations were infected at an MOI (multiplicity of 158 infection) of 0.05 virions/cell. Infections at CCD (4.0 × 10⁶ cells/mL) were performed as described by Lohr 159 (2014) [30], diluting the cell culture 1:2 with fresh CD-U3 medium containing the defined amount of virus. 160 Hence a final concentration of 2.0 × 10⁶ cells/mL was obtained after infection. For infections in HCD, the 161 seed virus was diluted in fresh medium and added when a total or partial medium exchange at TOI was 162 performed. For infection in bioreactors or when no medium exchange was performed, the virus was 163 diluted in fresh medium with a volume equal to 5-6% of the Vw, and added to the cell culture. 164
For quantification of the concentration of infectious virus particles (here lysate), infected cells were treated 165 with three freeze/thaw cycles (-80°C/RT) and treated for 1 min in a sonication water bath (45 kHz) prior to 166 centrifugation at 1500 × g, 10 min, RT, to discard cellular debris. For the quantification of virus released by 167 host cells (here supernatant), samples were centrifuged at 200 × g, 5 min, RT, supernatant was retrieved 168 and treated also with three freeze/thaw cycles before storage [16]. All virus samples were stored in 169 aliquots of 0.5-1 mL at -80°C. Virus quantification was performed by TCID50 as described previously [12]. 170
The cell-specific virus yield (Yv/cell, virions/cell) was calculated based on the total number of infectious virus 171 particles (virT) and the total number of cells produced (cellT). The latter differed from the number of cells at 172 TOI since cell growth was typically observed up to 36-48 hpi. 173
Similarly, the volumetric productivity (PV, virions/(L d)) was calculated considering virT, the total spent 174 medium during cell growth and virus replication phase (VT, L), and the total process time (tT, d), using 175 equation 4: 176
PV = virT/( VT tT) (eq. 4) 177
In order to analyze the productivity at different time points over the virus infection phase, an “apparent” 178 cell-specific virus yield (Yv/cell app, virions/cell) was calculated considering the number of virus particles 179

7
produced until that time point (viracc) and the number of cells infected at 0 hpi (cell0hpi), according to 180 equation 5: 181
Yv/cell app = viracc/cell0hpi (eq. 5) 182
183
Determination of Cell and Metabolite Concentrations 184
Samples from bioreactor cultures were taken with a syringe (6-8 mL) through a Luer-Lock-septum in 12-24 185 h intervals and stored at -80°C until analysis. For determination of glucose and lactate concentrations, a 186 validated assay using a Bioprofile 100 Plus (Nova Biomedical) was used as described previously [15]. Cell 187 concentrations were determined with the cell counter ViCell-XR (Beckman Coulter) with a validated 188 relative standard deviation of 2.48% [30]. 189
Flow Cytometry 190
The percentage of infected cells at different time points post infection was determined with flow cytometry. 191 A total amount of 1 × 10⁶ infected cells were fixed using 1-2% paraformaldehyde for 30 min at 4°C. Fixed 192 cells were washed once with phosphate buffered saline (PBS) and permeabilized with 0.5% Tween 20 in 193 PBS at 4°C for 5 min. The cells were immuno-stained with 1:100 diluted FITC-conjugated polyclonal anti-194 vaccinia antibody (1952402357, quartett GmbH) in staining buffer containing PBS plus 1% foetal calf 195 serum (FCS) for 1-2 h in dark at RT. Using the ImageStream X Mark II (Amnis, EMD Millipore) 10,000 196 single cells per sample (debris and cell doublets were excluded) were analyzed at a wavelength of 488 nm 197 at 5 mV intensity. Data analysis was performed using the IDEAS and FlowJo software. 198
199

8
Results and Discussion 200
1. Propagation of MVA-CR19 at CCD 201
As a reference, infections using CR.pIX cells at CCD were carried out in 50 mL (Vw) shake flasks. For all 202 CCD infections in shake flasks, maximum titers of 4.0 × 10⁸ virions/mL were obtained at about 72 hpi (Fig. 203 1). This was about 24 h later compared to Jordan et al. [13] who used the same virus isolate, cell line and 204 infection strategy. Despite this difference in virus replication dynamics, set of experiments performed in 205 this study (Table 1, CS19b) showed similar virus titers, cell-specific yields and volumetric productivities as 206 reported previously for shake flasks (Table 1, CSwt, CS19a) [16, 30] and a bioreactor (Table 1, CBwt) [15, 207 30]. Thus, the results obtained were considered as representative for CCD infections. 208
209
2. Propagation of MVA-CR19 in Perfusion Bioreactor at HCD 210
Previous experiments using an ATF2 system for the cultivation of CR cells showed the suitability of hollow 211 fiber-based perfusion bioreactors for the production of the influenza virus A/PR/8/34 (H1N1) at HCD [22]. 212 For CR cells a specific oxygen uptake rate of 3.1 × 10⁻¹¹ mmol/(cell h) was determined previously [22]. 213 Assuming a similar rate for CR.pIX cells, a kLa of 2.5 h-1 would be required to achieve about 50 × 106 214 cells/mL. Accordingly, with operation conditions matching those determined previously for the same 215 bioreactor (kLa = 10.9 h-1) [22], an oxygen limitation is not to be expected. 216
For a concentration targeting 50 × 106 cells/mL in the perfusion bioreactor, the medium feeding regime 217 described above (see Materials and Methods) led to a constant cell specific growth rate of 0.019 h-1 218 (doubling time, t2 = 36.5 h), except for a short overfeeding (-50 to -36 h) due to a failure in the control of 219 the feeding pump (Fig. 2 A, B). To correct the failure, medium addition was stopped for 2 h and medium 220 removed through the hollow fiber to recover the original Vw of 0.8 L. Perfusion was then re-started using 221 the initial regime and 57 × 106 cells/mL at 95% viability were finally obtained 247 h after inoculation (Fig. 2 222 A). As expected, this perfusion control led to a very stable CSPR of 0.043-0.066 nL/(cell d) demonstrating 223 the robustness of the feeding strategy chosen. Also, medium utilization was considerably reduced to 8.8 224 reactor volumes (VR) compared to the almost 32 VR reported previously for CR cells, where 50 × 106 225 cells/mL at a similar specific growth rate of 0.020 h-1 (t2 = 34) were obtained [22]. 226
The extensive medium exchange during the last 3 h before infection resulted in an increase in the glucose 227 concentration from 3.72 to 11.0 mM. Despite the adjustment of the perfusion rate at an average CSPR of 228 0.057 nL/(cell d) after infection, the glucose concentration showed a considerable drop from 11.0 to 8.49 229 mM during the first 12 hpi. In order to prevent a glucose limitation during the early stage of virus 230 replication, the CSPR was increased by 50% from 12 to 36 hpi (Fig. 2 B). Afterwards, the perfusion rate 231 was re-adjusted to the theoretical glucose consumption rate. 232

9
Given that the initial titer of 3.16 × 10⁶ virions/mL corresponds actually to a virus concentration that is 233 expected at an MOI of 0.05, loss of the 350 × 270 nm size virions through the 500 kDa ATF membrane is 234 negligible. Additionally, the absence of any active virus in the permeate line (data not shown) along the 235 whole process indicated that all viral particles were indeed retained within the “reaction volume”. 236
With a maximum virus titer of 3.2 × 10⁹ virions/mL at 72 hpi (Fig. 2 B, C), almost a 10-fold increase in the 237 virus titer compared to reference infections at CCD in shake flasks (4.0 × 10⁸ virions/mL) was achieved at 238 the same time point post infection (Figure 1). Overall, a cell-specific yield of 38 virions/cell was obtained 239 (Table 1, HB19) which was 70% lower than for the reference infections at CCD in shake flasks (Table 1, 240 CS19b), and other reported values (Table 1, CS19a, CSwt). Interestingly, in this HCD cultivation, the 241 concentration of viable cells increased significantly after infection (Fig. 2 A). In addition, the percentage of 242 infected cells was very low during the first 36 hpi (Fig. 2 C). This suggests a delay in the virus uptake and 243 onset of intracellular virus replication. Given the total amount of medium employed for biomass expansion 244 and during virus propagation, the volumetric productivity was also lower compared to the CCD 245 experiments (Table 1, HB19). Taken together, two key factors seemed to be important for further 246 improvement of HCD cultivations: 247
a. An optimization of infection conditions to achieve fast virus replication after the addition of the 248 seed virus 249
b. A minimization of medium utilization over the entire virus propagation phase without 250 compromising final virus titers 251
In order to address these two targets, several feeding strategies were assessed during the virus 252 replication phase in small-scale shake flasks. 253
254
3. Scale-down and Optimization of Virus Yields in Semi-Perfusion Culture in Shake Flasks 255
Criteria for Scale-down to Shake Flasks 256
Conditions for batch cultivation of CR.pIX cells in baffled shake flasks were previously optimized [31], and 257 concentrations up to 10 × 106 cells/mL with 95% of viability have been routinely obtained (data not 258 shown). However, whether these conditions, especially the shaking frequency (185 rpm), could fulfill 259 oxygen transfer requirements to achieve cell concentrations up to 50 × 106 cells/mL was not clear. Also, 260 the suitability of a manual medium exchange by centrifugation (semi-perfusion) to mimic perfusion in 261 shake flasks had to be demonstrated. 262
Hence, the kLa for the described cultivation conditions (37°C, 185 rpm shaking frequency) was estimated 263 based on an empirical correlation described for shake flasks with same geometrical configuration by 264 Schiefelbein et al. [32]. For the described cultivation conditions, a kLa of 90.4 and 128 h-1 should be 265

10
expected for 125 (50 mL Vw) and 250 mL (110 mL Vw) shake flasks, respectively. These values are about 266 10 times higher than the reported kLa of 10.9 h-1 for the perfusion bioreactor described above. 267
Subsequently, the scale-down to 110 mL (Vw) shake flasks was analyzed considering the specific cell 268 growth rate, glucose and lactate concentrations, DO and pH as key parameters. Applying a constant 269 CSPR of 0.060 nL/(cell d), cell concentrations above 45 × 106 cells/mL (Fig. 3 A) and a specific growth 270 rate of 0.018 h-1 were achieved. Constant medium renewal allowed maintaining the glucose and lactate 271 concentrations at similar levels as in the HCD bioreactor cultivation (Fig. 3 B). In addition, the pH values 272 were in a range of 7.2 ± 0.2 (Fig. 3 C), which corresponded to the set-point of bioreactor cultivations. As 273 expected, the DO was maintained at very high levels (>85%, Fig. 3 C). Therefore oxygen supply was not 274 considered critical for the HCD cultivations described below. 275
Effect of Medium Exchanges at Time of Infection on Virus Yields 276
Following the characterization of general growth properties of CR.pIX cells at HCD, the effect of a medium 277 exchange at TOI on virus yields was analyzed. Without medium exchange at TOI, a maximum virus titer of 278 1.0 × 10⁸ virions/mL was obtained at 35 hpi (Fig. 4 B), despite the subsequent addition of a 10-fold 279 glucose-concentrated CD-U3 medium (0, 22 and 50 hpi) in fed-batch (FB) to avoid energy depletion. This 280 led to a very low cell-specific yield of 2.3 virions/cell and a volumetric productivity of 2.4 × 10⁸ virions/(L d) 281 (Table 2), which was about one log lower compared to the HCD cultivation in the bioreactor (Table 1). 282 Compared to infections at CCD, the difference was even larger (Table 1). However, MVA-CR19 283 production considerably improved with a single 50% medium exchange at TOI followed by the addition of 284 concentrated medium only at 21 hpi, when glucose was depleted. Despite a short-term glucose limitation, 285 no negative effect in later virus propagation was observed and maximum virus titers of 3.2 × 10⁹ 286 virions/mL were obtained at about 72 hpi in both the lysate and the supernatant (Fig. 4 D). This 287 demonstrated that 100% of the produced viruses can be harvested from supernatant at 72 hpi with no 288 need of a cell-disrupting operation (e.g. freeze/thaw), as observed previously in CCD infections. With a 289 cell-specific yield of 62 virions/cell and a volumetric productivity of 6.0 × 10¹⁰ virions/(L d) (Table 2), the 290 results achieved are in the same range as for the HCD perfusion culture performed in the bioreactor 291 (Table 1). This suggested that the medium exchange at TOI rather than the exclusive glucose supply in 292 FB with concentrated medium is required to boost MVA-CR19 virus propagation (especially from 0 to 24 293 hpi, Fig. 4 B, D). Also, it has been reported that glutamine plays a minor role in energy supply for CR.pIX 294 cells and that its absence might not influence the propagation of MVA in this cell line [29]. Therefore, the 295 positive effect of a medium exchange at TOI on virus propagation might be also due to the dilution of 296 inhibitory metabolites or signaling molecules rather than just a better supply of substrates. 297
Effect of the Substrate Feeding Strategy on Virus Yields 298
In a final step, the combination of a medium exchange at TOI with various feeding strategies, using CD-U3 299 medium, was investigated. The cellular material for the HCD cultures was generated from two 110 mL 300

11
(Vw) batch cultures (in two 250 mL shake flasks). In order to shorten the cell growth phase, the cells were 301 inoculated at 1.1 × 10⁶ cells/mL and semi-perfusion was performed with a strict control of the time and the 302 frequency of the medium exchange. Cell concentrations increased without any noticeable lag phase with a 303 maximum specific growth rate of 0.023 h-1 (t2 = 30 h), similar to other batch cultivations [30]. The culture 304 was split into three 125 mL shake flasks after 63 × 106 cells/mL were obtained to investigate the infection 305 strategies described below. 306
To further reduce the risk of glucose limitation observed at 24 hpi with a 50% of medium exchange at TOI, 307 a 100% medium exchange at TOI followed by three alternative feeding strategies was analyzed: 308
I. Fed-batch (FB): a similar strategy to the volume-expanded fed-batch (VEF-batch) protocol 309 used for the production of Parapoxvirus ovis in bovine kidney cells previously reported by 310 Pohlscheidt et al. [33], was carried out. A medium volume equal to the working volume at TOI 311 (i.e. 20 mL) was added at time points 12, 24, 36 and 72 hpi (Fig. 5 D). At 36 hpi, a working 312 volume of 80 mL was reached (which is above the maximum working volume in the 125 mL 313 shake flasks) and the cell suspension was transferred to a 250 mL shake flask to continue the 314 experiment. 315
II. Daily medium exchange (DME): 90% of the culture supernatant was exchanged every 24 h. 316 This was achieved by centrifugation of the complete volume of the shake flask at 200 × g, 10 317 min, followed by harvest of 90% of the supernatant, and addition of fresh medium. Vw at TOI: 318 50 mL. 319
III. Combination of fed-batch and daily medium exchange (F+D): medium was added in the fed-320 batch mode (see I.) at 12 and 24 hpi. 90% of culture supernatant was exchanged at 36, 72 321 and 96 hpi. As before, the supernatants were collected as product harvest. Vw at TOI: 20 mL. 322
Even a 100% medium exchange at TOI and 24 hpi could not completely prevent temporary depletions of 323 glucose within the DME strategy (Fig. 5 E, 24 and 48h hpi). Similarly glucose limitations were observed at 324 24 and 72 hpi for the F+D (Fig. 5 F) strategy. However, these short-term limitations did not compromise 325 virus propagation: with virus titers higher than 1.0 × 10⁸ virions/mL within the first 24 hpi (Fig. 5 G-I) all 326 experiments performed better than those with a 50% medium exchange (Fig. 4 D). Interestingly, the 327 increase in volume for FB (Fig. 5 D) and F+D (Fig 5 F) during the first 24 hpi did not result in a noticeable 328 reduction of virus titers compared to the DME strategy (Fig 5 E). This positive effect of volume changes on 329 virus titers, despite their expected reduction due to product dilution, was also documented previously for 330 the volume-expanded fed-batch strategy [33]. At 36 hpi, the DME strategy showed a slight decrease in 331 virus accumulation compared to both other strategies. This is possibly due to the removal of infectious 332 particles (harvest of 90% supernatant) and a glucose limitation at 24 hpi. This contrasted with the FB and 333 F+D strategies, where titers above 1.0 × 10⁹ virions/mL were reached at 36 hpi. Nevertheless, a daily 334 exchange of medium (DME, F+D strategy) extended the virus production phase, and allowed to achieve 335 virus titers up to 1.0 × 10¹⁰ virions /mL at 72 hpi. In contrast, the maximum titer was only 3.7 × 10⁹ virions 336

12
/mL for the FB at the same time point (Fig. 5 G-I). Product harvests (supernatant) obtained for the DME 337 and F+D strategies showed consistently very similar virus titers to the lysates (except for harvests at 36 338 hpi in F+D) and even same titers at 72 hpi. Titers in this range were also obtained by Jordan et al. [16]. 339 Accordingly, MVA-CR19 propagation in the CR.pIX cells does not require any disruption steps of the host 340 cells to achieve very high product titers in HCD cultivations. 341
As another comparison between the different feeding strategies, the increase in the Yv/cell app, in which only 342 cells infected at 0 hpi are taken into account, and in PV over the infection time are shown in Fig. 6 A and 6 343 B, respectively. Both FB-based strategies are superior to the DME strategy regarding onset of virus 344 release and maximum Yv/cell app. Furthermore, the maximum Yv/cell app of the F+D strategy exceeds the yield 345 of both other approaches by a factor of two or three. Regarding the PV, the difference between the feeding 346 strategies is smaller. As expected, the difference becomes less evident for the overall cell-specific yield 347 (Table 3), which takes into account cells produced even after TOI. However, FB-based strategies (FB and 348 F+D) showed up to two times higher maximum cell-specific yields compared to DME (Table 3), which 349 indicates an optimal balance between the maintenance of healthy cells and the progress of virus 350 replication. This observation is also supported by the higher percentage of infected cells obtained for the 351 FB and F+D strategies (Fig. 5 G-I). In summary, all strategies led to higher cell-specific yields compared to 352 the typical process at CCD. 353
Since cells of all analyzed strategies originated from one single HCD-cultivation, for the calculation of 354 volumetric productivities, the corresponding medium utilization of each strategy during the cell growth 355 phase was calculated based on their Vw at TOI. This way, medium utilization until TOI was considered 356 60% lower for FB and F+D strategies (Vw = 20 mL) compared to the DME (Vw = 50 mL). Accordingly, the 357 F+D strategy provided the best volumetric productivity, since it provided the lowest medium consumption 358 during the cell expansion phase and produced the highest amount of virus particles (Table 3). Overall, the 359 F+D strategy optimally combined a low medium consumption with high yields. Another positive feature of 360 substrate feeding in a fed-batch mode is that no virus is lost at early stages of infection, which helps to 361 reach a higher fraction of infected cells and high titers at about 36 hpi (Fig. 5 G-I) without reaching limiting 362 glucose concentrations. At that time point, a first harvest should also be considered to collect a highly 363 concentrated supernatant and to avoid the accumulation by-products with a negative impact on virus 364 replication (compare time course of virus titers in Fig. 5 G and Fig. 5 I). Furthermore, a transfer of the cell 365 suspension to a new vessel was not required for the F+D strategy, which represents an advantage against 366 the FB and the reported VEF-batch [33] regarding the operation of large bioreactors. 367
In accordance to the more than 10-fold increase in cell concentrations, all strategies resulted in product 368 titers 10 times higher than the titers typically obtained at CCD. This was also observed regarding the slight 369 increase in cell-specific yields. Even more significant was the considerable increase in volumetric 370 productivity of up to four times in the case of the F+D strategy (Table 3). 371

13
For an implementation of both the DME and the F+D strategies in large-scale vaccine manufacturing, 372 several limitations have to taken into account. For example, at production scale medium exchanges and 373 product harvests cannot be done as fast as in scale-down systems. Accordingly, the use of ATF or other 374 hollow fiber systems with an adequate membrane cut-off should be considered. Based on the results 375 obtained here, adaptation and optimization of such culture formats should focus not only on an adequate 376 substrate supply of cells immediately before and after infection but also on an optimal dilution of possible 377 inhibitors of infection and appropriate virus harvest intervals. 378
379
Conclusion 380
High-cell-density (HCD) cultivations of CR.pIX cells in a bioreactor using an ATF-based perfusion system 381 resulted in similar specific cell growth rates to those previously reported for the same cell line in 382 conventional-cell-density (CCD) culture [30], and the parental cell line CR [22]. Optimum cell proliferation 383 was obtained by a stoichiometric determination of perfusion rates based on the specific cell growth rate. 384 With an optimal supply of nutrients during the exponential phase, an average specific growth rate of 0.019 385 h-1 was achieved with a minimum of medium consumption. In combination with a complete medium 386 exchange prior to infection, cell concentrations in 125 mL shake flasks (50 mL Vw) increased even further 387 (up to 83 × 106 cells/mL), and virus infection of cell populations exceeding 108 cells/mL seem feasible. 388
A scale-down to shake flasks to optimize HCD cultivations demonstrated the capacity of CR.pIX cells to 389 achieve specific growth rates of 0.023 h-1 (t2 = 30 h). Future scale-up studies may achieve an increased 390 cell proliferation if parameters of shake flask cultivation are approximated in bioreactors. Such parameters 391 may include an unregulated pH profile during the batch cultivation phase, in which pH decreases as 392 lactate accumulates, and the indirect pH regulation with the exchange of medium during the perfusion 393 phase. Dissolved oxygen and/or stirring speed may also have been underestimated and perhaps should 394 be adjusted to avoid DO gradients. 395
The analysis of the scale-down model (shake flasks) suggested that maximum virus yields depend on a 396 high viability of cells at TOI, and can be increased if conditioned medium is replaced at that time point. A 397 partial medium replacement may dilute inhibitory metabolites and replenish nutrients that have been 398 depleted during the cell proliferation phase. One process design that takes these observations into 399 account employs a complete medium exchange, followed by fed-batch intervals. Such a strategy is a good 400 option especially for viruses with replication cycles that are longer than the time needed to deplete the 401 available glucose given in the initial medium exchange. Once this first critical stage is overcome, a (semi-) 402 continuous medium exchange could be applied to collect infectious virus material and to avoid the 403 accumulation of toxic by-products. A combination of all options allowed to increase the cell-specific virus 404 yields compared to CCD cultivations and to achieve a very high volumetric productivity at HCD. 405

14
Overall, this study demonstrates that replication of MVA is not inhibited by high host cell density, and 406 presents a general method which can be employed for maximizing yields of cell culture-derived vaccine 407 viruses. Using existing bioreactors coupled to perfusion systems, HCD cultivations have the potential to 408 outperform conventional production strategies, when implementing additional optimizations focusing on 409 the challenges for scale-up discussed above. Consequently, the here studied culture formats may also 410 allow (semi-)continuous cell-free virus harvesting and thus simplify the subsequent downstream 411 processing. 412
413
Acknowledgements 414
Daniel Vázquez-Ramírez would like to thank the Mexican National Council of Science and Technology 415 (CONACyT) and the German Academic Exchange Service (DAAD) for the financial support of this project. 416
Conflict of Interest 417
The authors declare that they have no conflicts of interest. 418

15
References 419
[1] Altenburg AF, Kreijtz JHCM, de Vries RD, Song F, Fux R, Rimmelzwaan GF, et al. Modified Vaccinia 420 Virus Ankara (MVA) as Production Platform for Vaccines against Influenza and Other Viral Respiratory 421 Diseases. Viruses-Basel. 2014;6:2735-61. 422 [2] Mayr A, Munz E. [Changes in the vaccinia virus through continuing passages in chick embryo 423 fibroblast cultures]. Zentralbl Bakteriol Orig. 1964;195:24-35. 424 [3] Rimmelzwaan GF, Kreijtz JHCM, Suezer Y, Schwantes A, Osterhaus ADME, Sutter G. Preclinical 425 evaluation of influenza vaccines based on replication-deficient poxvirus vector MVA. Procedia Vaccinol. 426 2011;4. 427 [4] Ramezanpour B, Pronker ES, Kreijtz JHCM, Osterhaus ADME, Claassen E. Market implementation of 428 the MVA platform for pre-pandemic and pandemic influenza vaccines: A quantitative key opinion leader 429 analysis. Vaccine. 2015;33:4349-58. 430 [5] Volz A, Sutter G. Protective efficacy of Modified Vaccinia virus Ankara in preclinical studies. Vaccine. 431 2013;31:4235-40. 432 [6] Gomez CE, Perdiguero B, Garcia-Arriaza J, Esteban M. Clinical applications of attenuated MVA 433 poxvirus strain. Expert Rev Vaccines. 2013;12:1395-416. 434 [7] Gilbert SC. Clinical development of Modified Vaccinia virus Ankara vaccines. Vaccine. 2013;31:4241-6. 435 [8] Hess RD, Weber F, Watson K, Schmitt S. Regulatory, biosafety and safety challenges for novel cells as 436 substrates for human vaccines. Vaccine. 2012;30:2715-27. 437 [9] Gomez CE, Perdiguero B, Garcia-Arriaza J, Esteban M. Poxvirus vectors as HIV/AIDS vaccines in 438 humans. Hum Vacc Immunother. 2012;8:1192-207. 439 [10] Boukhebza H, Bellon N, Limacher JM, Inchauspe G. Therapeutic vaccination to treat chronic 440 infectious diseases: current clinical developments using MVA-based vaccines. Hum Vaccin Immunother. 441 2012;8:1746-57. 442 [11] Gomez CE, Najera JL, Krupa M, Perdiguero B, Esteban M. MVA and NYVAC as vaccines against 443 emergent infectious diseases and cancer. Curr Gene Ther. 2011;11:189-217. 444 [12] Jordan I, Vos A, Beilfuss S, Neubert A, Breul S, Sandig V. An avian cell line designed for production of 445 highly attenuated viruses. Vaccine. 2009;27:748-56. 446 [13] Jordan I, Northoff S, Thiele M, Hartmann S, Horn D, Howing K, et al. A chemically defined production 447 process for highly attenuated poxviruses. Biologicals. 2011;39:50-8. 448 [14] Jordan I, Sandig V. Highly efficient, chemically defined and fully scalable biphasic production of 449 vaccine viruses. BMC proceedings. 2011;5 Suppl 8:O1. 450 [15] Lohr V, Rath A, Genzel Y, Jordan I, Sandig V, Reichl U. New avian suspension cell lines provide 451 production of influenza virus and MVA in serum-free media: studies on growth, metabolism and virus 452 propagation. Vaccine. 2009;27:4975-82. 453 [16] Jordan I, Horn D, John K, Sandig V. A Genotype of Modified Vaccinia Ankara (MVA) that Facilitates 454 Replication in Suspension Cultures in Chemically Defined Medium. Viruses-Basel. 2013;5:321-39. 455 [17] Tapia F, Vazquez-Ramirez D, Genzel Y, Reichl U. Bioreactors for high cell density and continuous 456 multi-stage cultivations: options for process intensification in cell culture-based viral vaccine production. 457 Applied microbiology and biotechnology. 2016. 458 [18] Henry O, Dormond E, Perrier M, Kamen A. Insights into adenoviral vector production kinetics in 459 acoustic filter-based perf usion cultures. Biotechnology and bioengineering. 2004;86:765-74. 460 [19] Nadeau I, Kamen A. Production of adenovirus vector for gene therapy. Biotechnol Adv. 2003;20:475-461 89. 462 [20] Lindsay DA, Betenbaugh MJ. Quantification of Cell-Culture Factors Affecting Recombinant Protein 463 Yields in Baculovirus-Infected Insect Cells. Biotechnology and bioengineering. 1992;39:614-8. 464 [21] Maranga L, Brazao TF, Carrondo MJT. Virus-like particle production at low multiplicities of infection 465 with the baculovirus insect cell system. Biotechnology and bioengineering. 2003;84:245-53. 466

16
[22] Genzel Y, Vogel T, Buck J, Behrendt I, Ramirez DV, Schiedner G, et al. High cell density cultivations by 467 alternating tangential flow (ATF) perfusion for influenza A virus production using suspension cells. 468 Vaccine. 2014;32:2770-81. 469 [23] Yuk IHY, Olsen MM, Geyer S, Forestell SP. Perfusion cultures of human tumor cells: A scalable 470 production platform for oncolytic adenoviral vectors. Biotechnology and bioengineering. 2004;86:637-471 42. 472 [24] Van HH, Luitjens A. Method for the production of ad26 adenoviral vectors. Google Patents; 2011. 473 [25] Tapia F, Vogel T, Genzel Y, Behrendt I, Hirschel M, Gangemi JD, et al. Production of high-titer human 474 influenza A virus with adherent and suspension MDCK cells cultured in a single-use hollow fiber 475 bioreactor. Vaccine. 2014;32:1003-11. 476 [26] Ghani K, Garnier A, Coelho H, Transfiguracion J, Trudel P, Kamen A. Retroviral vector production 477 using suspension-adapted 293GPG cells in a 3L acoustic filter-based perfusion bioreactor. Biotechnology 478 and bioengineering. 2006;95:653-60. 479 [27] Ozturk SS. Engineering challenges in high density cell culture systems. Cytotechnology. 1996;22:3-480 16. 481 [28] Kompala DS, Ozturk SS. Optimization of high cell density perfusion bioreactors. In: Ozturk SS, Hu WS, 482 editors. Cell culture technology for pharmaceutical and cell-based therapies. Boca Raton, FL: CRC Press, 483 Taylor & Francis Group 2006. p. 387-416. 484 [29] Lohr V, Hadicke O, Genzel Y, Jordan I, Buntemeyer H, Klamt S, et al. The avian cell line AGE1.CR.pIX 485 characterized by metabolic flux analysis. Bmc Biotechnol. 2014;14:72. 486 [30] Lohr V. Characterization of the avian designer cells AGE1.CR and AGE1.CR.pIX considering growth, 487 metabolism and production of influenza virus and Modified Vaccinia Virus Ankara (MVA). Magdeburg, 488 Germany: Otto von Guericke University Magdeburg; 2014. 489 [31] Lohr V, Genzel Y, Jordan I, Katinger D, Mahr S, Sandig V, et al. Live attenuated influenza viruses 490 produced in a suspension process with avian AGE1.CR.pIX cells. Bmc Biotechnol. 2012;12. 491 [32] Schiefelbein S, Frohlich A, John GT, Beutler F, Wittmann C, Becker J. Oxygen supply in disposable 492 shake-flasks: prediction of oxygen transfer rate, oxygen saturation and maximum cell concentration 493 during aerobic growth. Biotechnol Lett. 2013;35:1223-30. 494 [33] Pohlscheidt M, Langer U, Minuth T, Bodeker B, Apeler H, Horlein HD, et al. Development and 495 optimisation of a procedure for the production of Parapoxvirus ovis by large-scale microcarrier cell 496 culture in a non-animal, non-human and non-plant-derived medium. Vaccine. 2008;26:1552-65. 497
498

Table 1. MVA production in CR.pIX suspension cells for conventional and high-cell-density cultures
IDa Working volume [mL]
Harvest titer [virions/mL] tT [d]b Max. cells
[× 106/mL] Yv/cell
[virions/cell]c PV
[virions/(L × d)]d
CSwte [27] 50 2.7 × 10⁸ 5.0 2.7 1.0 × 10² 5.4 × 10¹⁰
CBwtf [15, 27] 1000 1.0 × 10⁸ 5.0 2.0 0.50 × 10² 2.0 × 10¹⁰
CS19ag [16] 50 3.0 × 10⁸ 5.0 2.0 1.5 × 10² 6.0 × 10¹⁰
CS19bh 50 3.9 × 10⁸ 6.0 3.0 1.3 × 10² 6.6 × 10¹⁰
HB19i 800 3.2 × 10⁹ 13 83 0.38 × 10² 1.0 × 10¹⁰ a C: conventional-cell-density, H: high-cell-density, S: shake flask, B: bioreactor, wt: MVA-wt, 19: MVA-CR19 b Total time from cell inoculation to maximum titer c Cell-specific virus yield d Volumetric productivity e Average of four independent cultivations. f, i Single bioreactor cultivations
g, h Average of three independent cultivations
Table 2. MVA-CR19 production in CR.pIX suspension cells in shake flasks at high-cell-density without
and with 50% medium exchange at time of infection
Medium exchange
Harvest titer [virions/mL]
Yv/cell [virions/cell]
PV [virions/(L × d)]
0% 1.0 × 10⁸ 2.3 2.4 × 10⁸
50% 3.2 × 10⁹ 62 6.0 × 10¹⁰
Table 3. MVA-CR19 production in CR.pIX suspension cells in shake flasks for different feeding strategies after seed virus addition
Mode Harvest vol.a [mL]
Harvest titer [virions /mL]
Max. cells [× 109]
Pooled titer b [virions /mL]
Yv/cell [virions /cell]
PV [virions/(L × d)]
FB 100 3.7 × 10⁹ 1.9 3.7 × 10⁹ 2.0 × 10² 1.6 × 10¹¹
H1: 45 1.6 × 10⁸
DME H2: 45 5.6 × 10⁸ 4.0 3.8 × 10⁹ 1.3 × 10² 1.7 × 10¹¹
H3: 50 1.0× 10¹⁰
F+D H1: 45 1.0 × 10⁸
1.9 5.3 × 10⁹ 2.7 × 10² 2.6 × 10¹¹ H2: 50 1.0× 10¹⁰
a H: harvest b Titer of accumulated harvests *All data correspond to values obtained at/up to 72 hpi (time of highest virus titer and productivity yields)
Tables
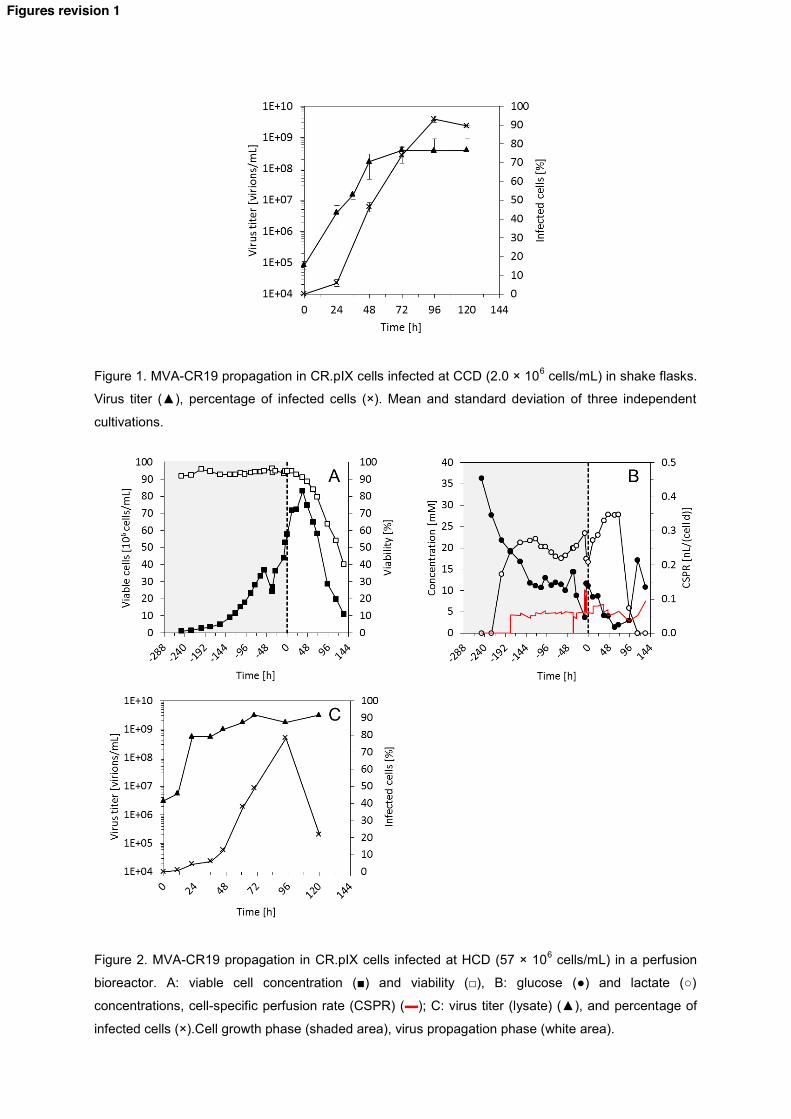
Figure 1. MVA-CR19 propagation in CR.pIX cells infected at CCD (2.0 × 10⁶ cells/mL) in shake flasks.
Virus titer (▲), percentage of infected cells (×). Mean and standard deviation of three independent
cultivations.
Figure 2. MVA-CR19 propagation in CR.pIX cells infected at HCD (57 × 106 cells/mL) in a perfusion
bioreactor. A: viable cell concentration (■) and viability (□), B: glucose (●) and lactate (○)
concentrations, cell-specific perfusion rate (CSPR) (▬); C: virus titer (lysate) (▲), and percentage of
infected cells (×).Cell growth phase (shaded area), virus propagation phase (white area).
Figures revision 1

Figure 3. Growth of CR.pIX cells at HCD in 250 mL shake flasks (110 mL Vw). A: viable cell
concentration (■) and viability (□), B: glucose (●) and lactate (○) concentrations, cell-specific perfusion
rate (CSPR) (▬); C: online DO (●), online (●) and offline pH (●), optimal pH (▬), dashed lines: ± 0.2
pH units.

Figure 4. MVA-CR19 propagation in CR.pIX cells infected at HCD (37 × 106 cells/mL) in 250 mL shake
flasks (110 mL Vw). Viable cell concentration (■) and viability (□) without medium exchange (A) and
50% medium exchange (C) at time of infection. Glucose (●) and lactate (○) concentrations and virus
titer in lysate ( ) and supernatant ( ), without medium exchange (B) and 50% medium exchange (D).
Cell growth phase (shaded area), virus propagation phase (white area), time-points of glucose-
concentrated medium addition (blue arrows).

Figure 5. MVA-CR19 virus production in CR.pIX cell using different feeding strategies. Fed-batch (FB)
(A, D, G), daily medium exchange (DME) (B, E, H), and a combination of FB and DME (F+D) (C, F, I).
Viable cell concentrations (■) and viability (□) at cell growth phase (shaded area) and virus
propagation phase (white area). Glucose (●) and lactate (○) concentrations, working volume (dashed
line). Virus titer in bioreactor (lysate) ( ) and harvest (supernatant) ( ), percentage of infected cells
(×). Cell growth phase (shaded area), virus propagation phase (white area).

Figure 6. Accumulated MVA-CR19 virus along the virus propagation phase. Apparent cell-specific
yield (Yv/cell app) (A) and volumetric productivity (PV) (B) for FB (●), DME (○) and F+D (●) strategies.