Embed Size (px)
Citation preview

11
Health Disparities and Health Disparities and Disabilities among Disabilities among
Hispanic PopulationsHispanic Populations
Lucy Wong-Hernandez, M.S.Lucy Wong-Hernandez, M.S.School of Allied Health SciencesSchool of Allied Health Sciences
East Carolina UniversityEast Carolina University&&
Monica Carrion-Jones, MDMonica Carrion-Jones, MDPhysical Medicine and RehabilitationPhysical Medicine and Rehabilitation
Brody Medical SchoolBrody Medical SchoolEast Carolina UniversityEast Carolina University

22
ObjectivesObjectives
Identify the target populationIdentify the target population
Identify health disparities among this populationIdentify health disparities among this population
Causes of Health Disparities and DisabilitiesCauses of Health Disparities and Disabilities
How can we decrease the gapHow can we decrease the gap
33
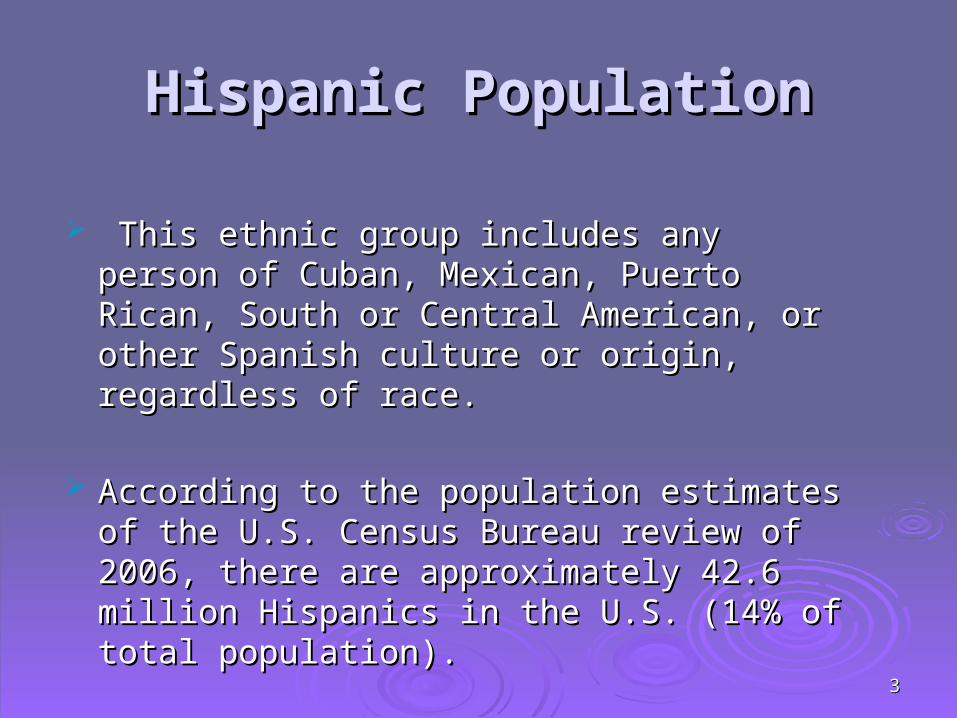
Hispanic PopulationHispanic Population
This ethnic group includes any person of This ethnic group includes any person of Cuban, Mexican, Puerto Rican, South or Cuban, Mexican, Puerto Rican, South or Central American, or other Spanish culture or Central American, or other Spanish culture or origin, regardless of race. origin, regardless of race.
According to the population estimates of the According to the population estimates of the U.S. Census Bureau review of 2006, there U.S. Census Bureau review of 2006, there are approximately 42.6 million Hispanics in are approximately 42.6 million Hispanics in the U.S. (14% of total population).the U.S. (14% of total population).
44
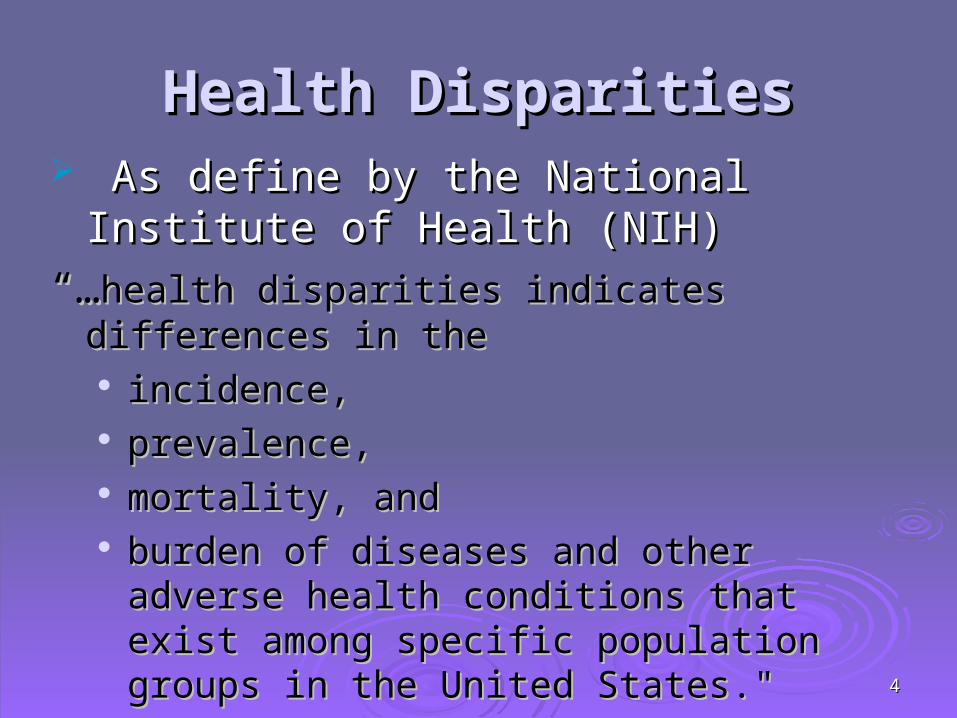
Health DisparitiesHealth Disparities As define by the National Institute of As define by the National Institute of
Health (NIH) Health (NIH)
“…“…health disparities indicateshealth disparities indicates differences in the differences in the incidence,incidence, prevalence, prevalence, mortality, and mortality, and burden of diseases and other adverse health burden of diseases and other adverse health
conditions that exist among specific conditions that exist among specific population groups in the United States." population groups in the United States."
55
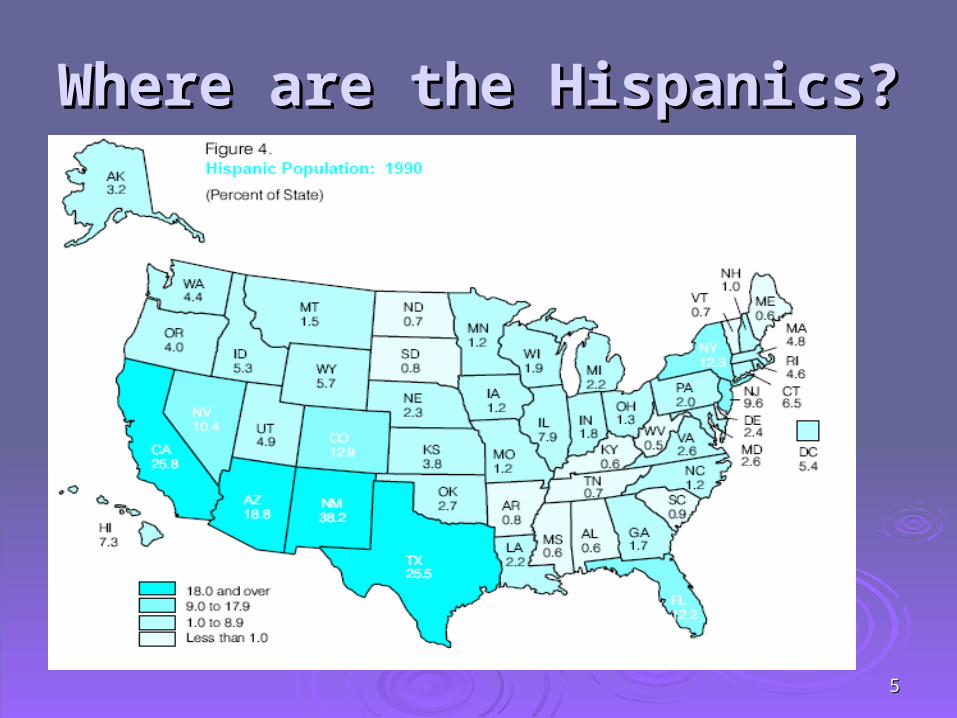
Where are the Hispanics?Where are the Hispanics?
66
Areas of Health DisparitiesAreas of Health Disparities
CancerCancer DiabetesDiabetes Heart DiseaseHeart Disease HIV/AIDSHIV/AIDS
ImmunizationImmunization Infant MortalityInfant Mortality StrokeStroke Asthma Asthma Work-Related InjuriesWork-Related Injuries

77
CancerCancer
In 2003, Hispanic men were 19% less likely to have In 2003, Hispanic men were 19% less likely to have prostate cancer as non-Hispanic white men. prostate cancer as non-Hispanic white men.
In 2003, Hispanic women were 39% less likely to have In 2003, Hispanic women were 39% less likely to have breast cancer as non-Hispanic white women.breast cancer as non-Hispanic white women.
Hispanic men and women have higher incidence and Hispanic men and women have higher incidence and
mortality rates for stomach and liver cancer.mortality rates for stomach and liver cancer. In 2003, Hispanic women were 2.2 times as likely as In 2003, Hispanic women were 2.2 times as likely as
non-Hispanic white women to be diagnosed with cervical non-Hispanic white women to be diagnosed with cervical cancer. cancer.

88
DiabetesDiabetes
In 2003 Mexican American adults were 2 times In 2003 Mexican American adults were 2 times more likely than non-Hispanic white adults to more likely than non-Hispanic white adults to have been diagnosed with diabetes by a have been diagnosed with diabetes by a physician. physician.
In 2002, Hispanics were 1.5 times as likely to In 2002, Hispanics were 1.5 times as likely to start treatment for end-stage renal disease start treatment for end-stage renal disease related to diabetes, as compared to non-related to diabetes, as compared to non-Hispanic white men. Hispanic white men.
In 2003 Hispanics were 1.5 times as likely as In 2003 Hispanics were 1.5 times as likely as non-Hispanic Whites to die from diabetes. non-Hispanic Whites to die from diabetes.

99
Heart DiseaseHeart Disease In 2004, Hispanics were 10% less likely to have In 2004, Hispanics were 10% less likely to have
heart disease, as compared to non-Hispanic heart disease, as compared to non-Hispanic whites. whites.
In 2003 Mexican American men were 30% less In 2003 Mexican American men were 30% less likely to die from heart disease, as compared to likely to die from heart disease, as compared to non-Hispanic white men. non-Hispanic white men.
Mexican American women were 1.2 times more Mexican American women were 1.2 times more likely than non-Hispanic white women to be likely than non-Hispanic white women to be obese.obese.
1010
HIV / AIDSHIV / AIDS
Hispanics accounted for 18% of HIV/AIDS cases in Hispanics accounted for 18% of HIV/AIDS cases in 2004. 2004.
Hispanic males had over 3 times the AIDS rate as non-Hispanic males had over 3 times the AIDS rate as non-Hispanic white males. Hispanic white males.
Hispanic females had over 5 times the AIDS rate as non-Hispanic females had over 5 times the AIDS rate as non-Hispanic white females. Hispanic white females.
Hispanic men were 2.7 times as likely to die from Hispanic men were 2.7 times as likely to die from HIV/AIDS as non-Hispanic white men. HIV/AIDS as non-Hispanic white men.
Hispanic women were 4.5 times as likely to die from Hispanic women were 4.5 times as likely to die from HIV/AIDS as non-Hispanic white women.HIV/AIDS as non-Hispanic white women.

1111
ImmunizationImmunization
In 2004 Hispanic adults aged 65 and older were 20% In 2004 Hispanic adults aged 65 and older were 20% less likely to have received the influenza (flu) shot in less likely to have received the influenza (flu) shot in the past 12 months -- as compared to non-Hispanic the past 12 months -- as compared to non-Hispanic whites of the same age group. whites of the same age group.
In 2004, Hispanic adults aged 65 and older were 40% In 2004, Hispanic adults aged 65 and older were 40% less likely to have ever received the pneumonia shot, less likely to have ever received the pneumonia shot, -- as compared to non-Hispanic white adults of the -- as compared to non-Hispanic white adults of the same age group.same age group.
Although Hispanic children 19 to 35 months old had Although Hispanic children 19 to 35 months old had
comparable rates of immunization for hepatitis, comparable rates of immunization for hepatitis, influenza, MMR, and polio -- they were slightly less influenza, MMR, and polio -- they were slightly less likely to be fully immunized, when compared to non-likely to be fully immunized, when compared to non-Hispanic white children.Hispanic white children.

1212
Infant MortalityInfant Mortality In 2003, infant mortality rates for Hispanic In 2003, infant mortality rates for Hispanic
subpopulations ranged from 4.6 per 1,000 live births to subpopulations ranged from 4.6 per 1,000 live births to 8.2 per 1,000 live births, compared to the non-Hispanic 8.2 per 1,000 live births, compared to the non-Hispanic white infant mortality rate of 5.7 per 1,000 live births. white infant mortality rate of 5.7 per 1,000 live births.
In 2003, Puerto Ricans had 1.4 times the infant mortality In 2003, Puerto Ricans had 1.4 times the infant mortality rate of non-Hispanic whites.rate of non-Hispanic whites.
Puerto Rican infants were 2.1 times as likely to die from Puerto Rican infants were 2.1 times as likely to die from
causes related to low birth weight, as compared to non-causes related to low birth weight, as compared to non-Hispanic white infants. Hispanic white infants.
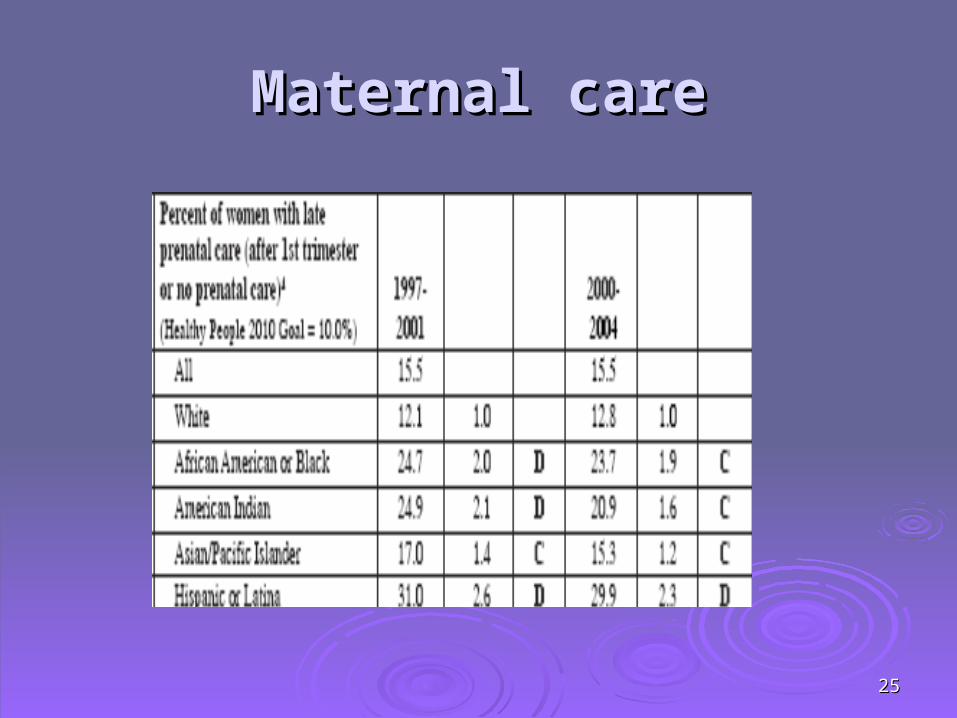
Mexican American mothers were twice as likely as non-Mexican American mothers were twice as likely as non-Hispanic white mothers to begin prenatal care in the 3rd Hispanic white mothers to begin prenatal care in the 3rd trimester, or not receive prenatal care at all. trimester, or not receive prenatal care at all.

1313
AsthmaAsthma
During 1993-1995 in the northeast U.S., During 1993-1995 in the northeast U.S., Hispanics/Latinos had an asthma death Hispanics/Latinos had an asthma death rate of 34 per million -- more than twice rate of 34 per million -- more than twice the rate for white Americans (15.1 per the rate for white Americans (15.1 per million).million).
1414
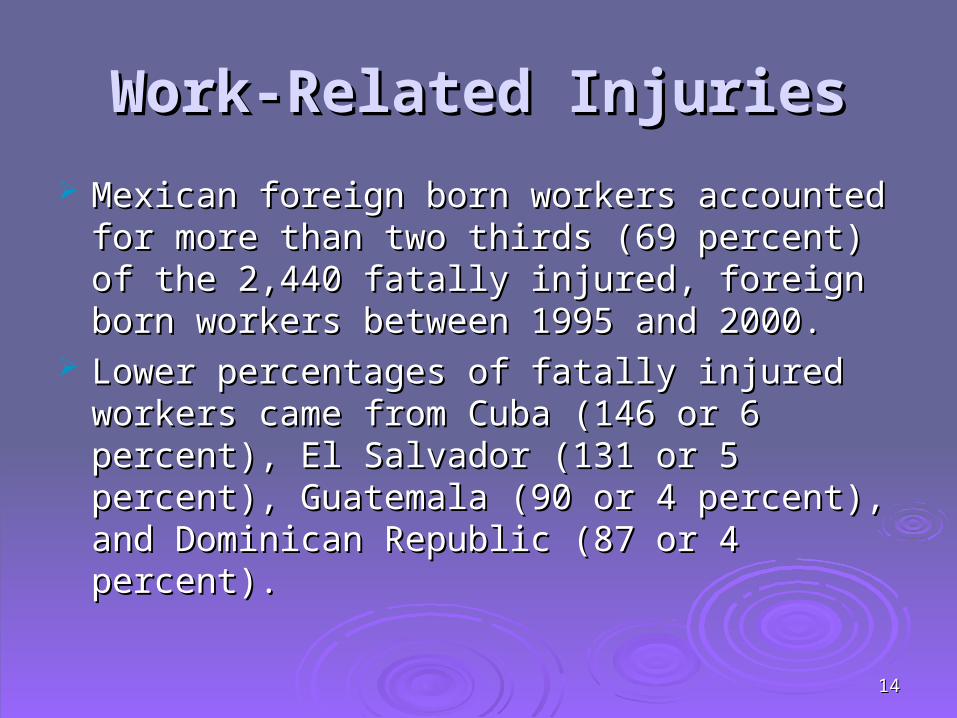
Work-Related InjuriesWork-Related Injuries
Mexican foreign born workers accounted for Mexican foreign born workers accounted for more than two thirds (69 percent) of the 2,440 more than two thirds (69 percent) of the 2,440 fatally injured, foreign born workers between fatally injured, foreign born workers between 1995 and 2000. 1995 and 2000.
Lower percentages of fatally injured workers Lower percentages of fatally injured workers came from Cuba (146 or 6 percent), El Salvador came from Cuba (146 or 6 percent), El Salvador (131 or 5 percent), Guatemala (90 or 4 percent), (131 or 5 percent), Guatemala (90 or 4 percent), and Dominican Republic (87 or 4 percent).and Dominican Republic (87 or 4 percent).
1515
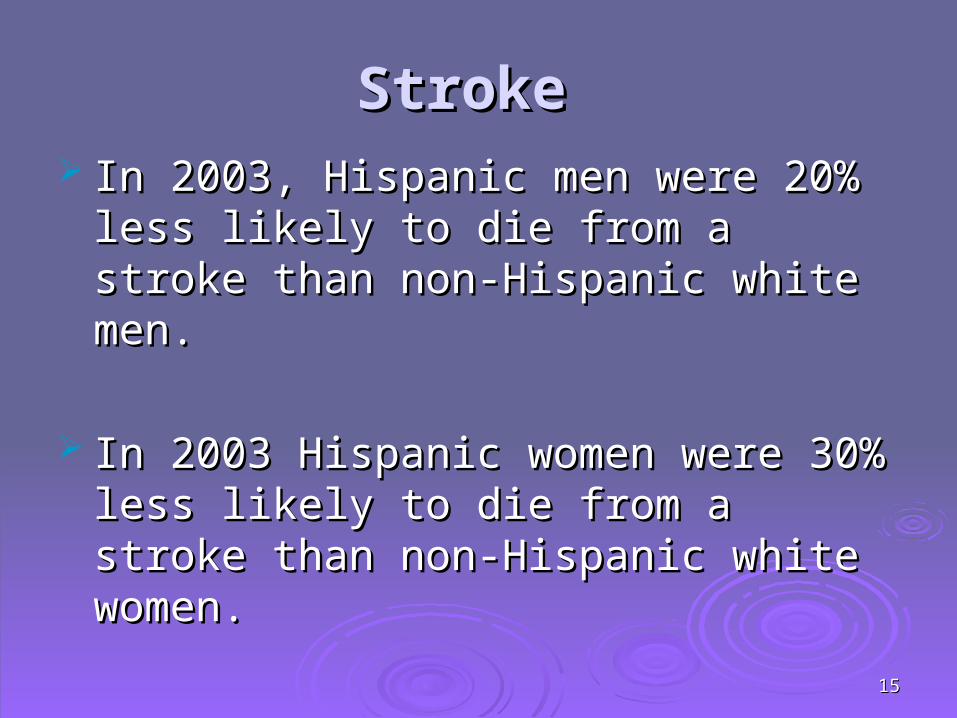
Stroke Stroke In 2003, Hispanic men were 20% less In 2003, Hispanic men were 20% less
likely to die from a stroke than non-likely to die from a stroke than non-Hispanic white men. Hispanic white men.
In 2003 Hispanic women were 30% less In 2003 Hispanic women were 30% less likely to die from a stroke than non-likely to die from a stroke than non-Hispanic white women. Hispanic white women.

1616
Causes of Health DisparitiesCauses of Health Disparities
Socioeconomic factors Socioeconomic factors
Lifestyle behaviorsLifestyle behaviors Social and built environmentSocial and built environment Access to preventive health-care servicesAccess to preventive health-care services
Access to affordable health insuranceAccess to affordable health insurance
1717
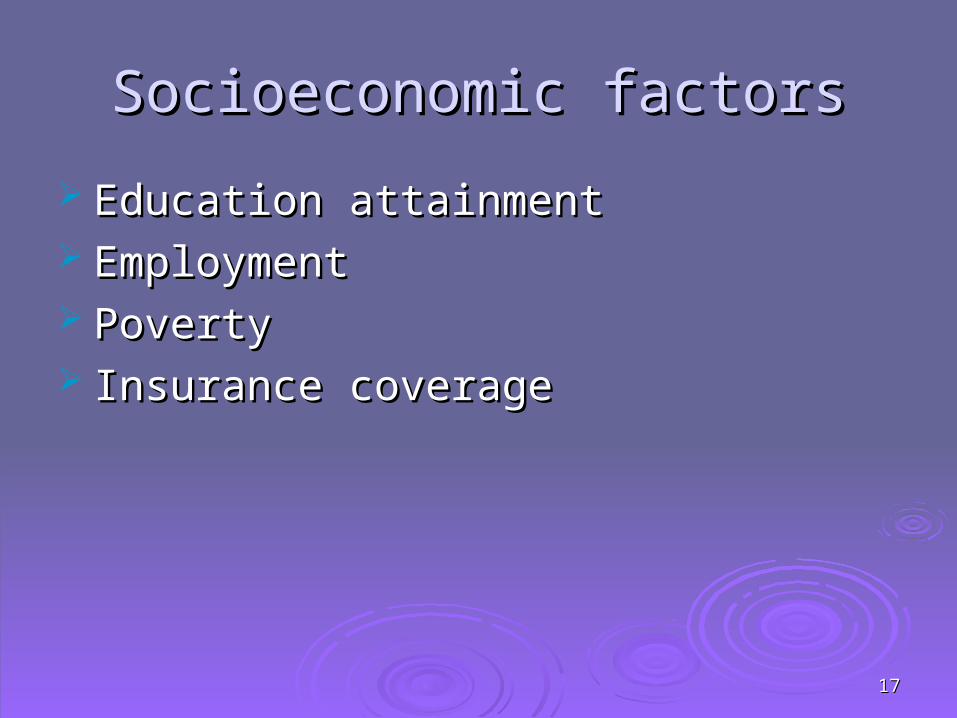
Socioeconomic factorsSocioeconomic factors
Education attainmentEducation attainment EmploymentEmployment Poverty Poverty Insurance coverageInsurance coverage

1818
NONO Usual Place of Care Usual Place of Care(Preventive care in a clinic or health center VS. doctor’s office)(Preventive care in a clinic or health center VS. doctor’s office)
Race/EthnicityRace/Ethnicity PercentagePercentage
Hispanic/Latino Hispanic/Latino WomenWomen
56.4%56.4%
Non-Hispanic Non-Hispanic White WomenWhite Women
41.4%41.4%
Non-Hispanic Non-Hispanic Black WomenBlack Women
40.9%40.9%
1919
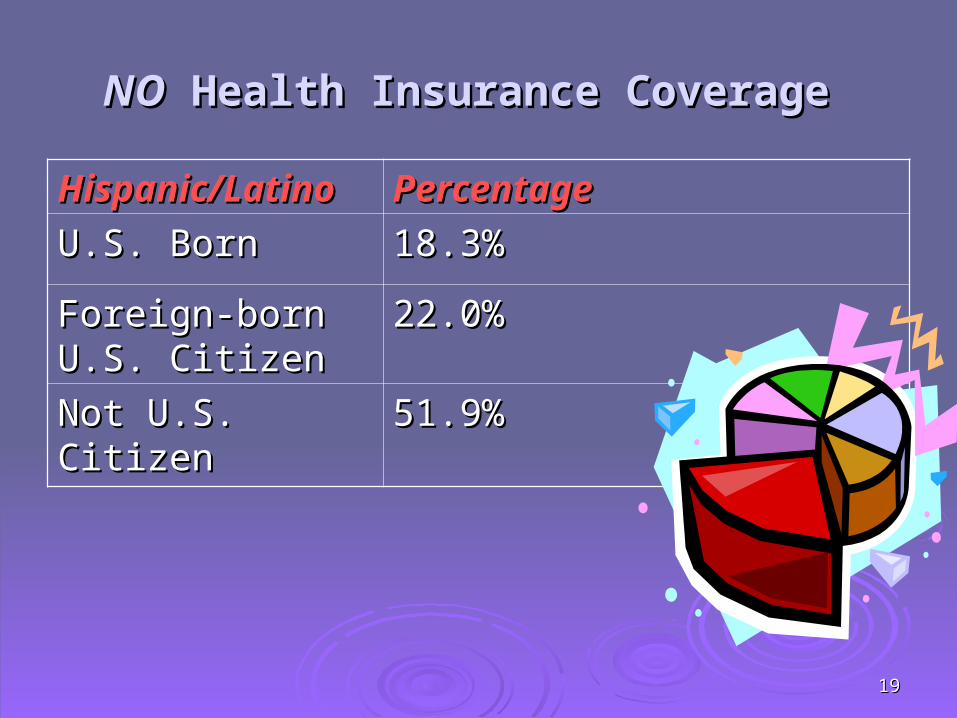
NONO Health Insurance Coverage Health Insurance Coverage
Hispanic/LatinoHispanic/Latino PercentagePercentage
U.S. BornU.S. Born 18.3%18.3%
Foreign-born U.S. Foreign-born U.S. CitizenCitizen
22.0%22.0%
Not U.S. CitizenNot U.S. Citizen 51.9%51.9%

2020
Lifestyle behaviorLifestyle behavior
Lack of physical activity Lack of physical activity
Alcohol intakeAlcohol intake
Smoking Smoking
Food intake (diet)Food intake (diet)

2121
Social EnvironmentSocial Environment
Educational and economic opportunities Educational and economic opportunities Racial/ethnic discriminationRacial/ethnic discrimination Neighborhood and work conditionsNeighborhood and work conditions Lack fluency in EnglishLack fluency in English Lack of familiarity with the U.S. Lack of familiarity with the U.S.
health-care system health-care system

2222
Access to preventive Access to preventive health-care serviceshealth-care services
Cancer screening Cancer screening HIV screeningHIV screening VaccinationVaccination Pre-natal carePre-natal care
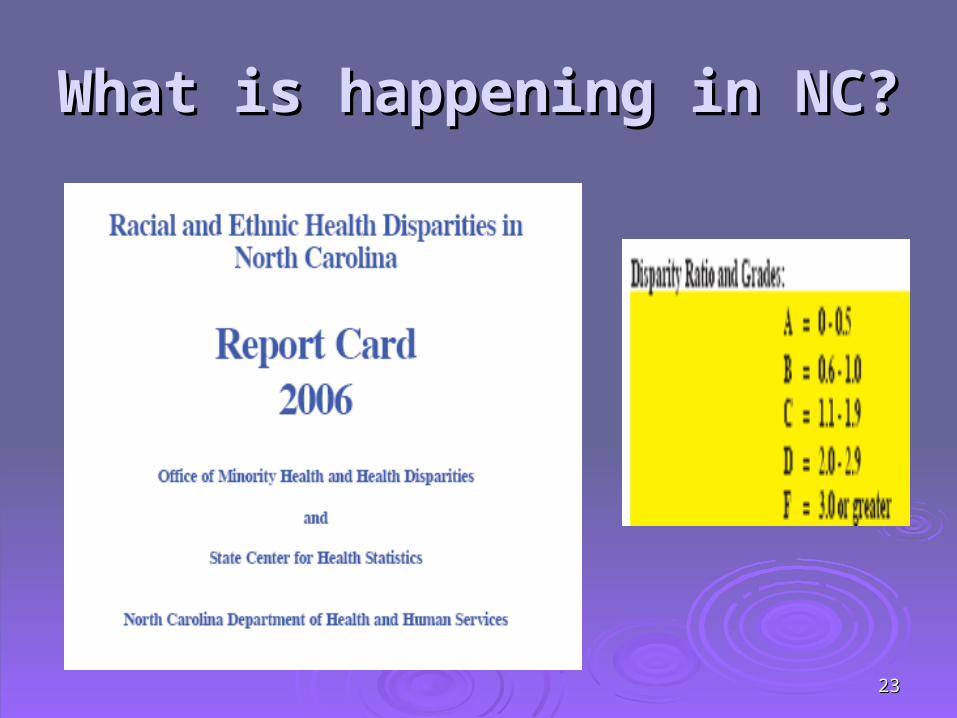
2323
What is happening in NC?What is happening in NC?

2424
Social and economical well-beingSocial and economical well-being
2525
Maternal careMaternal care
2626
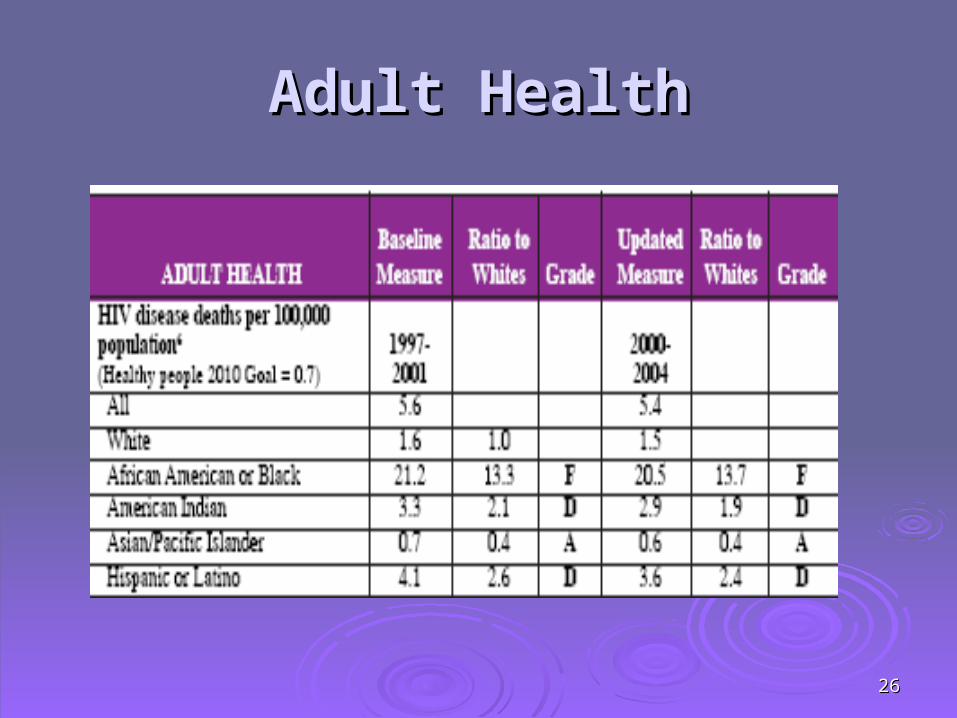
Adult HealthAdult Health
2727
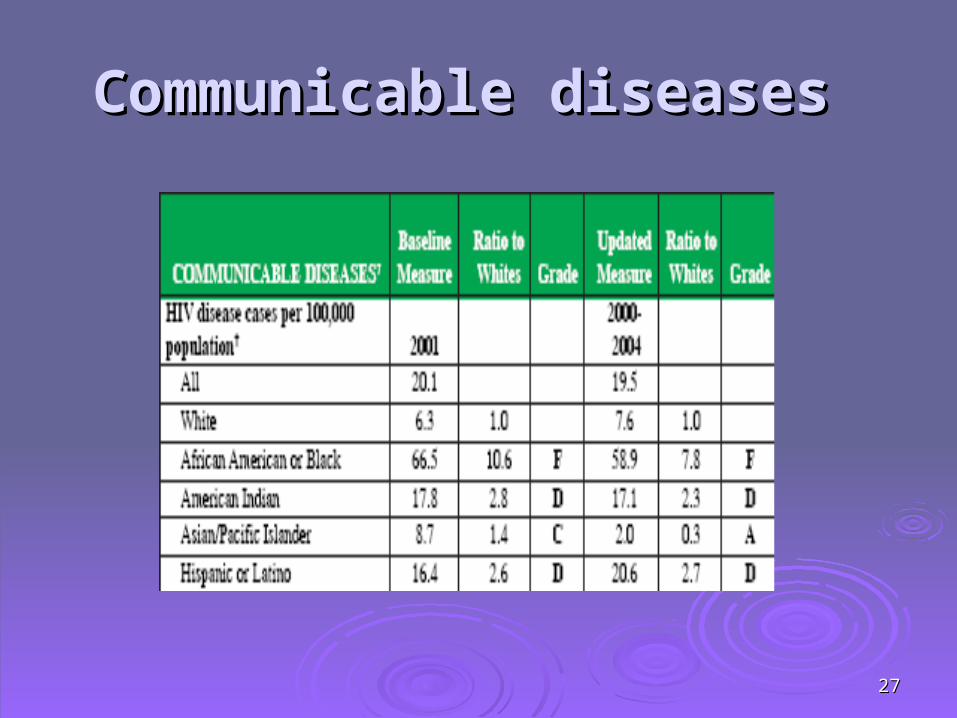
Communicable diseasesCommunicable diseases

2828
Adult HealthAdult Health
2929
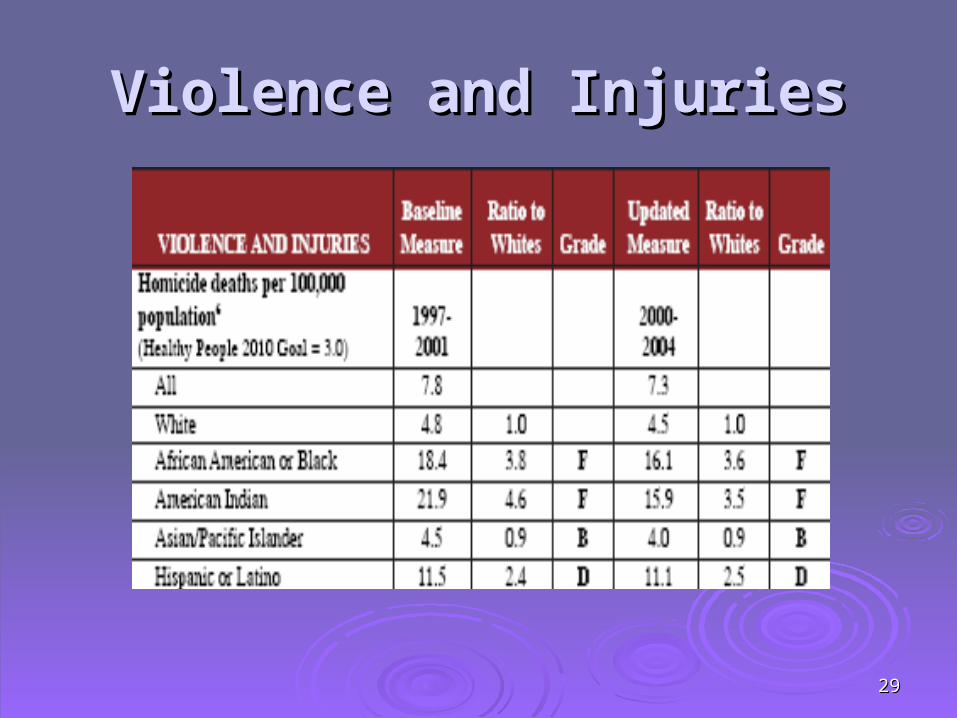
Violence and InjuriesViolence and Injuries

3030
Health PromotionHealth Promotion

3131
How do we eliminate the GAP?How do we eliminate the GAP?
Increment National Standards on Increment National Standards on Culturally and Linguistically Appropriate Culturally and Linguistically Appropriate Services.Services.
Community education that involves all Community education that involves all members of the communitymembers of the community
Knowing the problem and the causes Knowing the problem and the causes (Research).(Research).
Promoting preventive health care that is Promoting preventive health care that is also culturally sensitive. also culturally sensitive.
3232
DISABILITYDISABILITY
AMONG HISPANICSAMONG HISPANICS
********

3333
DisabilityDisability
Overview:Overview: Disability Definition Disability Definition Access & ChallengesAccess & Challenges Health & Disability Disparities IssuesHealth & Disability Disparities Issues Cultural Sensitivity & Competency Cultural Sensitivity & Competency Recommendations for ResearchRecommendations for Research
3434
DISABILITYDISABILITY Disability definition:Disability definition:
The condition of having a disability or limitation. The condition of having a disability or limitation. The period or length of such a conditionThe period or length of such a condition
A disadvantage or deficiency, especially a physical or A disadvantage or deficiency, especially a physical or mental impairment that interferes with or prevents mental impairment that interferes with or prevents normal achievement in a particular area or major life normal achievement in a particular area or major life activities of the individual. activities of the individual.
Law: Law: A legal incapacity or disqualification. A legal incapacity or disqualification.

3535
In 2005, an estimated 20.6% civilians not living in an In 2005, an estimated 20.6% civilians not living in an institution (or 53.9 million people) met the criteria for institution (or 53.9 million people) met the criteria for disability.disability.
Women and girls with disabilities are estimated to Women and girls with disabilities are estimated to number 28.6 million, which is 21.3% of the female number 28.6 million, which is 21.3% of the female population.population.
An estimated 25.3 million men and boys with An estimated 25.3 million men and boys with
disabilities make up 19.8% of the male population. disabilities make up 19.8% of the male population.
One in five Americans has a diagnosed disability; One in five Americans has a diagnosed disability; more than half of those with disabilities are female.more than half of those with disabilities are female.

3636
Americans with and without disability by genderAmericans with and without disability by gender
3737
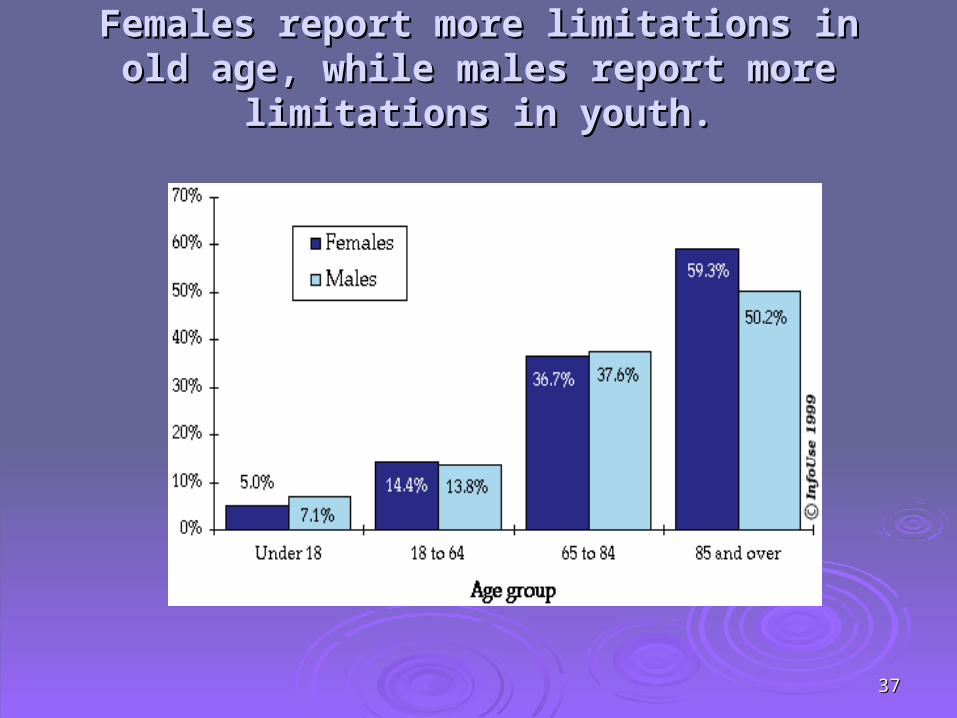
Females report more limitations in old age, Females report more limitations in old age, while males report more limitations in youth.while males report more limitations in youth.
3838
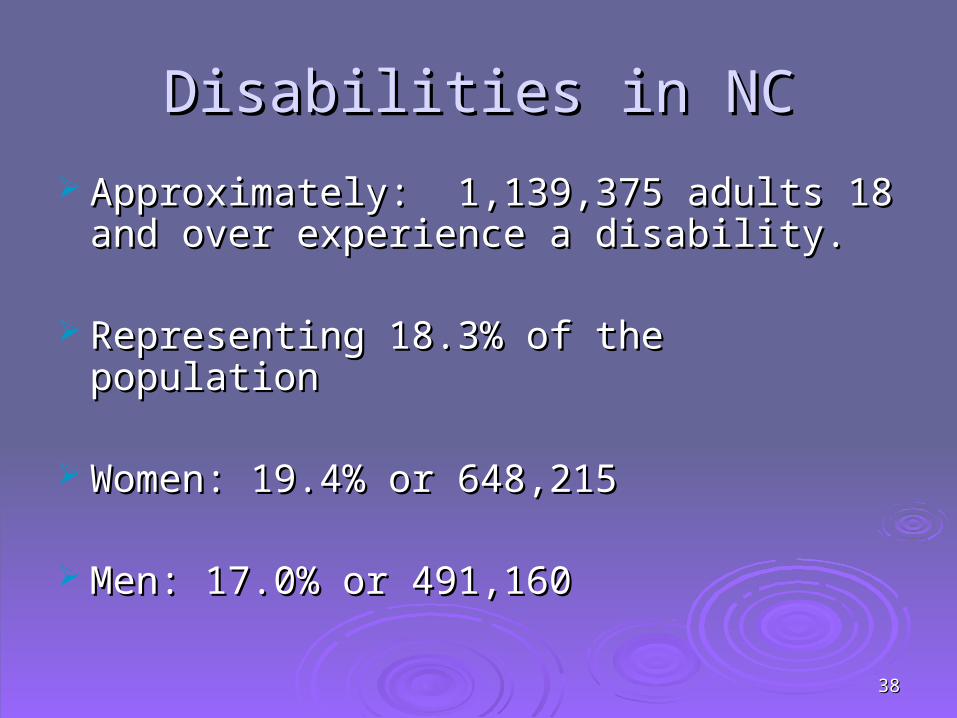
Disabilities in NCDisabilities in NC
Approximately: 1,139,375 adults 18 and Approximately: 1,139,375 adults 18 and over experience a disability.over experience a disability.
Representing 18.3% of the populationRepresenting 18.3% of the population
Women: 19.4% or 648,215Women: 19.4% or 648,215
Men: 17.0% or 491,160 Men: 17.0% or 491,160
3939
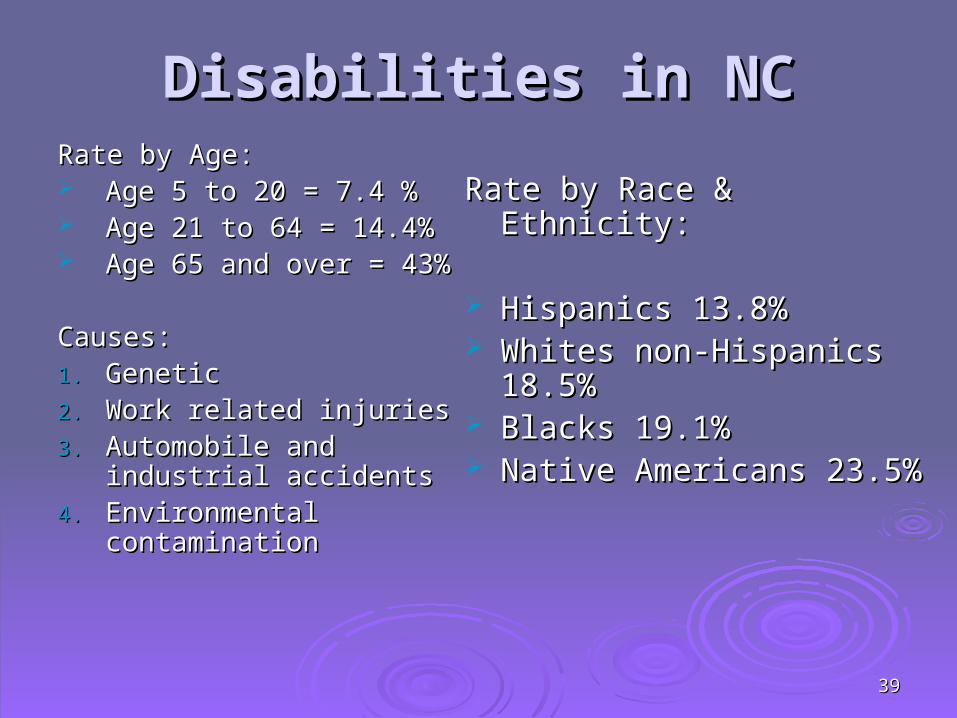
Disabilities in NCDisabilities in NCRate by Age:Rate by Age: Age 5 to 20 = 7.4 %Age 5 to 20 = 7.4 % Age 21 to 64 = 14.4%Age 21 to 64 = 14.4% Age 65 and over = 43%Age 65 and over = 43%
Causes:Causes:1.1. Genetic Genetic 2.2. Work related injuries Work related injuries 3.3. Automobile and Automobile and
industrial accidentsindustrial accidents4.4. Environmental Environmental
contaminationcontamination
Rate by Race & Ethnicity:Rate by Race & Ethnicity:
Hispanics 13.8%Hispanics 13.8% Whites non-Hispanics 18.5%Whites non-Hispanics 18.5% Blacks 19.1%Blacks 19.1% Native Americans 23.5%Native Americans 23.5%
4040
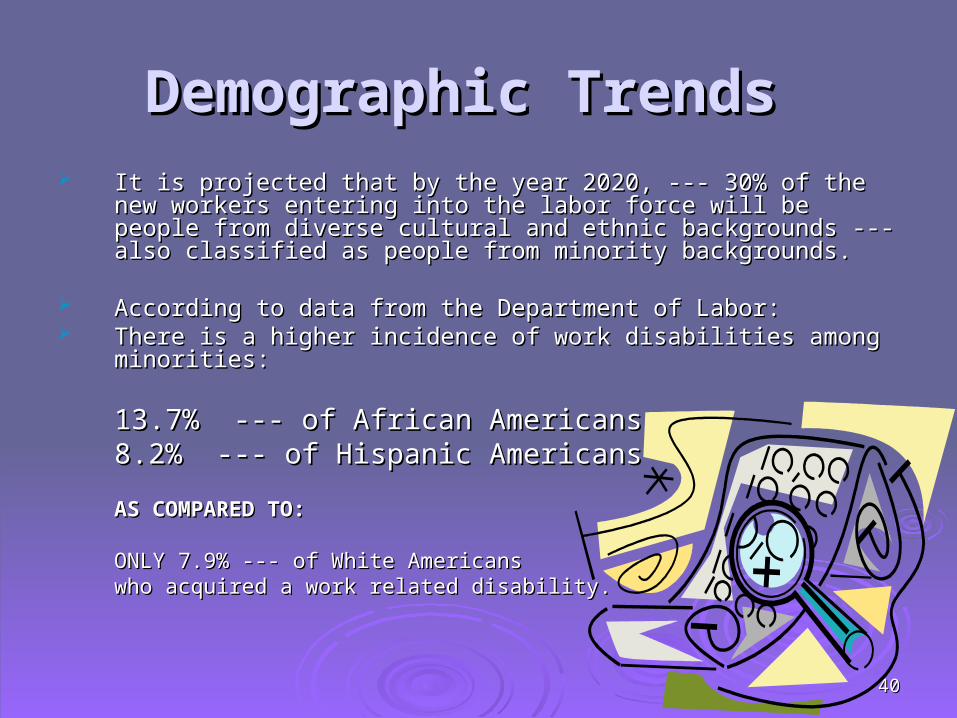
Demographic TrendsDemographic Trends It is projected that by the year 2020, --- 30% of the new workers It is projected that by the year 2020, --- 30% of the new workers
entering into the labor force will be people from diverse cultural entering into the labor force will be people from diverse cultural and ethnic backgrounds --- also classified as people from minority and ethnic backgrounds --- also classified as people from minority backgrounds. backgrounds.
According to data from the Department of Labor:According to data from the Department of Labor: There is a higher incidence of work disabilities among minorities:There is a higher incidence of work disabilities among minorities:
13.7% --- of African Americans 13.7% --- of African Americans 8.2% --- of Hispanic Americans8.2% --- of Hispanic Americans
AS COMPARED TO:AS COMPARED TO:
ONLY 7.9% --- of White Americans ONLY 7.9% --- of White Americans who acquired a work related disability.who acquired a work related disability.
4141
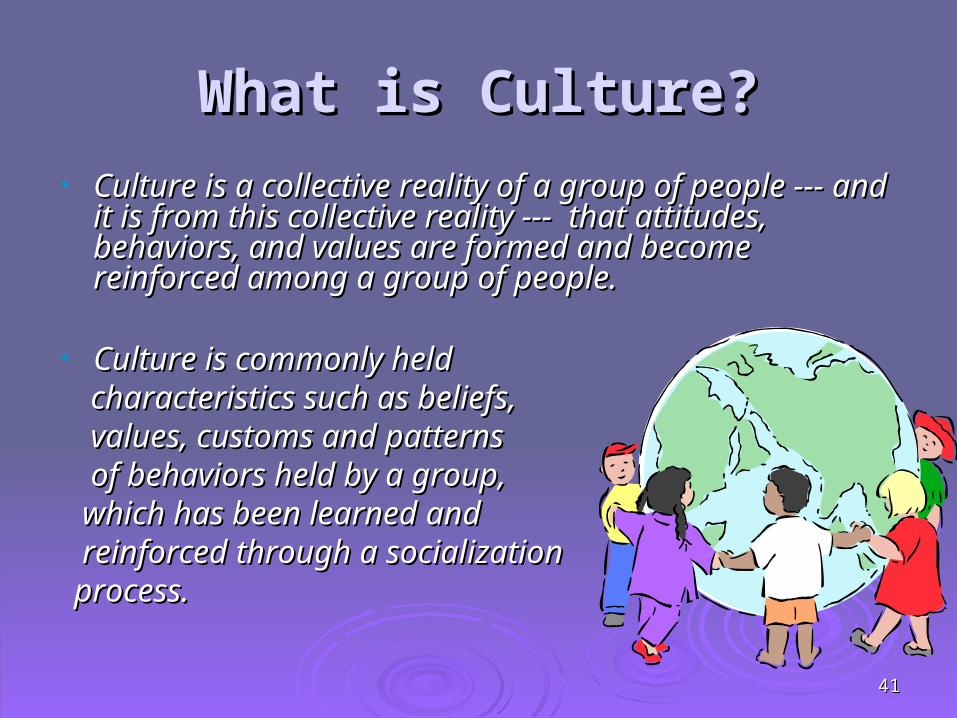
What is Culture?What is Culture?• Culture is a collective reality of a group of people --- and Culture is a collective reality of a group of people --- and
it is from this collective reality --- that attitudes, it is from this collective reality --- that attitudes, behaviors, and values are formed and become behaviors, and values are formed and become reinforced among a group of people.reinforced among a group of people.
• Culture is commonly held Culture is commonly held characteristics such as beliefs,characteristics such as beliefs, values, customs and patterns values, customs and patterns of behaviors held by a group, of behaviors held by a group, which has been learned and which has been learned and reinforced through a socializationreinforced through a socialization process.process.
4242
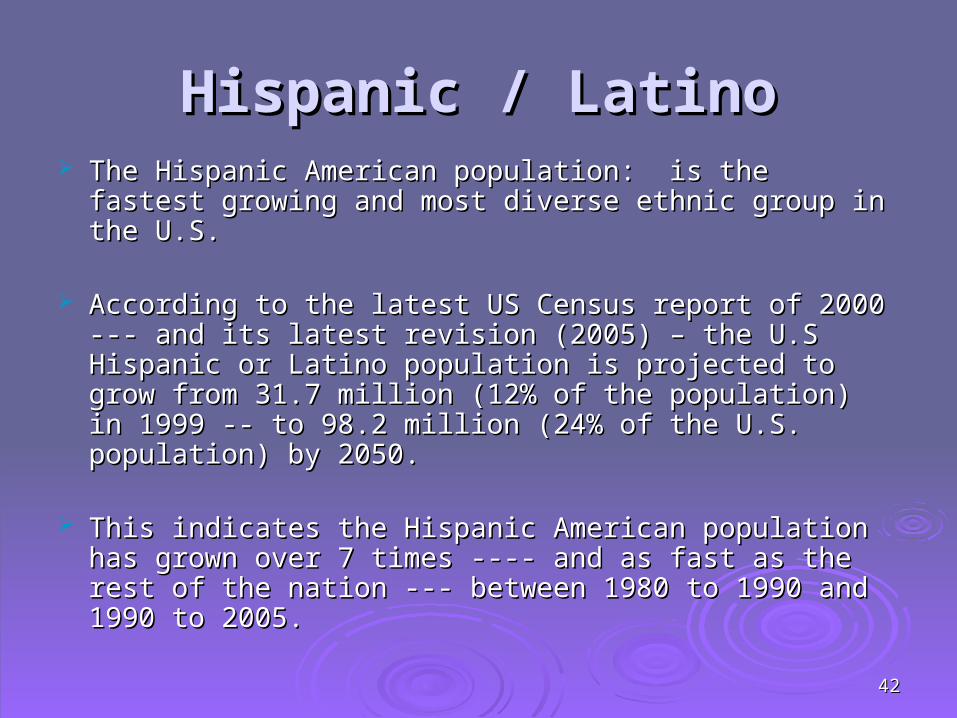
Hispanic / LatinoHispanic / Latino The Hispanic American population: is the fastest The Hispanic American population: is the fastest
growing and most diverse ethnic group in the U.S.growing and most diverse ethnic group in the U.S.
According to the latest US Census report of 2000 --- and According to the latest US Census report of 2000 --- and its latest revision (2005) – the U.S Hispanic or Latino its latest revision (2005) – the U.S Hispanic or Latino population is projected to grow from 31.7 million (12% of population is projected to grow from 31.7 million (12% of the population) in 1999 -- to 98.2 million (24% of the U.S. the population) in 1999 -- to 98.2 million (24% of the U.S. population) by 2050.population) by 2050.
This indicates the Hispanic American population has This indicates the Hispanic American population has grown over 7 times ---- and as fast as the rest of the grown over 7 times ---- and as fast as the rest of the nation --- between 1980 to 1990 and 1990 to 2005.nation --- between 1980 to 1990 and 1990 to 2005.

4343
Hispanic is not a racial group – it is an ethnic group Hispanic is not a racial group – it is an ethnic group (including White Europeans, Blacks, Asians of various (including White Europeans, Blacks, Asians of various ethnic groups including indigenous and “mestizos”).ethnic groups including indigenous and “mestizos”).
Hispanics are united by a common language – but not all Hispanics are united by a common language – but not all Hispanics are fluent in the Spanish language.Hispanics are fluent in the Spanish language.
15.3 % --- have some type of disability (US).15.3 % --- have some type of disability (US).
They are mostly affected by what is labeled as They are mostly affected by what is labeled as “preventable causes of disability.” “preventable causes of disability.”
HispanicHispanic

4444
Access to Health Care among Access to Health Care among Hispanic Women: U.S., 2000-2002*Hispanic Women: U.S., 2000-2002*
Among the nation’s 33.4 million Hispanic women:Among the nation’s 33.4 million Hispanic women:
• 31% do not have health insurance coverage; 31% do not have health insurance coverage; • 20% do not have a usual clinic to go for medical 20% do not have a usual clinic to go for medical
care; and care; and • 22% experienced unmet health 22% experienced unmet health
care needs during the past year care needs during the past year due to cost.due to cost.
*Centers for Disease Control and *Centers for Disease Control and Prevention (CDC, 2005) Prevention (CDC, 2005)

4545
Lack of access to health care Lack of access to health care creates health disparities.creates health disparities.
4646
What is “Health Disparity?”What is “Health Disparity?”
A health disparity is a difference in health A health disparity is a difference in health
status that is persistent across subgroups ofstatus that is persistent across subgroups of
a population. a population.
Source: http://www.health.state.mn.us/Source: http://www.health.state.mn.us/

4747
Consequences of Health DisparitiesConsequences of Health Disparities Absence of and poor health care contributes to chronic Absence of and poor health care contributes to chronic
illnesses.illnesses.
Chronic illnesses become permanent disabilities.Chronic illnesses become permanent disabilities.
Disabilities may become complicated by secondary Disabilities may become complicated by secondary disabling conditions.disabling conditions.
There is close correlation between disability and poverty.There is close correlation between disability and poverty.
25% of the population diagnosed as disabled is living at 25% of the population diagnosed as disabled is living at poverty level or lower.poverty level or lower.
4848
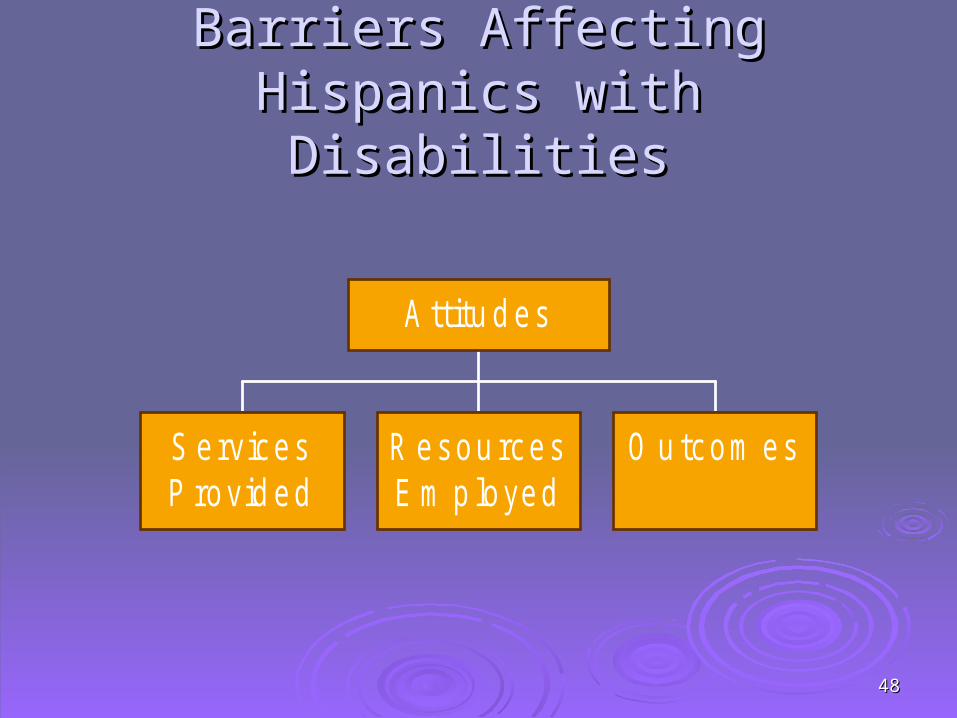
Barriers Affecting Hispanics with Barriers Affecting Hispanics with DisabilitiesDisabilities
S ervicesP rovid ed
R esou rcesE m p loyed
O u tcom es
A ttitu d es
4949
Health Disparities among Health Disparities among Persons with DisabilitiesPersons with Disabilities
Less health insurance coverage and use of the Less health insurance coverage and use of the health care systems.health care systems.
Higher rates of chronic illnesses and secondary Higher rates of chronic illnesses and secondary conditions.conditions.
Lower rates of social participation.Lower rates of social participation. Lower rates of recommended health behaviors Lower rates of recommended health behaviors
(e.g. smoking cessation, diet, etc).(e.g. smoking cessation, diet, etc). Less participation in health screening (women Less participation in health screening (women
with disabilities).with disabilities).

5050
Health & Disability DisparitiesHealth & Disability Disparities
Over 53 million Americans have either a severe Over 53 million Americans have either a severe or a non severe disabilityor a non severe disability
Disparities in rates of disability are pronounced Disparities in rates of disability are pronounced for culturally diverse groupsfor culturally diverse groups
Hispanic Americans with disabilities are second Hispanic Americans with disabilities are second to African Americans with disabilities with a to African Americans with disabilities with a 20.0% 20.0%
Self-reported health status is one of the lowest Self-reported health status is one of the lowest at: 30.4% for Good and 47.7% for Poor health.at: 30.4% for Good and 47.7% for Poor health.

5151
Health & Disability Disparities: Health & Disability Disparities: Social and Economic Burden Social and Economic Burden
Persons with disabilities are less likely to Persons with disabilities are less likely to be meaningfully employed.be meaningfully employed.
Severity of disability impacts employment Severity of disability impacts employment status -- as well as quality of employment.status -- as well as quality of employment.
Women with disabilities are at higher risk Women with disabilities are at higher risk for unemployment and low socioeconomic for unemployment and low socioeconomic status.status.
5252
Cultural SensitivityCultural Sensitivity
A good starting point to implement good A good starting point to implement good practices of health care services and improve practices of health care services and improve health equity -- begins with health equity -- begins with Cultural Sensitivity:Cultural Sensitivity:
Being aware of your own cultural feelings and Being aware of your own cultural feelings and
that of others.that of others. Respect to cultural implications.Respect to cultural implications. Reasonable accommodations and flexibility.Reasonable accommodations and flexibility. Culturally based services and outreach. Culturally based services and outreach.
5353
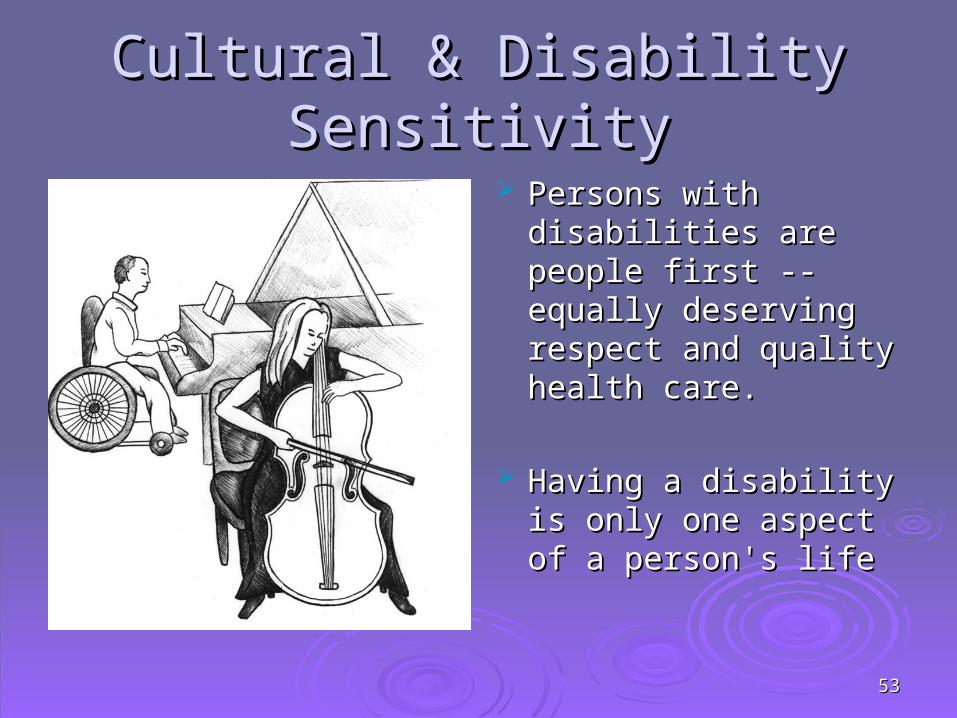
Cultural & Disability SensitivityCultural & Disability Sensitivity
Persons with Persons with disabilities are disabilities are people first -- people first -- equally deserving equally deserving respect and quality respect and quality health care. health care.
Having a disability Having a disability is only one aspect is only one aspect of a person's life of a person's life

5454
Cultural CompetenceCultural Competence IndividualIndividual -The ability to communicate effectively -The ability to communicate effectively
with individuals representing diverse racial and with individuals representing diverse racial and ethnic heritages.ethnic heritages.
OrganizationOrganization -The ability to be responsive to -The ability to be responsive to diverse cultural, ethnic, or linguistic clientele.diverse cultural, ethnic, or linguistic clientele.
ResearchResearch - evaluate changing demographics, - evaluate changing demographics,
culturally-based consumer-centered services, culturally-based consumer-centered services, and validation of best practices as key for and validation of best practices as key for increasing cultural competence.increasing cultural competence.
5555
Why is Cultural Competence Why is Cultural Competence important to avoid health important to avoid health
disparities?disparities?
Patient diversityPatient diversity Concepts of illness and healthcareConcepts of illness and healthcare Changing expectations in Changing expectations in
the medical and other the medical and other
health care fields.health care fields.

5656
Unequal Treatment: Confronting Racial andEthnic Barriers in Health Care, (CDC. 03.2002)
5757
Important cultural factors for providing Important cultural factors for providing services to Hispanic Americansservices to Hispanic Americans
Perception of health and disabilities varies.Perception of health and disabilities varies. Cultural perception of mental illness may cause Cultural perception of mental illness may cause
difficulties in identifying and gaining support from the difficulties in identifying and gaining support from the family. family.
Long-term rehabilitation and lack of coping skills may be Long-term rehabilitation and lack of coping skills may be treated as being “weak” or “irresponsible”.treated as being “weak” or “irresponsible”.
If disability may be perceived as something that cannot If disability may be perceived as something that cannot change (fate) and efforts are placed on adjusting vs. change (fate) and efforts are placed on adjusting vs. treatment and rehabilitation.treatment and rehabilitation.
Endurance is a cultural value. Endurance is a cultural value.
5858
Hispanic FamilyHispanic Family Traditionally, members of the nuclear Traditionally, members of the nuclear
family are the most important source of family are the most important source of support and guidance in many different support and guidance in many different situations.situations.
The extended family and friends safety-net The extended family and friends safety-net is an additional support system. is an additional support system.
Outside help is avoided if possible with the Outside help is avoided if possible with the exception of Clergy or Doctors. exception of Clergy or Doctors.

5959
The idea of needing The idea of needing "professional counseling, "professional counseling, therapy or social services" has certain therapy or social services" has certain
negative connotations --- not very negative connotations --- not very appealing to a traditional Hispanic family.appealing to a traditional Hispanic family.
The perception of service systems is The perception of service systems is directly affected by their cultural values directly affected by their cultural values and beliefs. and beliefs.
6060
Common Emotional Reactions of Common Emotional Reactions of Family MembersFamily Members
Take into consideration the impact of Take into consideration the impact of disability on the family and the family role disability on the family and the family role of the person with the disability.of the person with the disability.
6161
Common Emotional Reactions of Common Emotional Reactions of Family MembersFamily Members
Depression:Depression:
Depression is a common and long-term Depression is a common and long-term consequence of disability. Depression consequence of disability. Depression
may be expressed as anger.may be expressed as anger.

6262
Anxiety:Anxiety:Anxiety is a common reactionAnxiety is a common reactionto the chaotic change and to the chaotic change and uncertainties that follows the onset of a uncertainties that follows the onset of a disability. disability.
Challenges with emotional liability and Challenges with emotional liability and coping with the situation can create an coping with the situation can create an atmosphere of sustained anxiety.atmosphere of sustained anxiety.

6363
Anger:Anger:
Anger has been reported as a common Anger has been reported as a common consequence of injury related disability consequence of injury related disability and to frustration. and to frustration.

6464
Prolonged Emotional Distress:Prolonged Emotional Distress:
The effects of adjusting to a disability mayThe effects of adjusting to a disability may
persist for a long time. Physicalpersist for a long time. Physical
and mental exhaustion can reduceand mental exhaustion can reduce
coping ability, diminish hope,coping ability, diminish hope,
and exacerbate emotional distress.and exacerbate emotional distress.

6565
Working with Culturally, Ethnically and Working with Culturally, Ethnically and Linguistically Diverse GroupsLinguistically Diverse Groups
Identify the cultural and linguistic background of Identify the cultural and linguistic background of the individual with the disability and his/her the individual with the disability and his/her immediate family members.immediate family members.
Learn about their culture, beliefs, and values Learn about their culture, beliefs, and values and how these affect their attitudes toward and how these affect their attitudes toward disabilities.disabilities.
Understand the cultural implications and how Understand the cultural implications and how individuals manage mental and physical individuals manage mental and physical illnesses.illnesses.

6666
Language BarriersLanguage Barriers
Use qualified interpreters and translators Use qualified interpreters and translators with appropriate training.with appropriate training.
Preferably a person that is not related to Preferably a person that is not related to the individual. the individual.
Adopt the Standards onAdopt the Standards on
Culturally and LinguisticallyCulturally and Linguistically
Appropriate Services (CLASS)Appropriate Services (CLASS)

6767
Research Needs to Eliminate Research Needs to Eliminate Health & Disability DisparitiesHealth & Disability Disparities
Cultural CompetenceCultural Competence Culturally based health care practicesCulturally based health care practices Community ParticipationCommunity Participation
Capacity to respond to the increasing Capacity to respond to the increasing needs of the Hispanic population in needs of the Hispanic population in reference to prevention, health care and reference to prevention, health care and eliminating health and disabilities eliminating health and disabilities disparities. disparities.

6868
Recommendations for Future Recommendations for Future Research -- Cultural CompetenceResearch -- Cultural Competence
Evaluate the needs Evaluate the needs for Cultural for Cultural Competence training.Competence training.
Evaluate the Evaluate the outcomes of Cultural outcomes of Cultural Competence in Competence in service delivery.service delivery.
Examine the Examine the awareness and awareness and application of cultural application of cultural factors.factors.
6969
Recommendations for Future Recommendations for Future Research -- Community ParticipationResearch -- Community Participation
Evaluate accessibility Evaluate accessibility in private and public in private and public health care sectors.health care sectors.
Evaluate Health and Evaluate Health and Wellness educational Wellness educational services for youth and services for youth and adults with adults with disabilities.disabilities.
Evaluate the effects Evaluate the effects of lack of education of lack of education and training on and training on service provision.service provision.
Research the impact Research the impact of collaboration of of collaboration of community community participation.participation.

7070
Recommendations for Future Recommendations for Future Research -- ResourcesResearch -- Resources
Research the effectiveness of skills development Research the effectiveness of skills development models for research related to health and models for research related to health and disabilities.disabilities.
Examine how community-based research Examine how community-based research methods provide insight to eliminate health and methods provide insight to eliminate health and disability disparities.disability disparities.
Identify partnership models that can be Identify partnership models that can be developed to facilitate knowledge transfer.developed to facilitate knowledge transfer.
7171
Final ThoughtsFinal Thoughts
A “one size fits all” health care system cannot meet the A “one size fits all” health care system cannot meet the needs of an increasingly diverse American population.needs of an increasingly diverse American population.
Rather than making assumptions, take the time to Rather than making assumptions, take the time to uncover the information you need while fostering a uncover the information you need while fostering a working rapport with culturally diverse clients/patients.working rapport with culturally diverse clients/patients.
It is within our power to make a change and narrow the It is within our power to make a change and narrow the gap of health and disabilities disparities.gap of health and disabilities disparities.
********
7272
ReferencesReferences
E-mail: E-mail: [email protected]@ecu.edu E-mail: E-mail: [email protected]@ecu.edu
https://cccm.thinkculturalhealth.orghttps://cccm.thinkculturalhealth.org A Physician’s Practical Guide To CulturallyA Physician’s Practical Guide To Culturally
Competent CareCompetent Care www.ncminorityhealth.orgwww.ncminorityhealth.org
N. C Office of Minority Health and DisparitiesN. C Office of Minority Health and Disparities www.omhrc.gov www.omhrc.gov
National Office of Minority HealthNational Office of Minority Health www.cdc.govwww.cdc.gov CDC, 2006 CDC, 2006 www.census.govwww.census.gov US Census Bureau review 2005 (a) US Census Bureau review 2005 (a)

7373
MULTUMESC