Embed Size (px)
Citation preview

Stat 13, Intro. to Statistical Methods for the Life and Health Sciences.
1.HandinHW.2.Causationandprediction.3.Multipletestingandpublicationbias.3.RelationshipbetweenCIsandtests.4.Reviewlist.5.Exampleproblems.
NOLECTURETHUNOV3 orTUENOV8. AlsonoofficehourNov8.ThemidtermThuNov10willbeonch1-7.BringaPENCILandCALCULATORandanybooksornotesyouwant.Nocomputers.Allnumericalanswerswillberoundedto3significantdigits.http://www.stat.ucla.edu/~frederic/13/F16.
1

1.HandinHW1.2.Causationandprediction.Notethatforprediction,yousometimesdonotcareaboutconfoundingfactors.*Forecastingwildfireactivityusingtemperature.Warmerweathermaydirectlycausewildfiresviaincreasedeaseofignition,orduetoconfoundingwithpeoplechooseing togocampinginwarmerweather.Itdoesnotreallymatterforthepurposeofmerelypredicting howmanywildfireswilloccurinthecomingmonth.*Thesamegoesforpredictinglifespan,orliverdiseaserates,etc.,usingsmokingasapredictorvariable.

3.Multipletestingandpublicationbias.Ap-valueistheprobability,assumingthenullhypothesisofnorelationshipistrue,thatyouwillseeadifferenceasextremeas,ormoreextremethan,youobserved.So,5%ofthetimeyouarelookingatunrelatedthings,youwillfindastatisticallysignificantrelationship.Thisunderscorestheneedforfollowup confirmationstudies.Iftestingmanyexplanatoryvariablessimultaneously,itcanbecomeverylikelytofindsomethingsignificantevenifnothingisactuallyrelatedtotheresponsevariable.

3.Multipletestingandpublicationbias.*Forexample,ifthesignificancelevelis5%,thenfor100testswhereallnullhypothesesaretrue,theexpectednumberofincorrectrejections(TypeIerrors)is5.Ifthetestsareindependent,theprobabilityofatleastoneTypeIerrorwouldbe99.4%.*Toaddressthisproblem,scientistssometimeschangethesignificancelevelsothat,underthenullhypothesisthatnoneoftheexplanatoryvariablesisrelatedtotheresponsevariable,theprobabilityofrejectingany ofthemis5%.*OnewayistouseBonferroni'scorrection:withm explanatoryvariables,usesignificancelevel5%/m.P(atleast1TypeIerror)willbe≤ m(5%/m)=5%.

P(TypeIerroronexplanatory1)=5%/m.P(TypeIerroronexplanatory2)=5%/m.P(Type1erroronatleastoneexplanatory)≤P(erroron1)+P(erroron2)+...+P(erroronm) =mx5%/m.
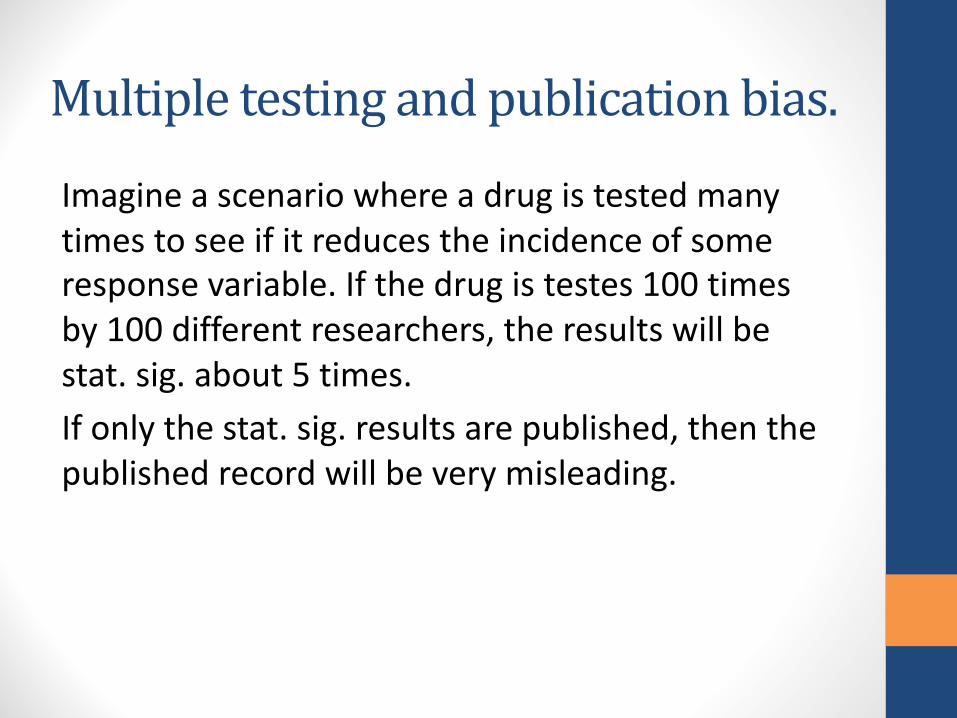
Multipletestingandpublicationbias.
Imagineascenariowhereadrugistestedmanytimestoseeifitreducestheincidenceofsomeresponsevariable.Ifthedrugistestes100timesby100differentresearchers,theresultswillbestat.sig.about5times.Ifonlythestat.sig.resultsarepublished,thenthepublishedrecordwillbeverymisleading.

Multipletestingandpublicationbias.AdrugcalledReboxetine madebyPfizerwasapprovedasatreatmentfordepressioninEuropeandtheUKin2001,basedonpositivetrials.Ameta-analysisin2010foundthatitwasnotonlyineffectivebutalsopotentiallyharmful.Thereportfoundthat74%ofthedataonpatientswhotookpartinthetrialsofReboxetine werenotpublishedbecausethefindingswerenegative.Publisheddataaboutreboxetine overestimateditsbenefitsandunderestimateditsharm.Asubsequent2011analysisindicatedReboxetinemightbeeffectiveforseveredepressionthough.

4.CIsandtests.
Supposewearecomparingdeathratesinatreatmentgroupandacontrolgroup.Weobserveadifferenceof10.2%,doatest,andfindap-valueof8%.Doesthismeanthe95%-CIforthedifferenceindeathratesbetweenthetwogroupswouldcontainzero?

4.CIsandtests.
Supposewearecomparingbloodpressuresinatreatmentgroupandacontrolgroup.Weobserveadifferenceof10.2mm,doa2-sidedtest,andfindap-valueof3%.Wouldthe95%-CIforthedifferenceinbloodpressuresbetweenthetwogroupscontainzero?

4.CIsandtests.
Supposewearecomparingbloodpressuresinatreatmentgroupandacontrolgroup.Weobserveadifferenceof10.2mm,doa2-sidedtest,andfindap-valueof3%.Wouldthe95%-CIforthedifferenceinbloodpressuresbetweenthetwogroupscontainzeroornot?
No.Itwouldnotcontainzero.ForwhatconfidencelevelwouldtheCIjustbarelycontain0?
97%.

4.CIsandtests.Thep-valueis3%.A97%-CIwouldjustcontainzero.
Ho( 95% ) ( 95%-CI)
-----------------------------------------------------------------------------| |0 10.2mm
Ho( 97% )
( 97%-CI )-----------------------------------------------------------------------------
| |0 10.2mm

4.Reviewlist.1.MeaningofSD. 19.Randomsamplingandrandom2.Parametersandstatistics. assignment.3.Zstatisticforproportions. 20.TwoproportionCIsandtesting.4.Simulationandmeaningofpvalues. 21.IQRand5number summaries.5.SEforproportions. 22.CIs for 2means andtesting.6.Whatinfluencespvalues. 23.Paired data.7.CLTandvalidityconditionsfortests. 24.Placeboeffect,adhererbias,8.1-sidedand2-sidedtests. andnonresponsebias.9.Rejectthenullvs.acceptthealternative. 25.Predictionandcausation.10.Samplingandbias. 26.Multipletestingandpublicationbias11.Significancelevel.12.TypeI,typeIIerrors,andpower.13.CIsforaproportion.14.CIsforamean.15.Marginoferror.16.Practicalsignificance.17.Confounding.18.Observationalstudiesandexperiments.

5.Exampleproblems.Somegoodhw problems fromthebookare1.2.18,1.2.19,1.2.20,1.3.17,1.5.18,2.1.38,2.2.6,2.2.24,2.3.3,2.3.25,3.2.11,3.2.12,3.3.8,3.3.19,3.3.22,3.5.23,4.1.14,4.1.18,5.2.2,5.2.10,5.2.24,5.3.11,5.3.21,5.3.24,6.2.23,6.3.1,6.3.12,6.3.22,6.3.23,7.2.20,7.2.24,7.3.7,7.3.24.

5.Exampleproblems.NCISwasatop-ratedtv showin2014.Itiscurrently3rd in2016.Astudyfindsthatinacertaincity,peoplewhowatchNCISaremuchmorelikelytodiethanpeoplewhodonotwatchNCIS.CanweconcludethatNCISisadangeroustv showtowatch?

5.Exampleproblems.NCISwasatop-ratedtv showin2014.Itiscurrently3rd in2016.Astudyfindsthatinacertaincity,peoplewhowatchNCISaremuchmorelikelytodiethanpeoplewhodonotwatchNCIS.CanweconcludethatNCISisadangeroustv showtowatch?
No.Ageisaconfoundingfactor.Themedianageofavieweris61yearsold.

5.Exampleproblems.Intheportacaval shuntexample,whydidthestudieswithhistoricalcontrolsfindthattheportacaval shuntseemedtobeassociatedwithlowerdeathrates?a.Thosegettingtheshuntsmokedmore.b.Thosegettingtheshuntwerehealthier.c.Thosegettingtheshuntweregeneticallypredisposedtodieyounger.d.Theexplanatoryvariableisaconfoundingfactort-testwith95%centrallimittheorem.

5.Exampleproblems.Intheportacaval shuntexample,whydidthestudieswithhistoricalcontrolsfindthattheportacaval shuntseemedtobeassociatedwithlowerdeathrates?
b.Thosegettingtheshuntwerehealthier.

5.Exampleproblems.Supposeyousample100UCLAstudentsand802ndgradersandrecordtheirbloodglucoselevels.ThemeanatUCLAis5.5mmol/L,withanSDof1.5,andthemeanin2nd gradeis7.5mmol/L,withanSDof2.2.a.Finda95%-CIforhowmuchlessanaverageUCLAstudent'sbloodglucoselevelisthananaverage2ndgrader.
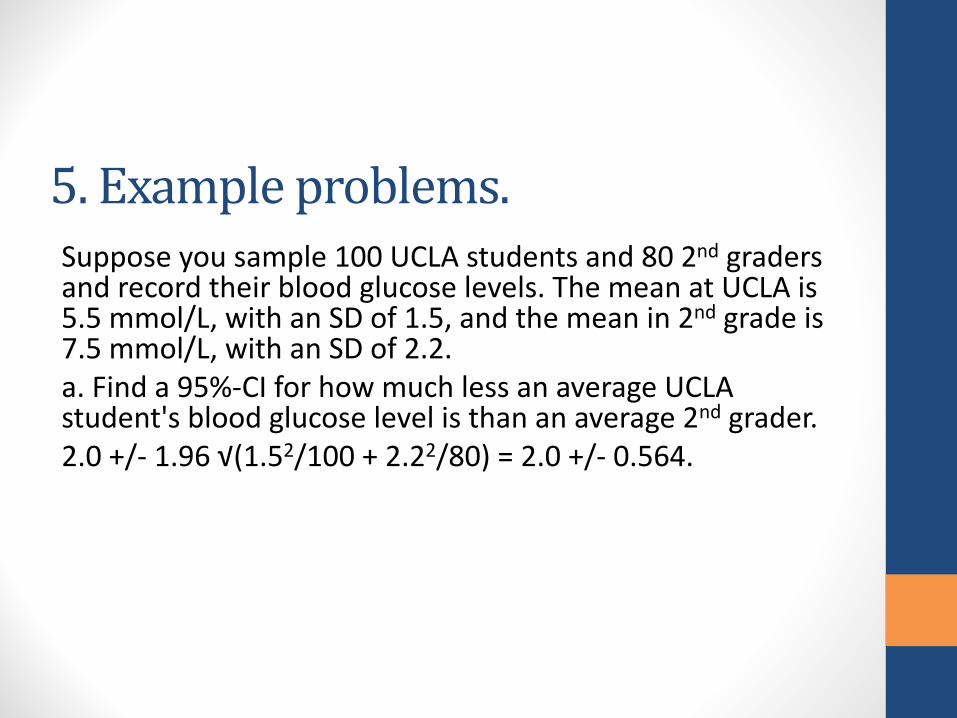
5.Exampleproblems.Supposeyousample100UCLAstudentsand802nd gradersandrecordtheirbloodglucoselevels.ThemeanatUCLAis5.5mmol/L,withanSDof1.5,andthemeanin2nd gradeis7.5mmol/L,withanSDof2.2.a.Finda95%-CIforhowmuchlessanaverageUCLAstudent'sbloodglucoselevelisthananaverage2nd grader.2.0+/- 1.96√(1.52/100+2.22/80)=2.0+/- 0.564.

5.Exampleproblems.Supposeyousample100UCLAstudentsand802ndgradersandrecordtheirbloodglucoselevels.ThemeanatUCLAis5.5mmol/L,withanSDof1.5,andthemeanin2nd gradeis7.5mmol/L,withanSDof2.2.b.IsthedifferenceobservedbetweenthemeanbloodglucoseatUCLAandin2nd gradestatisticallysignificant?

5.Exampleproblems.Supposeyousample100UCLAstudentsand802nd gradersandrecordtheirbloodglucoselevels.ThemeanatUCLAis5.5mmol/L,withanSDof1.5,andthemeanin2nd gradeis7.5mmol/L,withanSDof2.2.b.IsthedifferenceobservedbetweenthemeanbloodglucoseatUCLAandin2nd gradestatisticallysignificant?Yes.The95%-CIdoesnotcomeclosetocontaining0.

5.Exampleproblems.Supposeyousample100UCLAstudentsand802ndgradersandrecordtheirbloodglucoselevels.ThemeanatUCLAis5.5mmol/L,withanSDof1.5,andthemeanin2nd gradeis7.5mmol/L,withanSDof2.2.c.Isthisanobservationalstudyoranexperiment?

5.Exampleproblems.Supposeyousample100UCLAstudentsand802ndgradersandrecordtheirbloodglucoselevels.ThemeanatUCLAis5.5mmol/L,withanSDof1.5,andthemeanin2nd gradeis7.5mmol/L,withanSDof2.2.c.Isthisanobservationalstudyoranexperiment?Observationalstudy.

5.Exampleproblems.Supposeyousample100UCLAstudentsand802ndgradersandrecordtheirbloodglucoselevels.ThemeanatUCLAis5.5mmol/L,withanSDof1.5,andthemeanin2nd gradeis7.5mmol/L,withanSDof2.2.d.DoesgoingtoUCLAcauseyourbloodglucoseleveltodrop?

5.Exampleproblems.Supposeyousample100UCLAstudentsand802nd gradersandrecordtheirbloodglucoselevels.ThemeanatUCLAis5.5mmol/L,withanSDof1.5,andthemeanin2nd gradeis7.5mmol/L,withanSDof2.2.d.DoesgoingtoUCLAcauseyourbloodglucoseleveltodrop?No.Ageisaconfoundingfactor.Youngkidseatmorecandy.

5.Exampleproblems.Supposeyousample100UCLAstudentsand802nd gradersandrecordtheirbloodglucoselevels.ThemeanatUCLAis5.5mmol/L,withanSDof1.5,andthemeanin2nd gradeis7.5mmol/L,withanSDof2.2.e.Themeanbloodglucoselevelofall43,301UCLAstudentsisaparameter randomvariable t-test

5.Exampleproblems.Supposeyousample100UCLAstudentsand802nd gradersandrecordtheirbloodglucoselevels.ThemeanatUCLAis5.5mmol/L,withanSDof1.5,andthemeanin2nd gradeis7.5mmol/L,withanSDof2.2.e.Themeanbloodglucoselevelofall43,301UCLAstudentsisaparameter

5.Exampleproblems.Supposeyousample100UCLAstudentsand802nd gradersandrecordtheirbloodglucoselevels.ThemeanatUCLAis5.5mmol/L,withanSDof1.5,andthemeanin2nd gradeis7.5mmol/L,withanSDof2.2.f.Ifwetookanothersampleof100UCLAstudentsand802ndgraders,andusedthedifferenceinsamplemeanstoestimatethedifferenceinpopulationmeans,howmuchwouldittypicallybeoffby?

5.Exampleproblems.Supposeyousample100UCLAstudentsand802ndgradersandrecordtheirbloodglucoselevels.ThemeanatUCLAis5.5mmol/L,withanSDof1.5,andthemeanin2nd gradeis7.5mmol/L,withanSDof2.2.f.Ifwetookanothersampleof100UCLAstudentsand802nd graders,andusedthedifferenceinsamplemeanstoestimatethedifferenceinpopulationmeans,howmuchwouldittypicallybeoffby? SE=√(1.52/100+2.22/80)=.288mmol/L

5.Exampleproblems.Supposeyousample100UCLAstudentsand802ndgradersandrecordtheirbloodglucoselevels.ThemeanatUCLAis5.5mmol/L,withanSDof1.5,andthemeanin2nd gradeis7.5mmol/L,withanSDof2.2.g.HowmuchdoesoneUCLAstudent'sbloodglucoseleveltypicallydifferfromthemeanofUCLAstudents?

5.Exampleproblems.Supposeyousample100UCLAstudentsand802ndgradersandrecordtheirbloodglucoselevels.ThemeanatUCLAis5.5mmol/L,withanSDof1.5,andthemeanin2nd gradeis7.5mmol/L,withanSDof2.2.g.HowmuchdoesoneUCLAstudent'sbloodglucoseleveltypicallydifferfromthemeanofUCLAstudents?1.5mmoL/L.

Dobikehelmetsmakeyoulesslikelytogetintoacollision?StudyAlookedatdatafrom40States,theyearbeforeandtheyearafterimplementingmandatoryhelmetlaws.Theyhadmillionsofobservations.IneveryState,asignificantlyhigherpercentageofcyclistsworehelmetstheyearafterthelawwaspassedthantheyearbefore.Combiningdatafromall40States,studyAfoundnosignificantdifferenceincollisionratesbeforeorafterthelawwaspassed.StudyBsurveyed1000peoplewhoboughtabicycleinthepreviousyear,andfoundthatasignificantlylowerpercentageofthosewhoworehelmetshadbeenincollisions.

StudyAlookedatdatafrom40States,andfoundnosignificantdifferenceincollisionratesbeforeorafterthelawwaspassed.StudyBsurveyed1000peoplewhoboughtabicycleinthepreviousyear,andfoundthatasignificantlylowerpercentageofthosewhoworehelmetshadbeenincollisions.Whichstudyismoreconvincing,andwhy?a. StudyA,becausethesamplesizeinstudyBistoosmalltobe
representativeofthepopulation.b. StudyB,becauseitisunclearwhetherstudyAisanexperimentoran
observationalstudy.c. StudyA,becauseaconfoundingfactorinstudyBishow
conscientiousthebicyclistsare.d. StudyA,becauseithashigherpowerandisstatisticallysignificant.e. StudyA,becauseaconfoundingfactorinstudyBistheweightofthe
bicycle.

Ahistogramofthesimulatedmeandifferencebetweenthebicyclingtoworkwithbike1minusbike2,underHo,isshown.WhatistheSEforthedifference?

Ahistogramofthesimulatedmeandifferencebetweenthebicyclingtoworkwithbike1minusbike2,underHo,isshown.WhatistheSEforthedifference?0.080.

Ahistogramofthesimulatedmeandifferencebetweenthebicyclingtoworkwithbike1minusbike2,underHo,isshown.Whatwouldthemarginoferrorbefora95%CI?1.96(0.080)=0.157.