Embed Size (px)
Citation preview
1
Grouping Countries by Grouping Countries by
National Models of National Models of
Technological LearningTechnological Learning
Tatyana P. SoubbotinaTatyana P. Soubbotina
Consultant, S&T ProgramConsultant, S&T Program
HDNEDHDNED
Presentation to STI Thematic GroupPresentation to STI Thematic Group
November 10, 2005November 10, 2005
2
Practical Questions:
1. Should the WB develop some standard guidelines on S&T assistance to client countries?
2. Should these guidelines be customized for groups of developing countries with similar STI capacity-building needs?
3. Should the WB rely on one of the existing classifications of countries by S&T capacity or develop some new approach?
3
Composite Indices of S&T Capacity:
• UNDP – Technology Achievement Index
• UNIDO – Competitive Industrial Performance
Index
• WEF – National Innovative Capacity Index
• WB – Knowledge Economy Index
• UNCTAD –Innovation Capability Index
• Francisco Sagasti – S&T Capacity Index
4
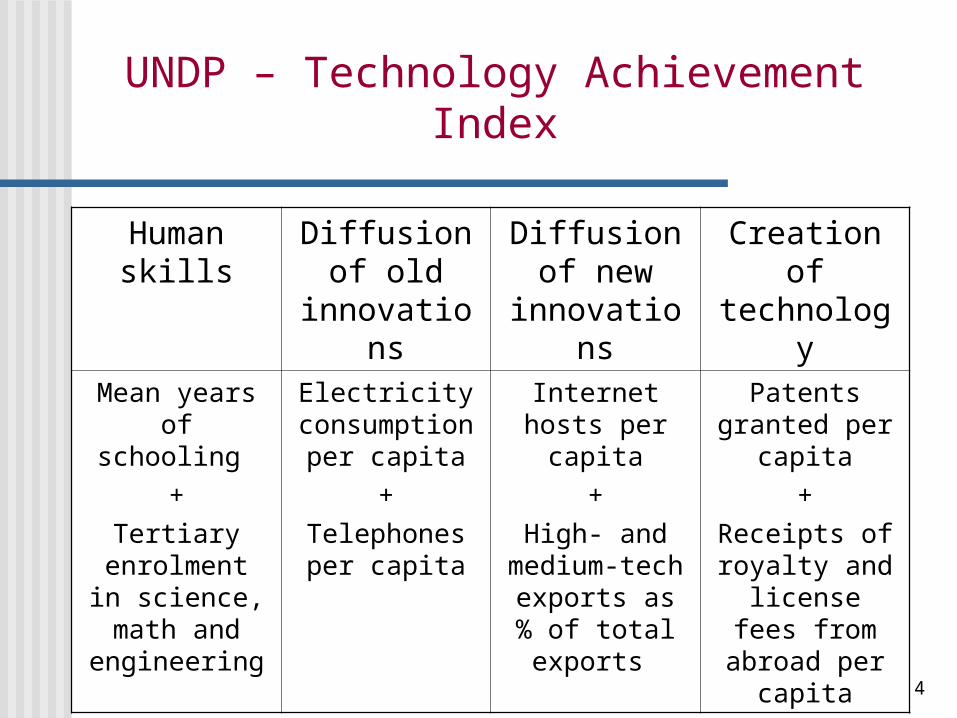
UNDP – Technology Achievement Index
Human skills
Diffusion of old
innovations
Diffusion of new
innovations
Creation of technology
Mean years of schooling
+Tertiary
enrolment in science, math
and engineering
Electricity consumption
per capita+
Telephones per capita
Internet hosts per capita
+High- and
medium-tech exports as %
of total exports
Patents granted per
capita+
Receipts of royalty and license fees from abroad per capita
5
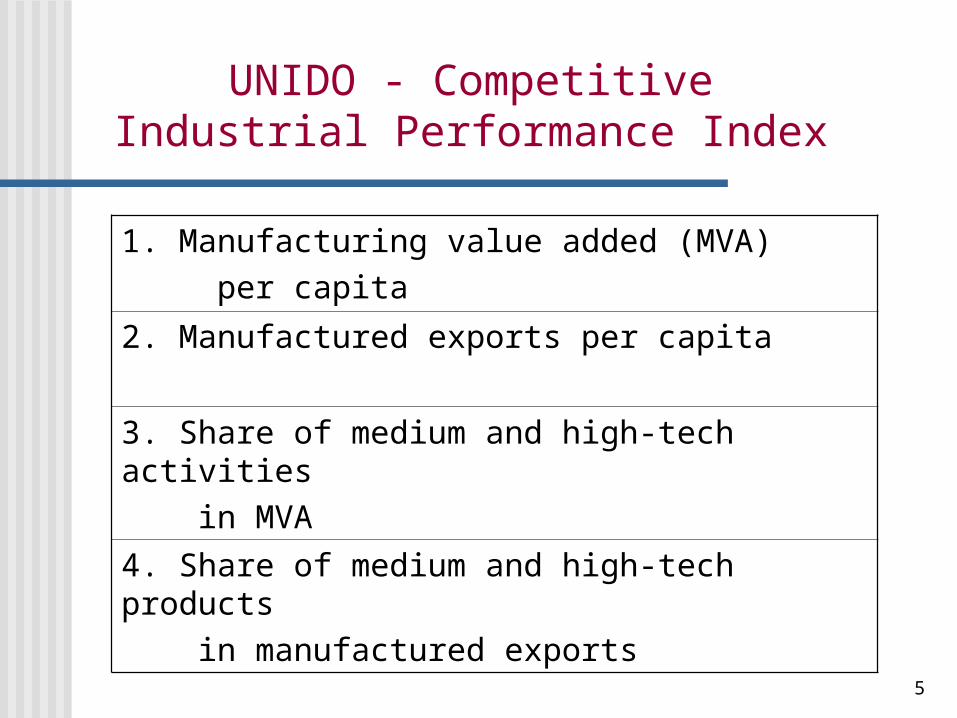
UNIDO - Competitive Industrial Performance Index
1. Manufacturing value added (MVA) per capita
2. Manufactured exports per capita
3. Share of medium and high-tech activities in MVA
4. Share of medium and high-tech products in manufactured exports
6
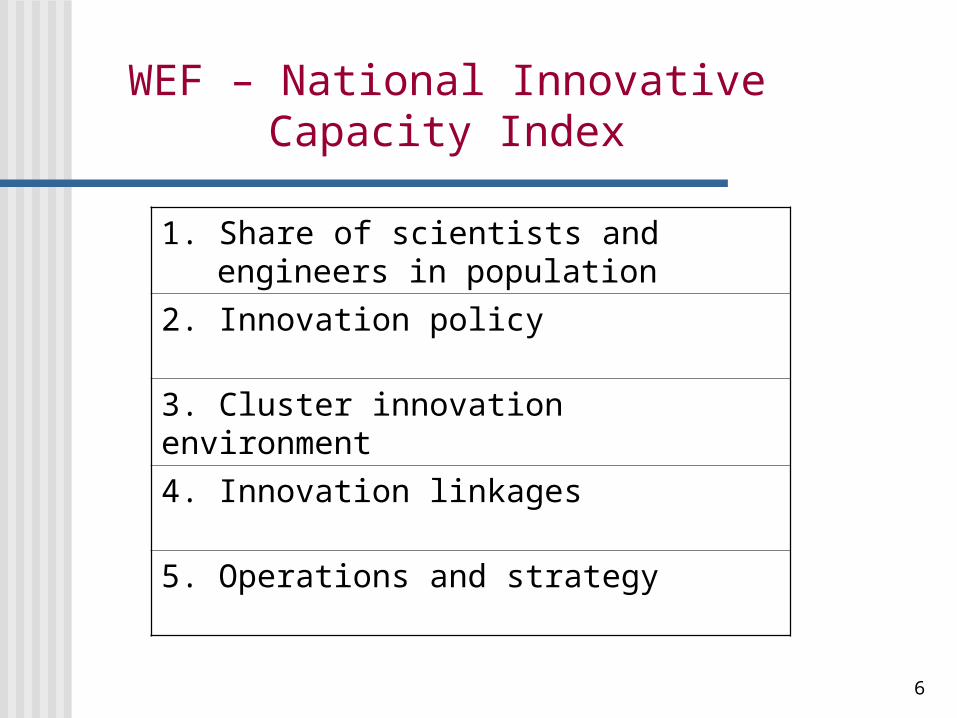
WEF – National Innovative Capacity Index
1. Share of scientists and engineers in population
2. Innovation policy
3. Cluster innovation environment
4. Innovation linkages
5. Operations and strategy
7
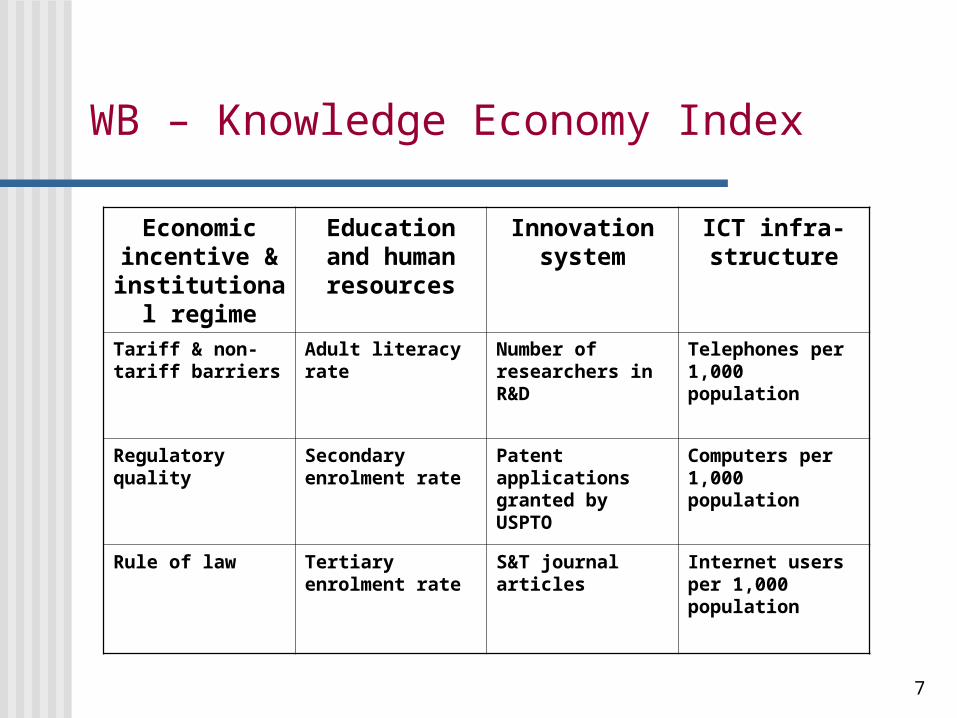
WB – Knowledge Economy Index
Economic incentive & institutional
regime
Education and human resources
Innovation system
ICT infra-structure
Tariff & non-tariff barriers
Adult literacy rate
Number of researchers in R&D
Telephones per 1,000 population
Regulatory quality
Secondary enrolment rate
Patent applications granted by USPTO
Computers per 1,000 population
Rule of law Tertiary enrolment rate
S&T journal articles
Internet users per 1,000 population
8
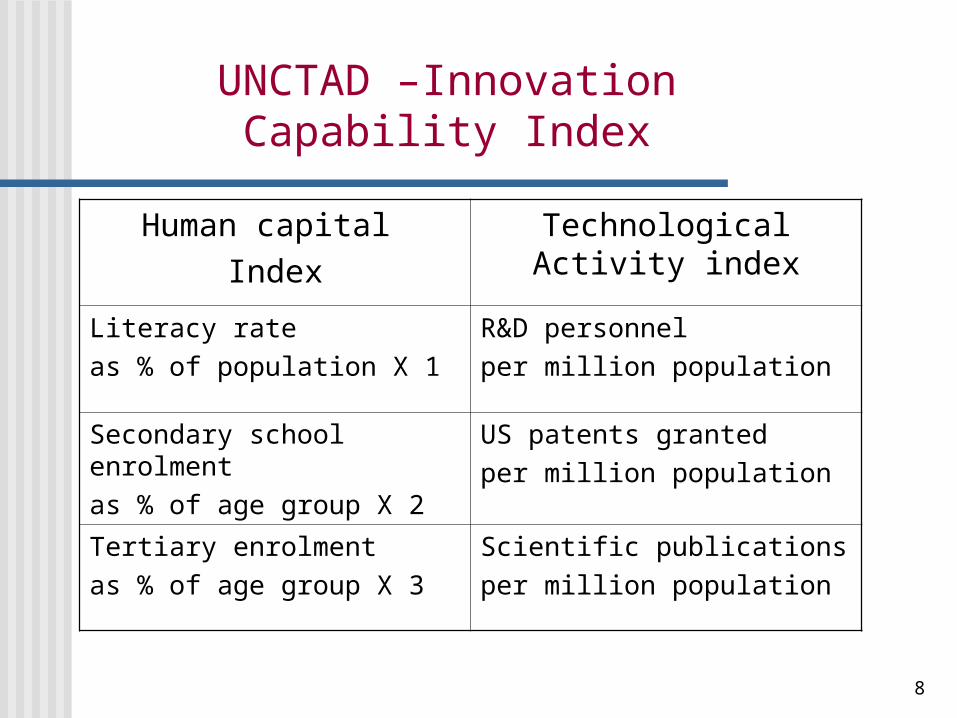
UNCTAD –Innovation Capability Index
Human capital Index
Technological Activity index
Literacy rate as % of population X 1
R&D personnel per million population
Secondary school enrolment as % of age group X 2
US patents granted per million population
Tertiary enrolment as % of age group X 3
Scientific publications per million population
9
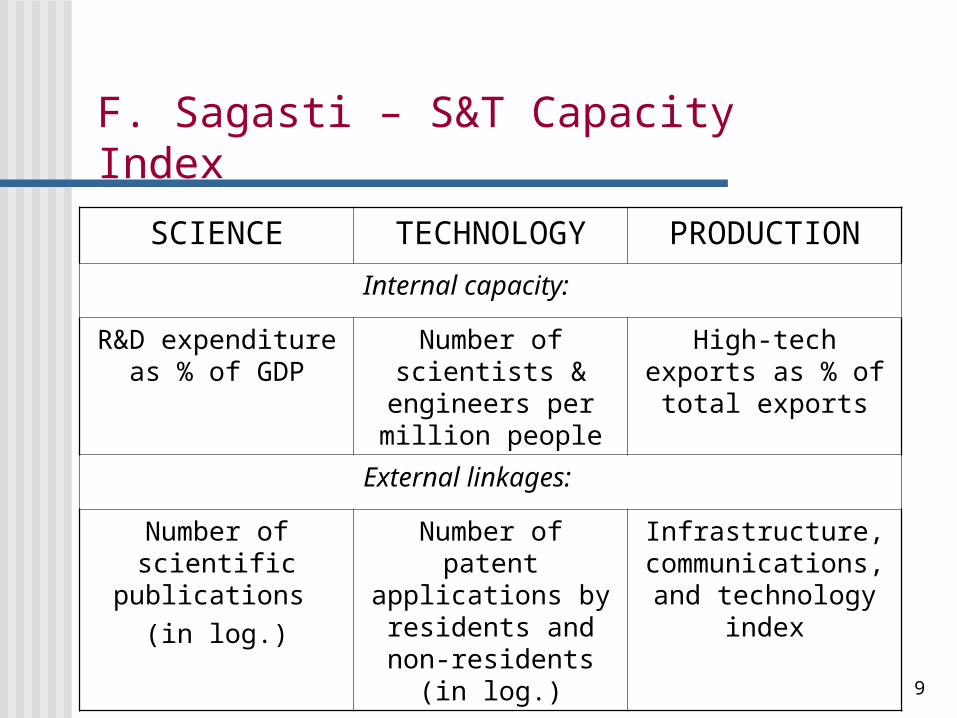
F. Sagasti – S&T Capacity Index
SCIENCE TECHNOLOGY PRODUCTION
Internal capacity:
R&D expenditure as % of GDP
Number of scientists &
engineers per million people
High-tech exports as % of total
exports
External linkages:
Number of scientific
publications (in log.)
Number of patent applications by
residents and non-residents (in log.)
Infrastructure, communications, and technology
index
10
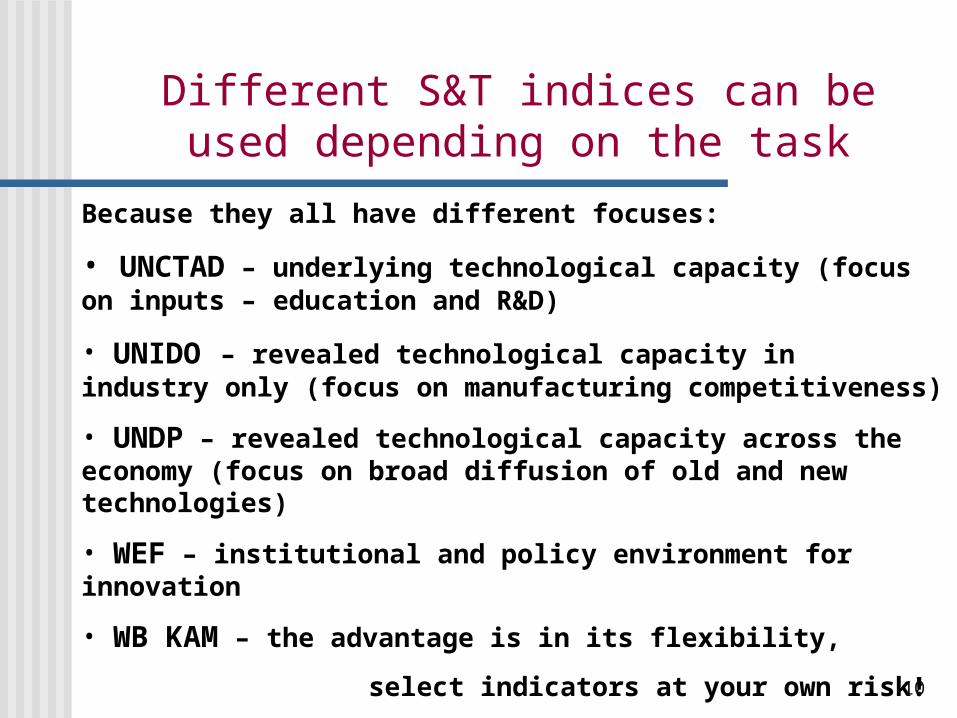
Different S&T indices can be used depending on the task
Because they all have different focuses:
• UNCTAD – underlying technological capacity (focus on inputs – education and R&D)
• UNIDO – revealed technological capacity in industry only (focus on manufacturing competitiveness)
• UNDP – revealed technological capacity across the economy (focus on broad diffusion of old and new technologies)
• WEF – institutional and policy environment for innovation
• WB KAM – the advantage is in its flexibility,
select indicators at your own risk!
11
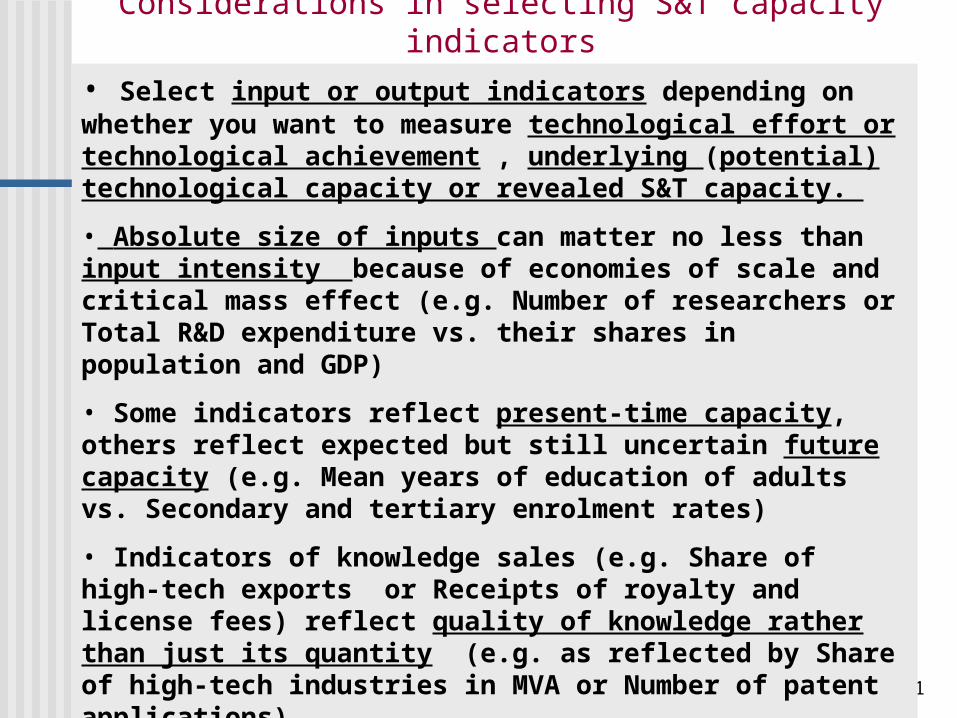
Considerations in selecting S&T capacity indicators• Select input or output indicators depending on whether you want to measure technological effort or technological achievement , underlying (potential) technological capacity or revealed S&T capacity.
• Absolute size of inputs can matter no less than input intensity because of economies of scale and critical mass effect (e.g. Number of researchers or Total R&D expenditure vs. their shares in population and GDP)
• Some indicators reflect present-time capacity, others reflect expected but still uncertain future capacity (e.g. Mean years of education of adults vs. Secondary and tertiary enrolment rates)
• Indicators of knowledge sales (e.g. Share of high-tech exports or Receipts of royalty and license fees) reflect quality of knowledge rather than just its quantity (e.g. as reflected by Share of high-tech industries in MVA or Number of patent applications).
• However, exports indicators should be compared to similar MVA indicators, because fast improvement in exports often reflects enclave FDI activities rather than national S&T capacity growth.
12
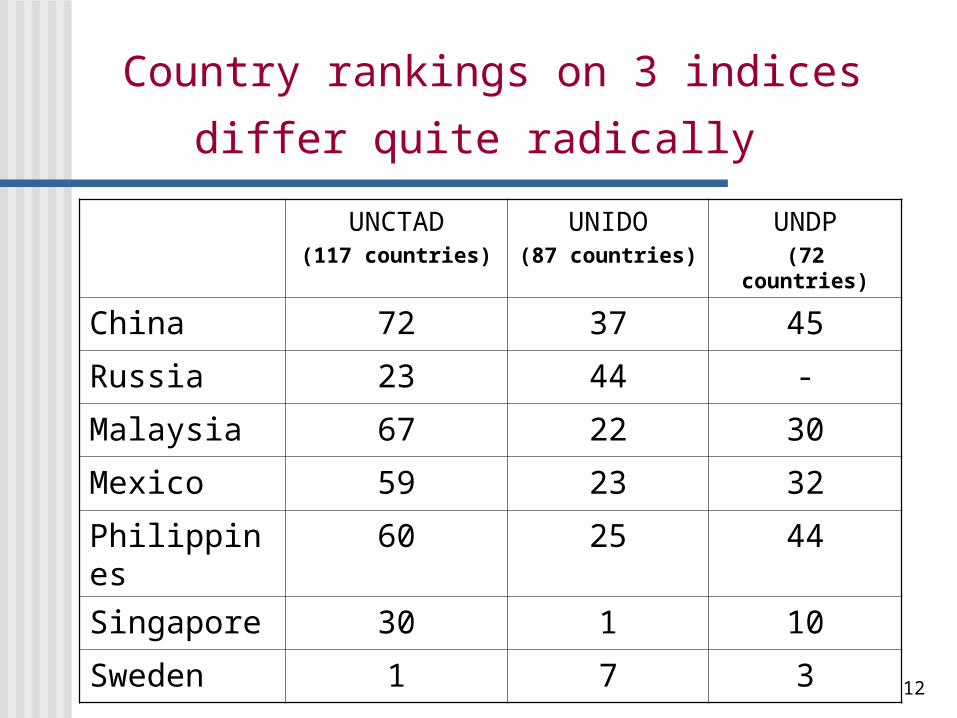
Country rankings on 3 indices differ
quite radically UNCTAD
(117 countries)
UNIDO(87 countries)
UNDP(72 countries)
China 72 37 45
Russia 23 44 -
Malaysia 67 22 30
Mexico 59 23 32
Philippines 60 25 44
Singapore 30 1 10
Sweden 1 7 3
13
All of these groupings focus on
S&T levels achieved or expected to be achieved by various countries, but fail to account for:
•Different speed of S&T progress, and
•Different sources of S&T progress.
That is what grouping countries by models of S&T learning
can add
14
Concept of “National technological learning”
National technological learning is the process of
creating or acquiring from foreign sources of
new (for this particular learner)
S&T knowledge & skills,
as well as
adapting, disseminating, and using those for
improving the technological structure of
national production and exports.
15
National technological learning occurs at all levels
and implies acquiring different kind of
knowledge & skills, e.g. at the level of
• national labor force – science, math, & engineering education & training + life-long learning,
• enterprises & firms – learning to innovate by absorbing foreign and investing in own new technologies,
• governments – learning to receive expert advice, develop S&T strategies and create enabling & stimulating conditions for national technological progress.
16
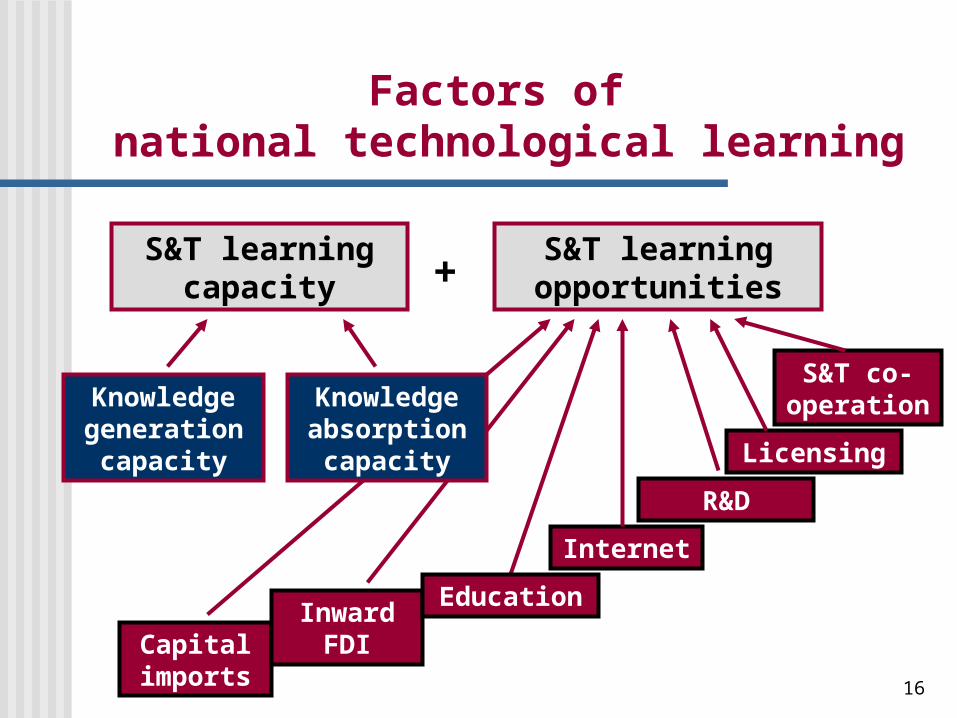
Factors of national technological learning
S&T learning capacity
S&T learning opportunities
Knowledge generation
capacity
Capital imports
Inward FDI
Internet
Licensing
S&T co-operation
+
Knowledge absorption capacity
Education
R&D
17
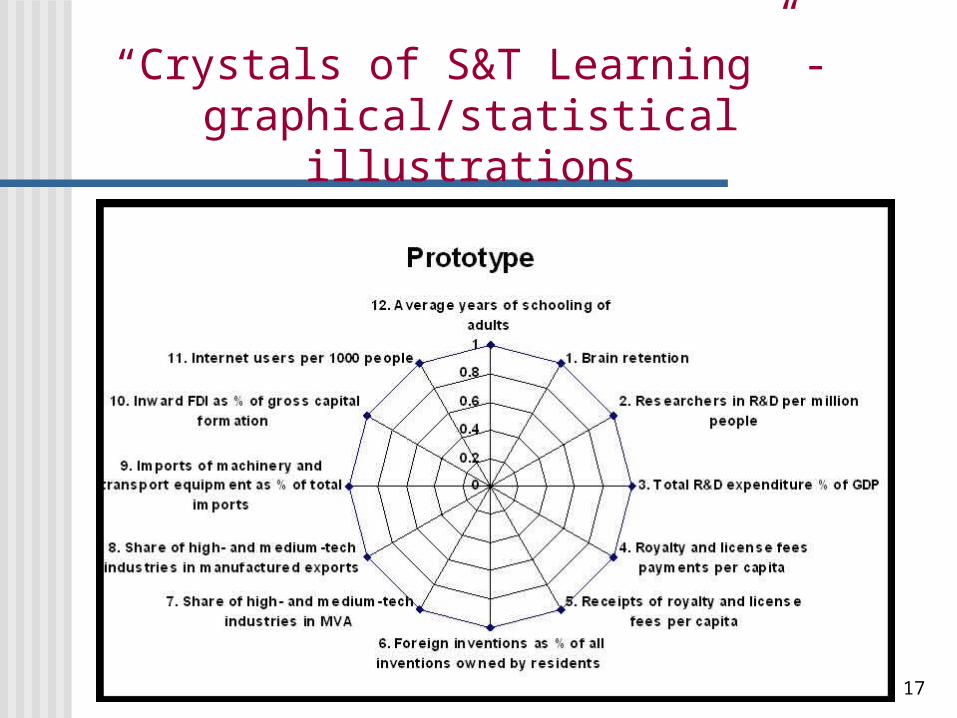
“Crystals of S&T Learning” -graphical/statistical illustrations
18
“Crystals of S&T Learning” -graphical/statistical illustrations
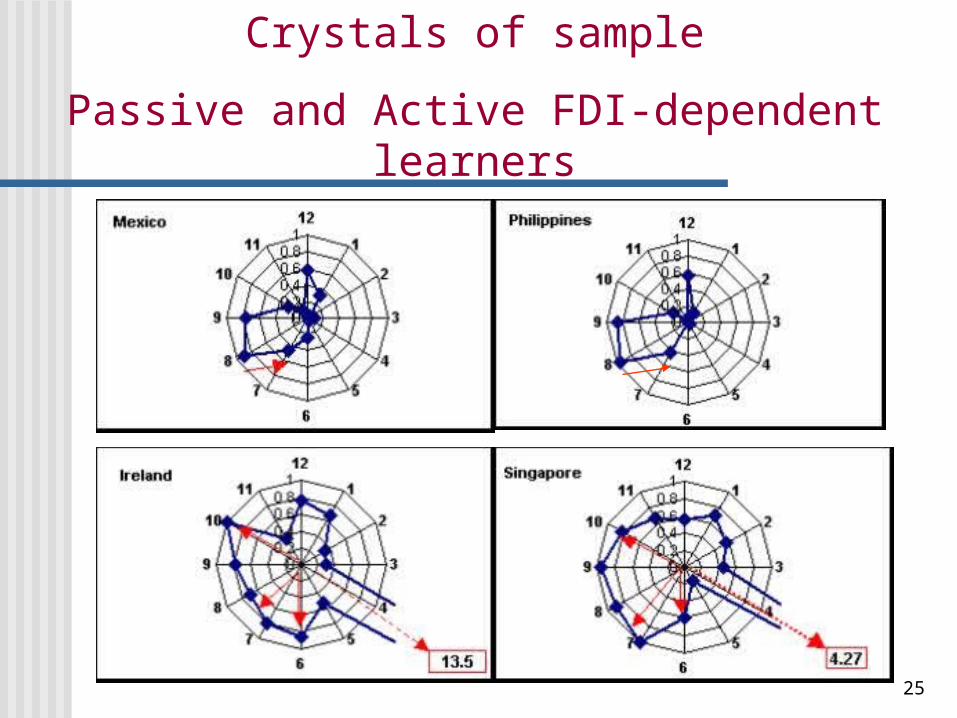
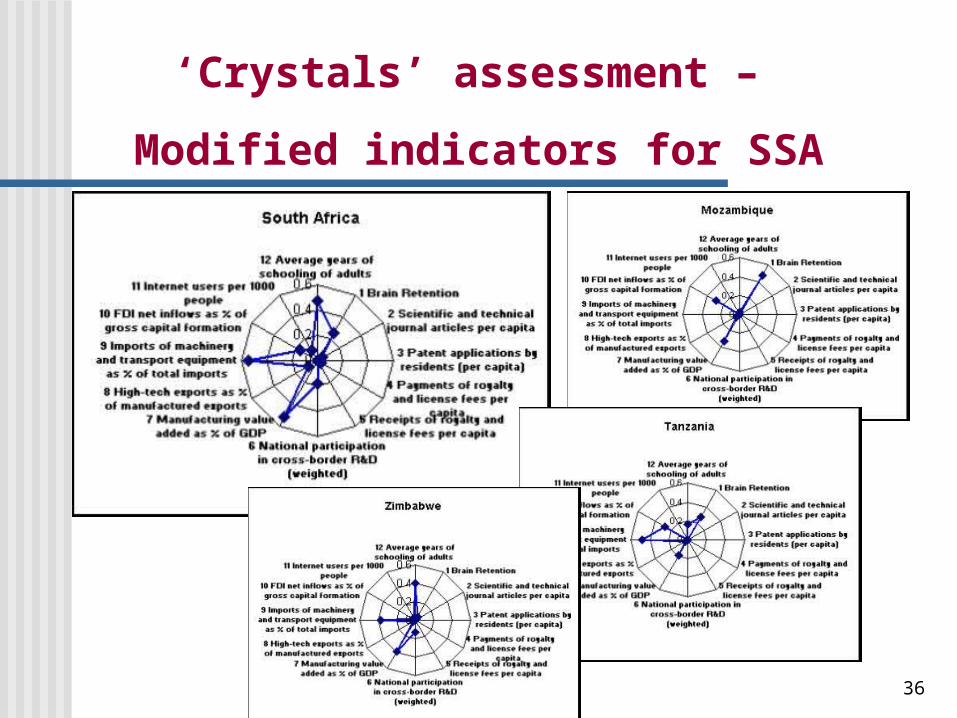
• Human capital accumulated / human capability for S&T learning (see indicators 11, 12, 1),
• The most accessible opportunities for learning from foreign sources created by capital goods imports and FDI (indicators 9, 10),
• The more demanding opportunities for learning from domestic and foreign sources through domestic R&D (indicators 2, 3),
• The most demanding opportunities for learning through knowledge markets and international S&T cooperation (indicators 4, 5, 6),
• Success in using S&T knowledge for improving technological structures of a country’s MVA and manufactured exports (indicators 7, 8).
19
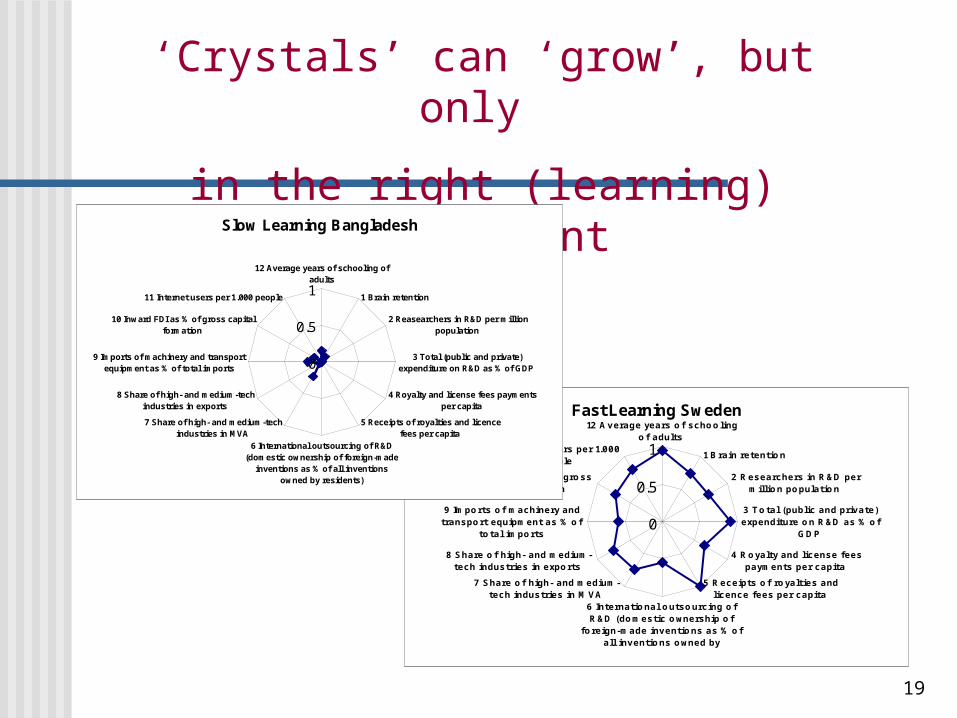
‘Crystals’ can ‘grow’, but only
in the right (learning) environment
Fast Learning Sweden
0
0.5
1
12 Average years of schoolingof adults
1 Brain retention
2 Researchers in R&D permillion population
3 Total (public and private)expenditure on R&D as % of
GDP
4 Royalty and license feespayments per capita
5 Receipts of royalties andlicence fees per capita
6 International outsourcing ofR&D (domestic ownership of
foreign-made inventions as % ofall inventions owned by
7 Share of high- and medium-tech industries in MVA
8 Share of high- and medium-tech industries in exports
9 Imports of machinery andtransport equipment as % of
total imports
10 Inward FDI as % of grosscapital formation
11 Internet users per 1.000people
Slow Learning Bangladesh
0
0.5
1
12 Average years of schooling ofadults
1 Brain retention
2 Reasearchers in R&D per millionpopulation
3 Total (public and private)expenditure on R&D as % of GDP
4 Royalty and license fees paymentsper capita
5 Receipts of royalties and licencefees per capita
6 International outsourcing of R&D(domestic ownership of foreign-made
inventions as % of all inventionsowned by residents)
7 Share of high- and medium-techindustries in MVA
8 Share of high- and medium-techindustries in exports
9 Imports of machinery and transportequipment as % of total imports
10 Inward FDI as % of gross capitalformation
11 Internet users per 1.000 people
20
6 models of
national technological learning:
• Traditionalist slow learning,
• Passive FDI-dependent,
• Active FDI-dependent,
• Autonomous,
• Creative-isolated,
• Creative-cooperative.
21
Traditionalist slow S&T learning
• Relying mostly on traditional technologies,
• low S&T learning capacity,
• minimal S&T learning opportunities,
• low international competitiveness,
• high risk of further economic marginalization,
• most urgent need of international S&T assistance.
22
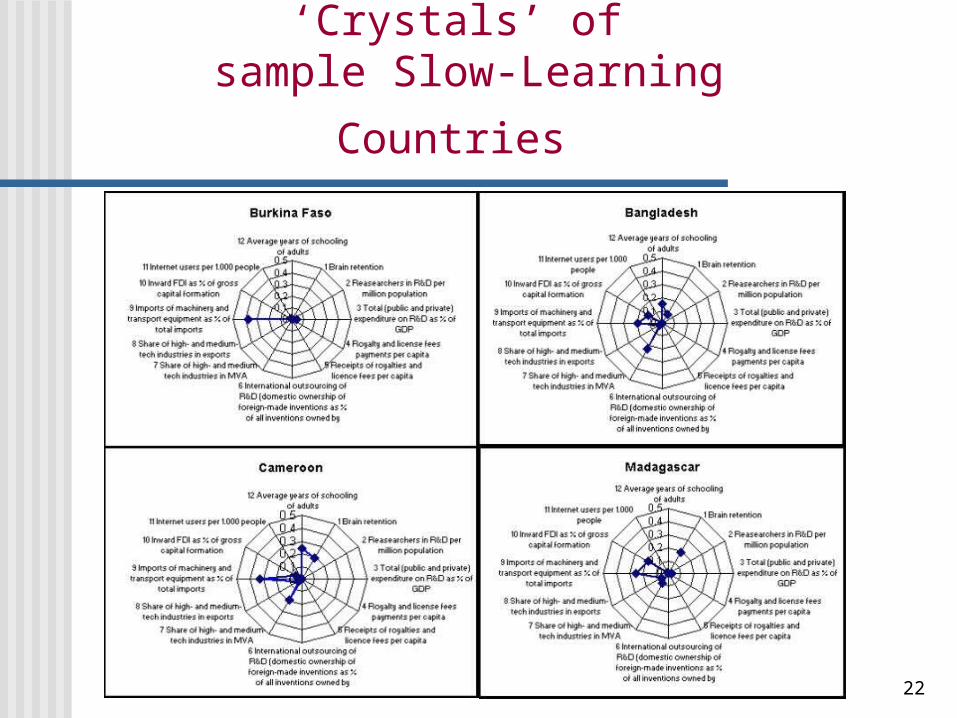
‘Crystals’ of
sample Slow-Learning Countries
23
Passive FDI-dependent learning
• passively relying on FDI to bring in new technologies,
• low S&T learning capacity,
• no or week government technological strategy,
• limited opportunities for technological learning,
• high risk of losing in economic competition with poorer, lower-wage countries.
24
Active FDI-dependent learning
• relatively high S&T learning capacity,
• active government strategy aimed at building national human capital and accelerating national technological learning from FDI,
• active targeting of the most beneficial FDI,
• much wider opportunities for technological learning from FDI,
• lower risk of losing in economic competition with lower-wage but lower-skill countries.
25
Crystals of sample
Passive and Active FDI-dependent learners
26
Autonomous S&T learning
• High S&T learning capacity and favorable international environment,
• active government strategy aimed at building national human capital and accelerating national technological learning via open sources, foreign consultants, contract manufacturing, licensing, copying & re-engineering, own R&D, even outward FDI,
• minimal reliance on FDI or international S&T cooperation,
• aspiring to compete with technological leaders.
27
Creative-cooperative S&T learning
• Capacity for both, generating and absorbing S&T knowledge among the highest in the world,
• global technological leadership in at least some niches of the global economy,
• active government S&T strategy directly linked to global competitiveness strategy,
• extensive R&D and efficient NIS,
• active participation in and control over international S&T cooperation,
• the fastest S&T learning.
28
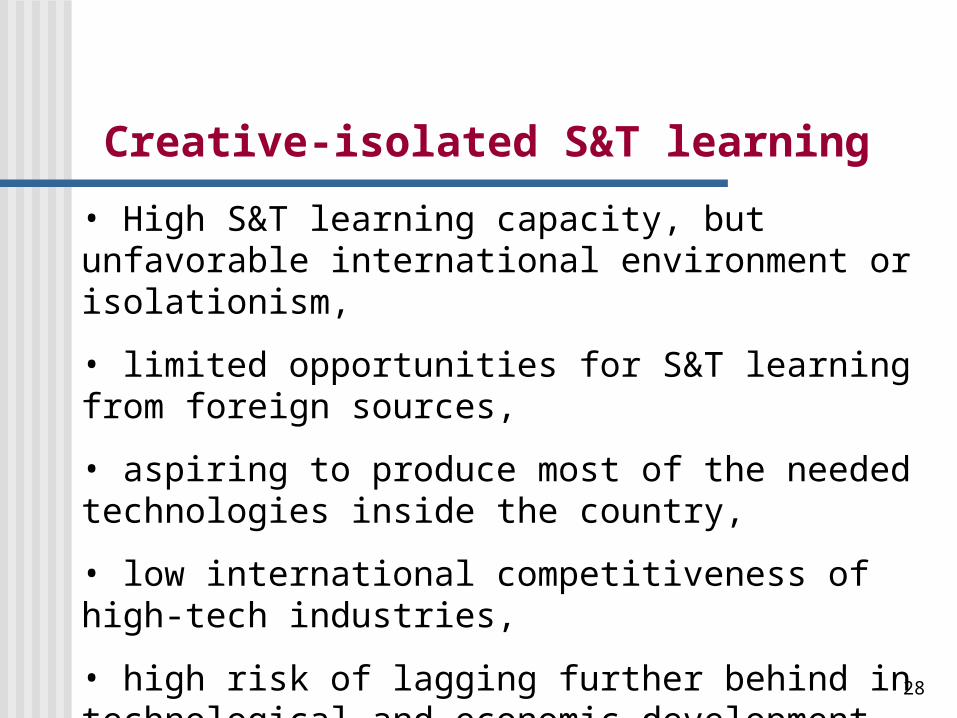
Creative-isolated S&T learning
• High S&T learning capacity, but unfavorable international environment or isolationism,
• limited opportunities for S&T learning from foreign sources,
• aspiring to produce most of the needed technologies inside the country,
• low international competitiveness of high-tech industries,
• high risk of lagging further behind in technological and economic development.
29
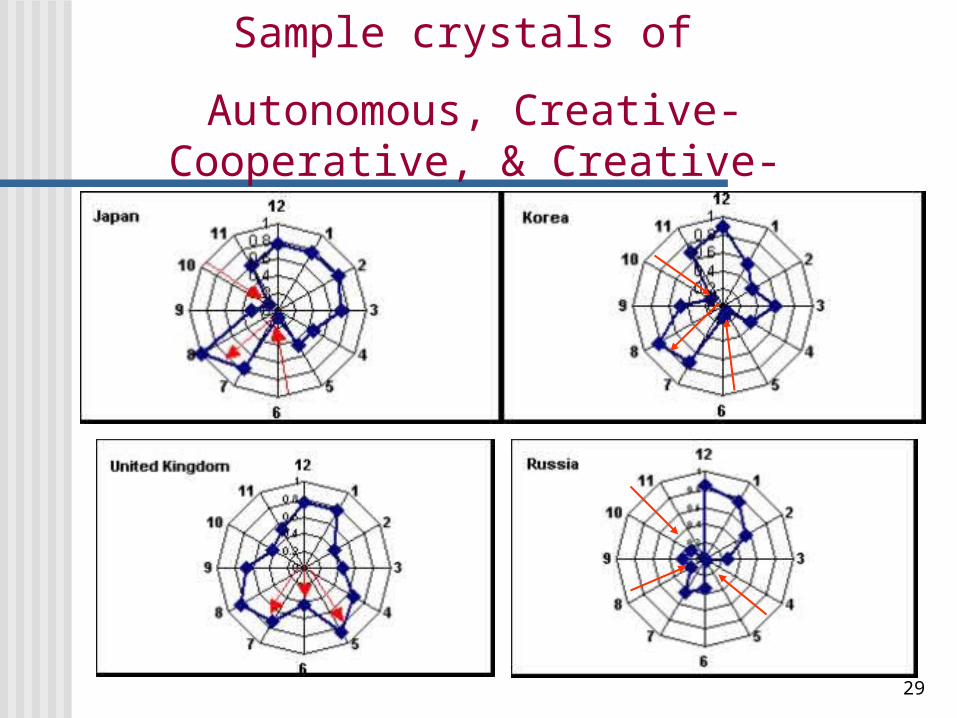
Sample crystals of
Autonomous, Creative-Cooperative, & Creative-Isolated learners
30
‘Rules’ of national technological learning
• National S&T learning requires a certain minimal stock of human capital and a favorable economic & institutional ‘learning environment’.
• Government S&T policies and international aid should target both prerequisites.
• Different models of S&T learning can be also seen as consecutive stages in the same country’s development (‘crystals’ are growing from 9 a.m. to 6 p.m.).
• But there are some policy choices, e.g. active FDI-dependent vs. autonomous and creative-isolated strategies.
•The higher a country’s underlying S&T capacity, the broader its choice of S&T learning strategies.
31
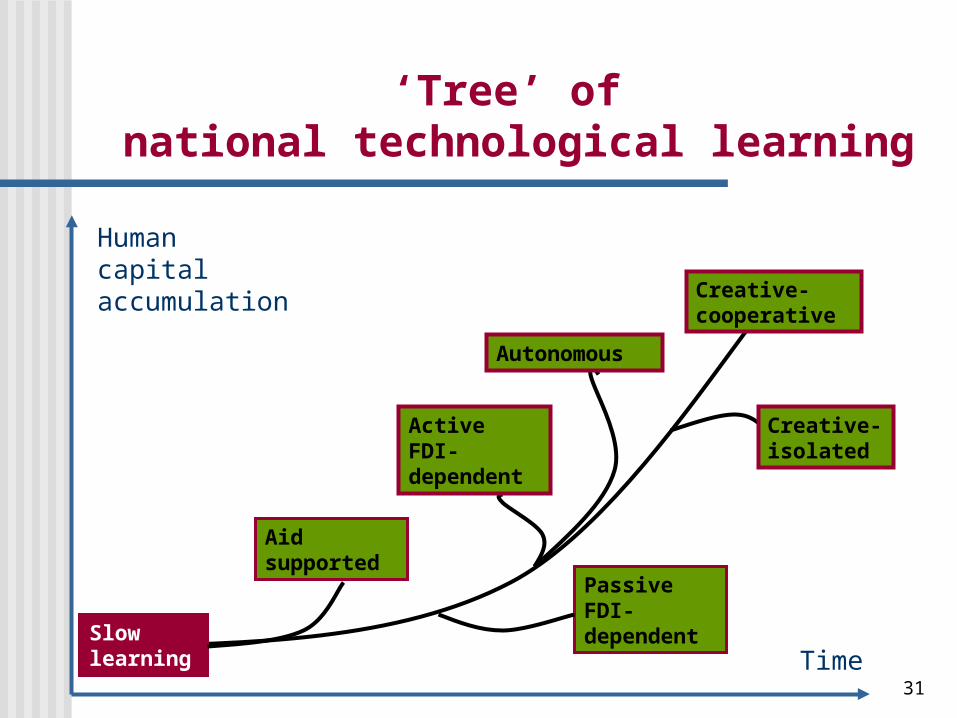
‘Tree’ of national technological learning
Slow learning
Passive FDI-dependent
Creative-cooperative
Aid supported
Creative- isolated
Autonomous
Active FDI-dependent
Time
Human capital accumulation
32
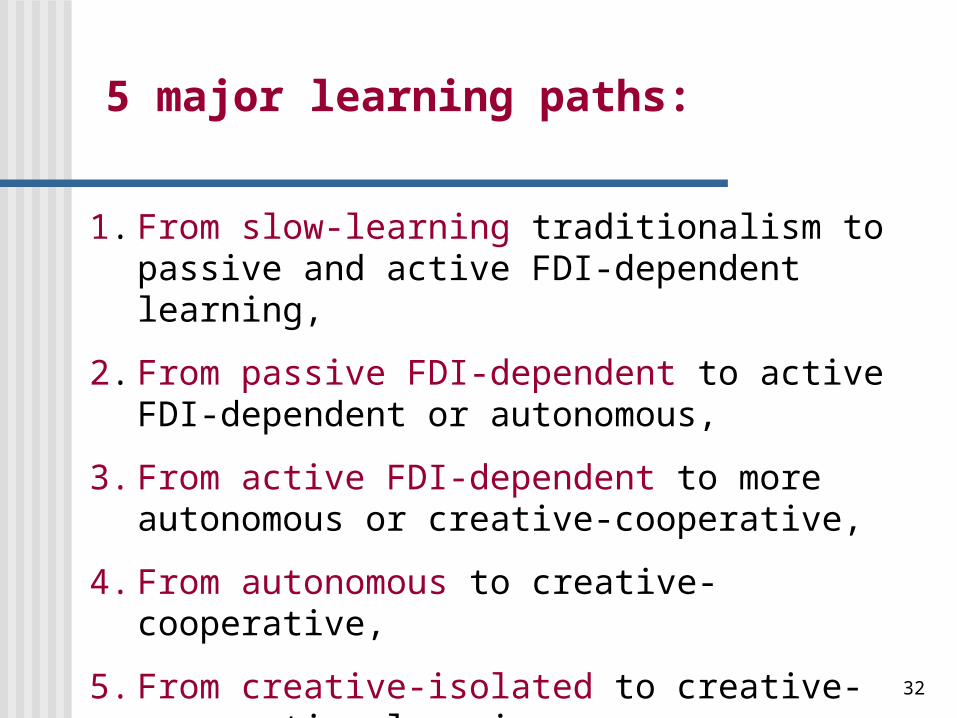
5 major learning paths:
1. From slow-learning traditionalism to passive and active FDI-dependent learning,
2. From passive FDI-dependent to active FDI-dependent or autonomous,
3. From active FDI-dependent to more autonomous or creative-cooperative,
4. From autonomous to creative-cooperative,
5. From creative-isolated to creative-cooperative learning.
33
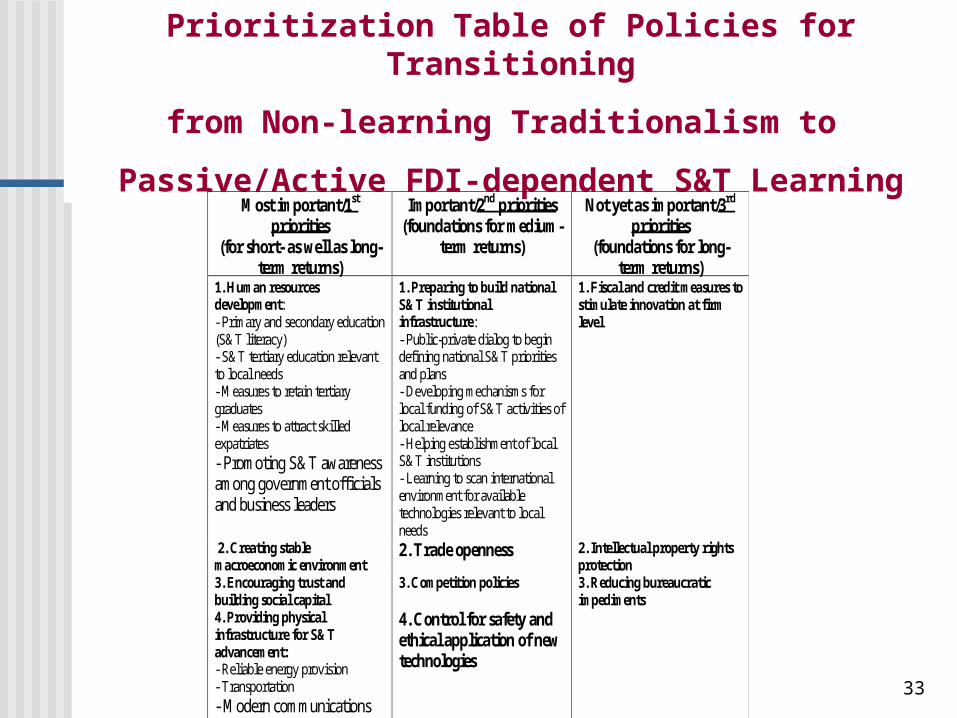
Prioritization Table of Policies for Transitioning
from Non-learning Traditionalism to
Passive/Active FDI-dependent S&T Learning
Most important/1st priorities
(for short- as well as long-term returns)
Important/2nd priorities (foundations for medium-
term returns)
Not yet as important/3rd priorities
(foundations for long-term returns)
1. Human resources development: - Primary and secondary education (S&T literacy) - S&T tertiary education relevant to local needs - Measures to retain tertiary graduates - Measures to attract skilled expatriates - Promoting S&T awareness among government officials and business leaders
1. Preparing to build national S&T institutional infrastructure: - Public-private dialog to begin defining national S&T priorities and plans - Developing mechanisms for local funding of S&T activities of local relevance - Helping establishment of local S&T institutions - Learning to scan international environment for available technologies relevant to local needs
1. Fiscal and credit measures to stimulate innovation at firm level
2. Creating stable macroeconomic environment
2. Trade openness 2. Intellectual property rights protection
3. Encouraging trust and building social capital
3. Competition policies 3. Reducing bureaucratic impediments
4. Providing physical infrastructure for S&T advancement: - Reliable energy provision - Transportation - Modern communications incl. ICT
4. Control for safety and ethical application of new technologies
34
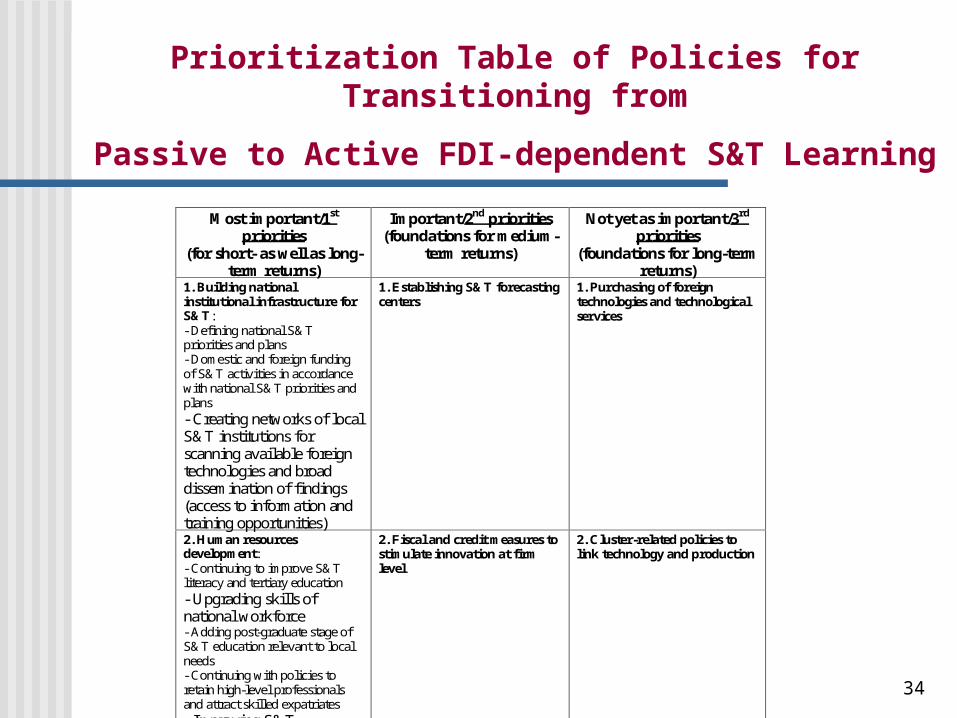
Prioritization Table of Policies for Transitioning from
Passive to Active FDI-dependent S&T Learning
Most important/1st priorities
(for short- as well as long-term returns)
Important/2nd priorities (foundations for medium-
term returns)
Not yet as important/3rd priorities
(foundations for long-term returns)
1. Building national institutional infrastructure for S&T: - Defining national S&T priorities and plans - Domestic and foreign funding of S&T activities in accordance with national S&T priorities and plans - Creating networks of local S&T institutions for scanning available foreign technologies and broad dissemination of findings (access to information and training opportunities)
1. Establishing S&T forecasting centers
1. Purchasing of foreign technologies and technological services
2. Human resources development: - Continuing to improve S&T literacy and tertiary education - Upgrading skills of national workforce - Adding post-graduate stage of S&T education relevant to local needs - Continuing with policies to retain high-level professionals and attract skilled expatriates - Improving S&T awareness among government officials and business leaders
2. Fiscal and credit measures to stimulate innovation at firm level
2. Cluster-related policies to link technology and production
35
How to help the majority of
slow-learning countries?
• What should be the main features of international aid-supported S&T learning?
• What can be learned from previous international aid projects with S&T components?
• What should be the role of the World Bank in these countries?
36
‘Crystals’ assessment –
Modified indicators for SSA
37
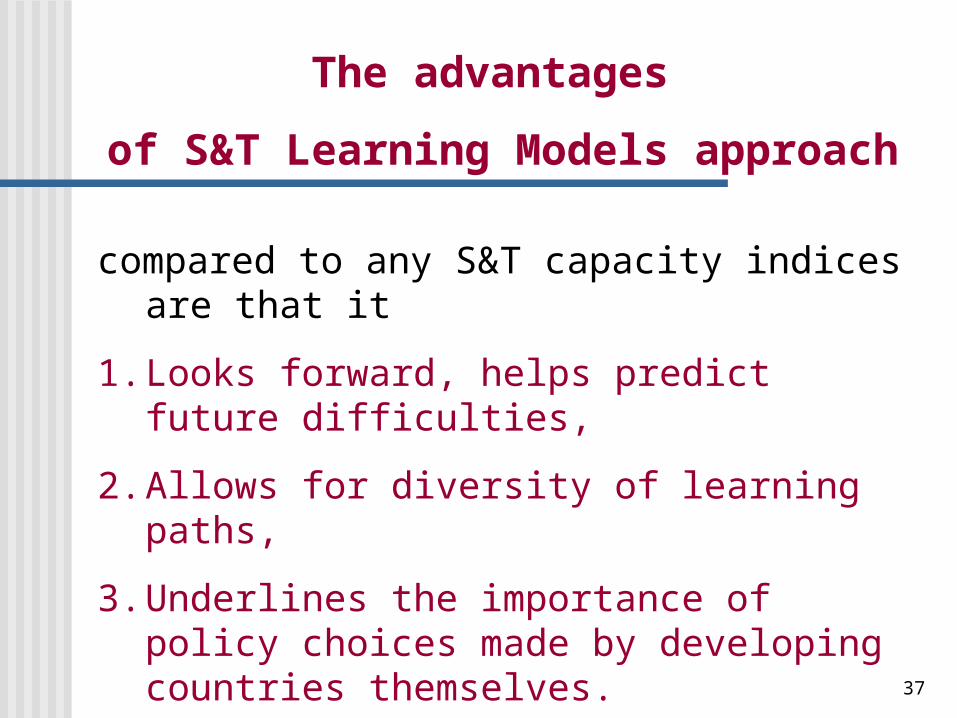
The advantages
of S&T Learning Models approach
compared to any S&T capacity indices are that it
1. Looks forward, helps predict future difficulties,
2. Allows for diversity of learning paths,
3. Underlines the importance of policy choices made by developing countries themselves.
38
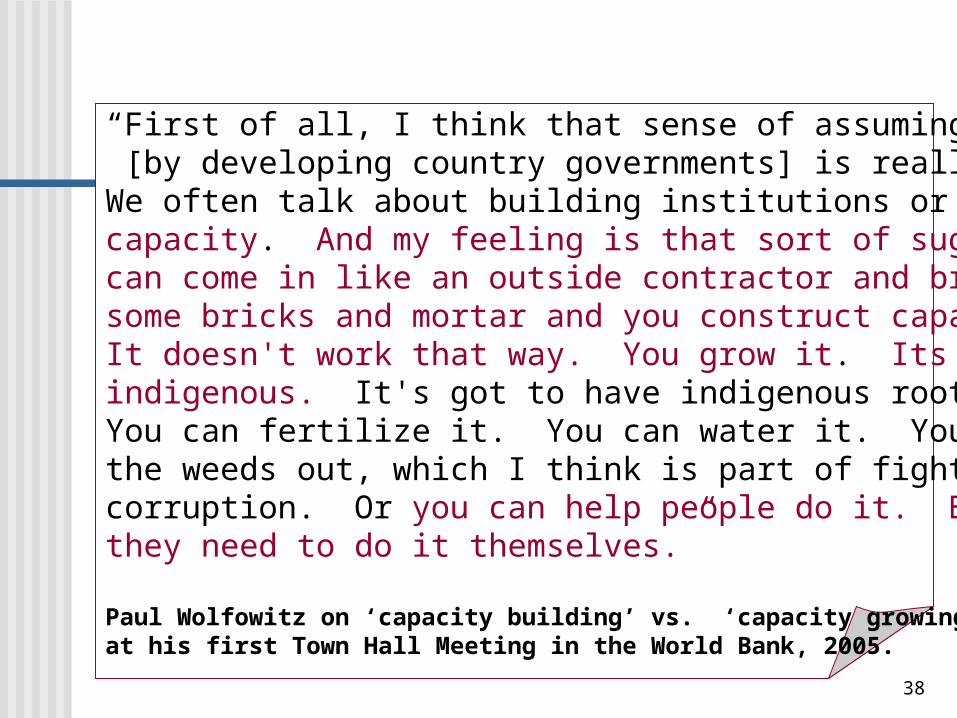
“First of all, I think that sense of assuming responsibility [by developing country governments] is really critical. We often talk about building institutions or building capacity. And my feeling is that sort of suggests you can come in like an outside contractor and bring some bricks and mortar and you construct capacity. It doesn't work that way. You grow it. Its got to be indigenous. It's got to have indigenous roots. You can fertilize it. You can water it. You can rip the weeds out, which I think is part of fighting corruption. Or you can help people do it. But they need to do it themselves.”
Paul Wolfowitz on ‘capacity building’ vs. ‘capacity growing’ at his first Town Hall Meeting in the World Bank, 2005.
39
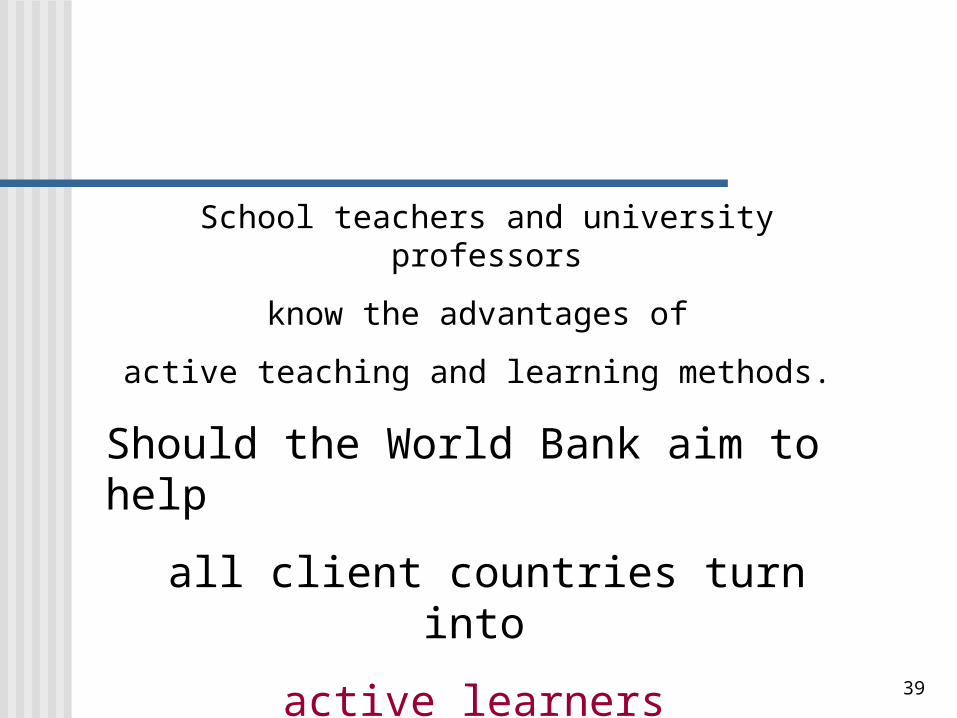
School teachers and university professors
know the advantages of
active teaching and learning methods.
Should the World Bank aim to help
all client countries turn into
active learners
of modern science and technology?
40
Models of S&T Learning approach is an alternative to
• Regional models of development – e.g. East Asian vs. Latin American
• “High-tech” model vs. low-tech “Latin” model
41
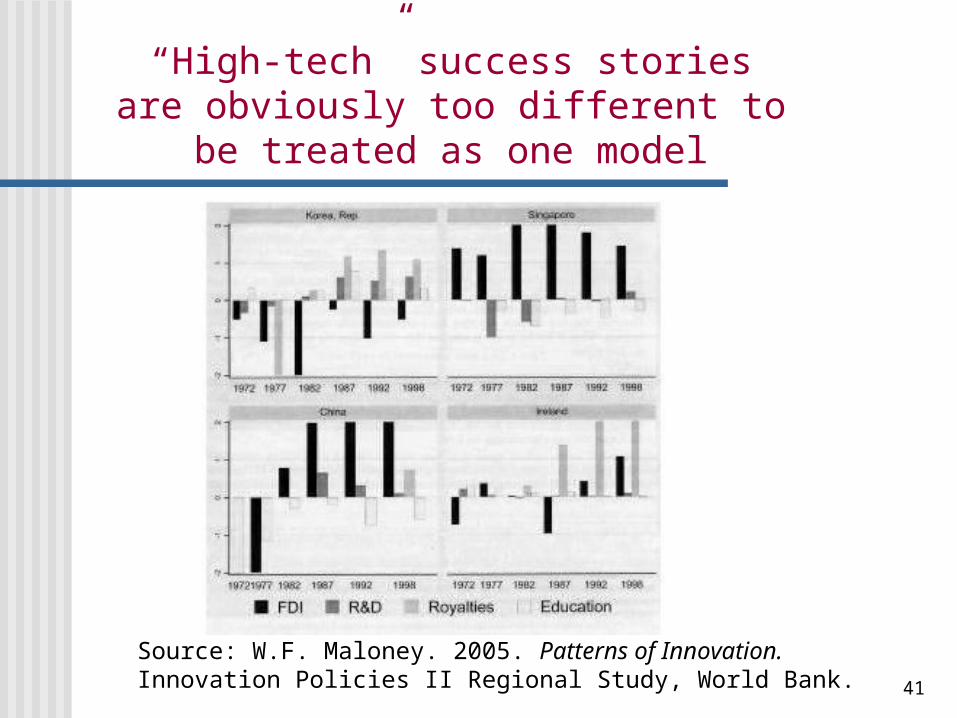
“High-tech” success stories are obviously too different to be treated
as one model
Source: W.F. Maloney. 2005. Patterns of Innovation. Innovation Policies II Regional Study, World Bank.
42
Further improvements to ‘crystals’ indicators are needed,
e.g.• A brain drain/brain gain statistics instead of ‘brain retention’ survey results
• Taking into account strong economies of scale and ‘critical mass’ effect in R&D
• A better indicator of benefits from participation in cross-border R&D cooperation
• Building data bases for historical and sub-national crystals of S&T learning
43
Practical application of ‘crystals’ assessment
• Is the country’s S&T learning likely to be fast enough compared to its major competitors?
• Is national S&T learning constrained mainly by the lack of human capital or the lack of learning opportunities?
• Which additional learning opportunities could be available but are currently underused?
• How successful is this country in using its S&T capacity for improving technological structure of its production and exports?
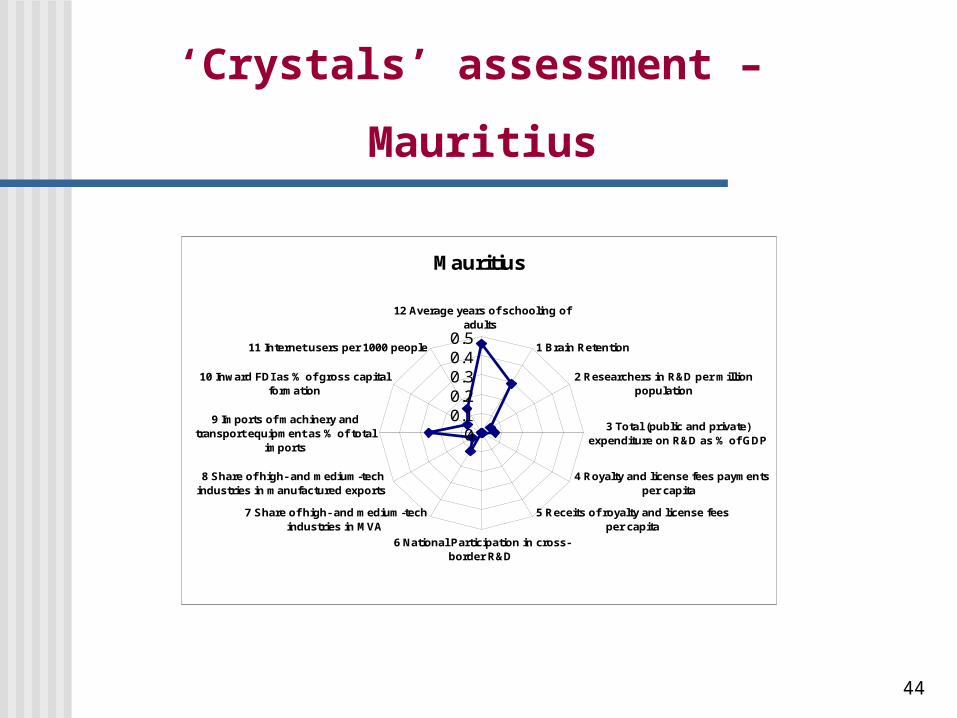
44
‘Crystals’ assessment –
Mauritius
Mauritius
00.10.20.30.40.5
12 Average years of schooling ofadults
1 Brain Retention
2 Researchers in R&D per millionpopulation
3 Total (public and private)expenditure on R&D as % of GDP
4 Royalty and license fees paymentsper capita
5 Receits of royalty and license feesper capita
6 National Participation in cross-border R&D
7 Share of high- and medium-techindustries in MVA
8 Share of high- and medium-techindustries in manufactured exports
9 Imports of machinery andtransport equipment as % of total
imports
10 Inward FDI as % of gross capitalformation
11 Internet users per 1000 people
45
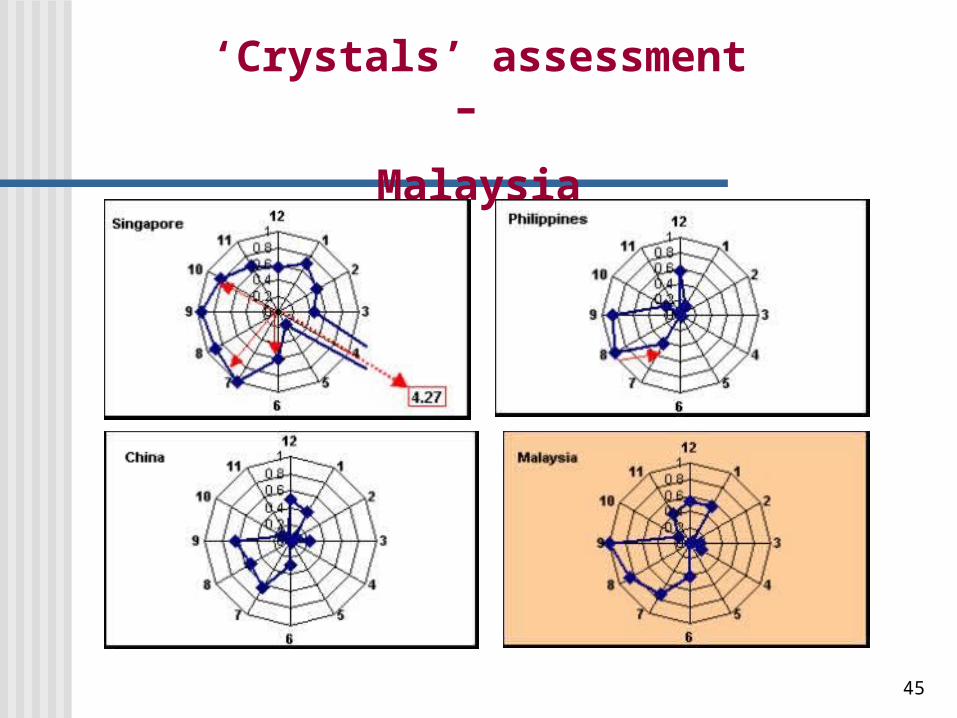
‘Crystals’ assessment –
Malaysia
46
Is there a need in an on-line interactive data base and an
automatic graphing tool?
(similar to KAM)
47
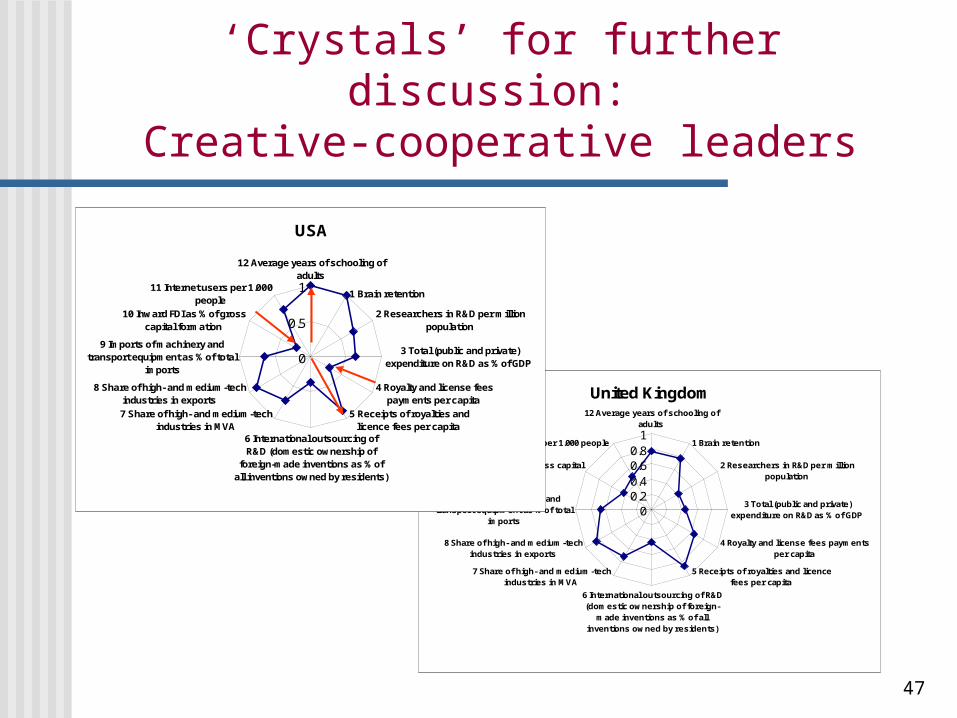
‘Crystals’ for further discussion: Creative-cooperative leaders
United Kingdom
00.20.40.60.8
1
12 Average years of schooling ofadults
1 Brain retention
2 Researchers in R&D per millionpopulation
3 Total (public and private)expenditure on R&D as % of GDP
4 Royalty and license fees paymentsper capita
5 Receipts of royalties and licencefees per capita
6 International outsourcing of R&D(domestic ownership of foreign-
made inventions as % of allinventions owned by residents)
7 Share of high- and medium-techindustries in MVA
8 Share of high- and medium-techindustries in exports
9 Imports of machinery andtransport equipment as % of total
imports
10 Inward FDI as % of gross capitalformation
11 Internet users per 1.000 people
USA
0
0.5
1
12 Average years of schooling ofadults
1 Brain retention
2 Researchers in R&D per millionpopulation
3 Total (public and private)expenditure on R&D as % of GDP
4 Royalty and license feespayments per capita
5 Receipts of royalties andlicence fees per capita
6 International outsourcing ofR&D (domestic ownership of
foreign-made inventions as % ofall inventions owned by residents)
7 Share of high- and medium-techindustries in MVA
8 Share of high- and medium-techindustries in exports
9 Imports of machinery andtransport equipment as % of total
imports
10 Inward FDI as % of grosscapital formation
11 Internet users per 1.000people
48
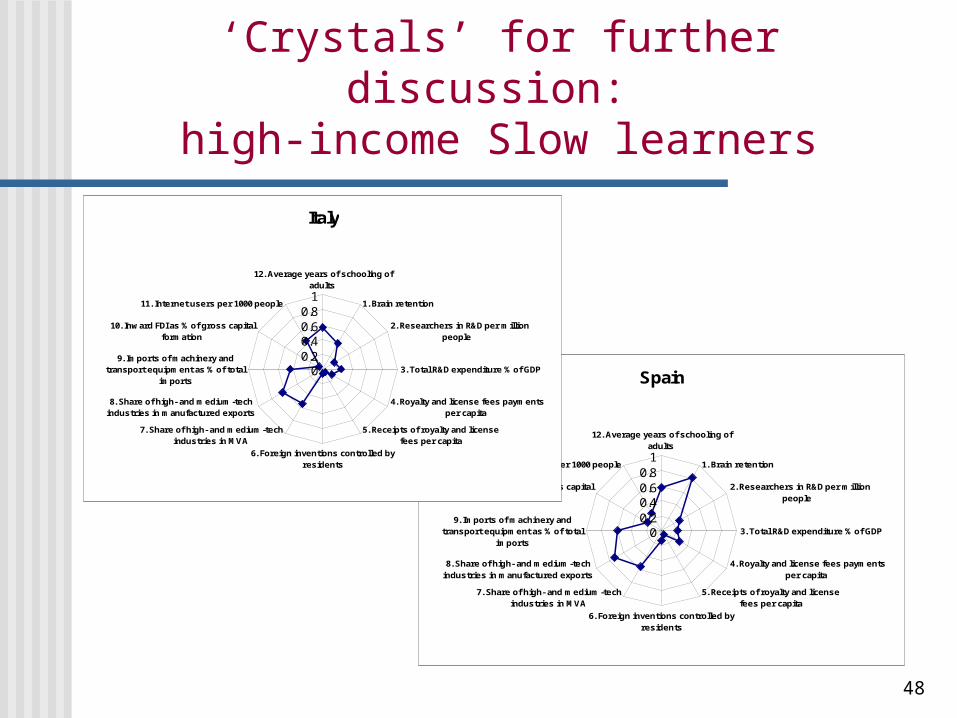
‘Crystals’ for further discussion: high-income Slow learners
Spain
00.20.40.60.8
1
12. Average years of schooling ofadults
1. Brain retention
2. Researchers in R&D per millionpeople
3. Total R&D expenditure % of GDP
4. Royalty and license fees paymentsper capita
5. Receipts of royalty and licensefees per capita
6. Foreign inventions controlled byresidents
7. Share of high- and medium-techindustries in MVA
8. Share of high- and medium-techindustries in manufactured exports
9. Imports of machinery andtransport equipment as % of total
imports
10. Inward FDI as % of gross capitalformation
11. Internet users per 1000 people
Italy
00.20.40.60.8
1
12. Average years of schooling ofadults
1. Brain retention
2. Researchers in R&D per millionpeople
3. Total R&D expenditure % of GDP
4. Royalty and license fees paymentsper capita
5. Receipts of royalty and licensefees per capita
6. Foreign inventions controlled byresidents
7. Share of high- and medium-techindustries in MVA
8. Share of high- and medium-techindustries in manufactured exports
9. Imports of machinery andtransport equipment as % of total
imports
10. Inward FDI as % of gross capitalformation
11. Internet users per 1000 people
49
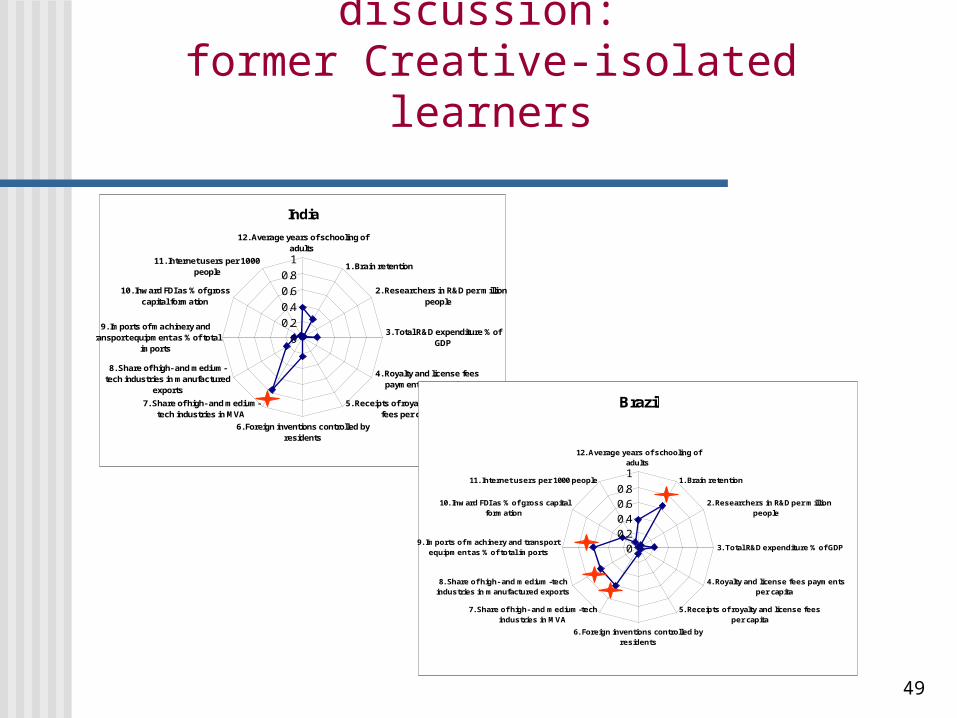
‘Crystals’ for further discussion: former Creative-isolated learners
India
0
0.2
0.4
0.6
0.8
1
12. Average years of schooling ofadults
1. Brain retention
2. Researchers in R&D per millionpeople
3. Total R&D expenditure % ofGDP
4. Royalty and license feespayments per capita
5. Receipts of royalty and licensefees per capita
6. Foreign inventions controlled byresidents
7. Share of high- and medium-tech industries in MVA
8. Share of high- and medium-tech industries in manufactured
exports
9. Imports of machinery andtransport equipment as % of total
imports
10. Inward FDI as % of grosscapital formation
11. Internet users per 1000people
Brazil
00.20.40.60.8
1
12. Average years of schooling ofadults
1. Brain retention
2. Researchers in R&D per millionpeople
3. Total R&D expenditure % of GDP
4. Royalty and license fees paymentsper capita
5. Receipts of royalty and license feesper capita
6. Foreign inventions controlled byresidents
7. Share of high- and medium-techindustries in MVA
8. Share of high- and medium-techindustries in manufactured exports
9. Imports of machinery and transportequipment as % of total imports
10. Inward FDI as % of gross capitalformation
11. Internet users per 1000 people


![OFFICE MEMO Tatyana Samoylovich[1][1]](https://img.pdfslide.us/doc/110x75/553772ca4a7959fe128b4da1/office-memo-tatyana-samoylovich11.jpg)