Embed Size (px)
Citation preview

1
Governance issues and measures toward sustainability in Paris / Ile-de-France
Mrs. Sophie MOUGARD
EMTA General Meeting15-16 April 2010 in Budapest (Hungary)

22
Administrative levels
The Ile-de-France region:
• 11.5 million inhabitants(18.13% of the French population)
• 5.3 million jobs• 29% of GNP• Area: 12,000 km²• Regional administrative levels:
– 1 Regional Council– 8 ‘Départements’ (counties) of which the
City of Paris– 110 intermunicipalities– 1 280 municipalities
French administrative levels:
• State• Regions• ‘Départements’ (counties)• Intermunicipalities• Municiplaities

33
Metro: 14 lines, including 1 fully automated 214 km / 300 stations 1,472.5 million journeys in 2008
Railway network: 1,411 km / 444 stations 1,296.1 million journeys in 2008
Bus: 1,312 lines / 22,670 km28,950 stops / 8,000 buses 1,287 million journeys in 2008
Tramway & TVM: 3 tram lines / 31.5 km and TVM 12.5 km(TVM: express bus in exclusive lane) 6 stops total
107.6 million journeys in 2008
Tram-train: 1 line / 8 km / 11 stops
Main characteristics of the area covered by STIF
Networks & figures
44
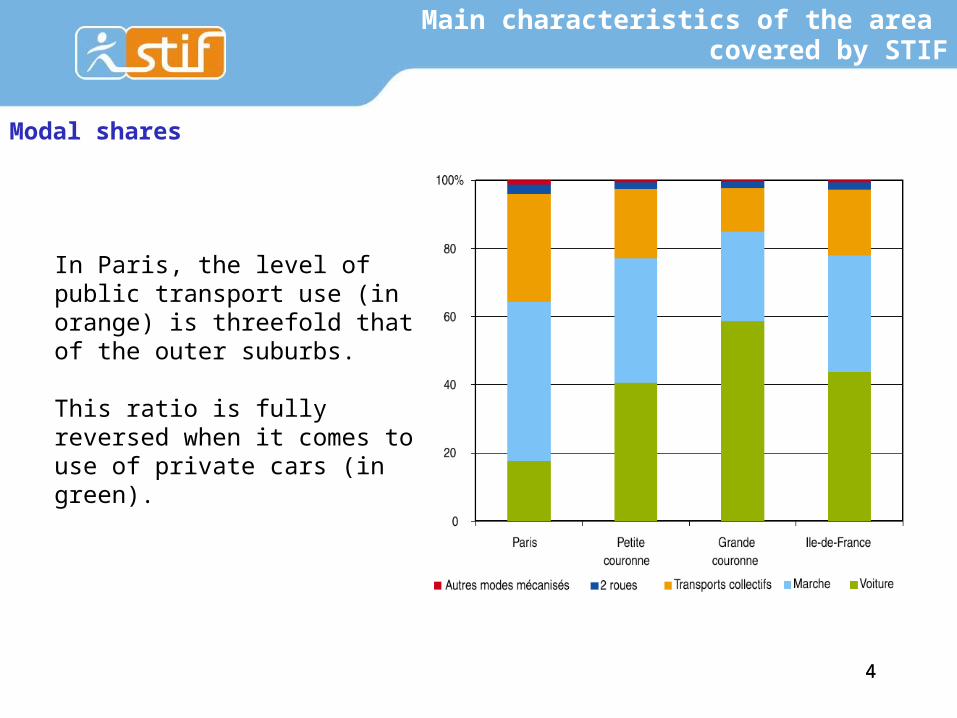
Main characteristics of the area covered by STIF
In Paris, the level of public transport use (in orange) is threefold that of the outer suburbs.
This ratio is fully reversed when it comes to use of private cars (in green).
Modal shares

55
Main characteristics of the area covered by STIF
Motorisation level (cars vs public transport)
Car share in motorized mobility
Average yearly evolution of both road traffic and PT traffic

6
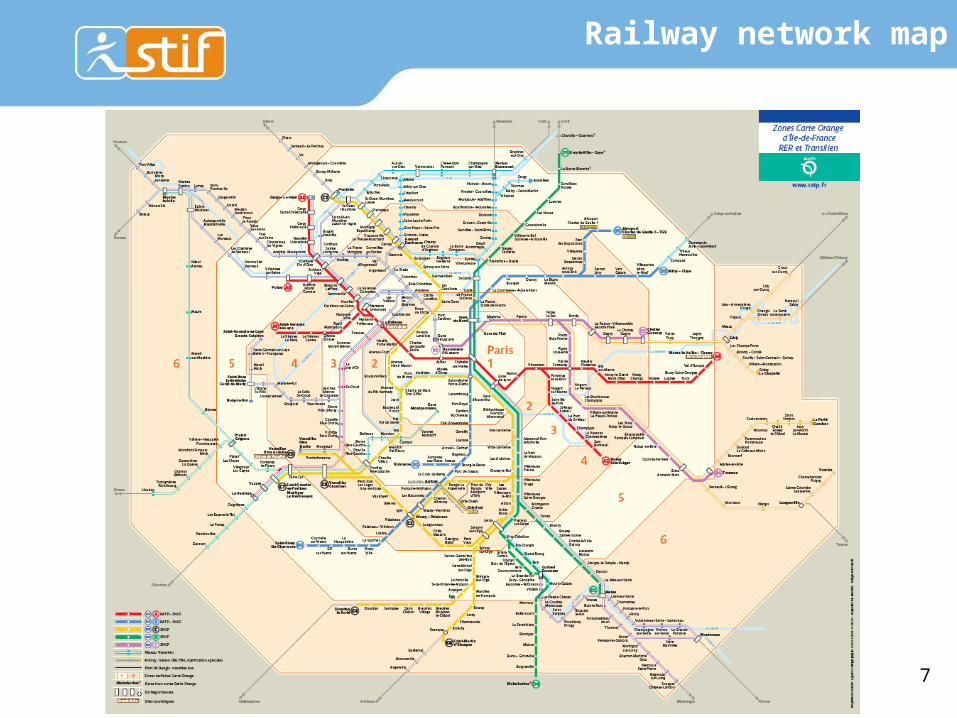
Railway network in Ile-de-France
7
Railway network map

88
Metro network map

99
Bus network and ‘Mobilien’ mapMobilien: regional bus network
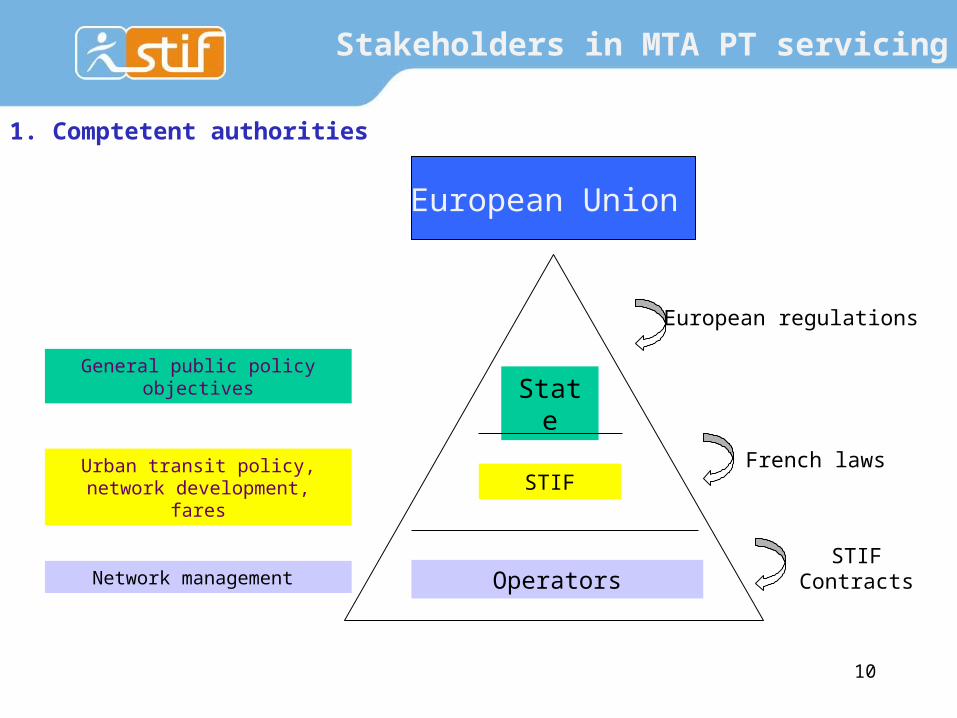
Stakeholders in MTA PT servicing
European Union
General public policy objectives
Urban transit policy, network development, fares
Network management
European regulations
French laws
STIF Contracts
State
STIF
Operators
10
1. Comptetent authorities

1111
• STIF is the public transport authority for the Île-de-France Region and is competent for all modes of transport. Its missions are as follows:
– definition and organisation of public transport services (definition of services - road, light rail, heavy rail - and quality, fare policy, contractual relation with operators, financial balance of the system)
– extension of the network and projection,– planning and monitoring activity.
Since 1st July 2005:
• The Regional Council holds a majority of the seats on the STIF Board as well as the chairmanship
• The French government no longer has representation on the STIF Board
• 2 new representatives have joined the Board:– 1 representative from the economic sector
appointed by the CRCI– 1 representative from the intermunicipalities in
Ile-de-France, elected by the college of EPCI chairmen
CRCI: Regional Chamber of Commerce and IndustryEPCI: Inter-municipalities
2. Organisers
Stakeholders in MTA PT servicing
STIF Board

RATP – National public company (Monopoly)Metro systemTramway systems2 RER lines (rapid transit railway)4,300 buses – 266 lines in central zone
SNCF – National public company (Monopoly)5 RER lines (2 shared with the RATP)
Transilien railway network (trans-regional)
RFF – French Railway NetworkAs owner of the railway infrastructure, this a public body
administers the corridors and is funded through fares.
OPTILE – Association of 76 private bus operators(of which 3 main companies such as VEOLIA, KEOLIS and TRANSDEV)
4,181 buses daily – 1,079 regular lines in the outskirts of Paris284 million journeys in 2008Own exclusive rights to their routes 12
3. Service providers
Stakeholders in MTA PT servicing

1313
Contribution to PT financing (2008)
Direct revenue(passengers)
€ 2,979 m
38.3%
Transport tax€ 2,971 m
38.2%
Public subsidies € 1,522 m
19.6%
(Incl. € 1.075 bn statutory contributions and € 74 m fare subsidies from the
Regional Council)
RATPPublic corporation
(Metro + Bus + Tramways + RER)
€ 4,275 m
55%
SNCF Public corporationRailway networks
€ 2,642 m(incl. € 600 m in tolls to RFF)
34%
OPTILEBus network
€ 777.2 m
10%
Other
€ 300 m
3.9%
Operating expenses
€ 7,772 m
Other
€ 77.72 m
1%

1414
REGION DEPARTEMENTS
STIF
Local governments or groups of them
Employers
SNCF RATP OPTILE
TT
HOUSEHOLDS
Contracts
Grants for extra services in
specific areas
season transport
passreimb.
Third-party payersSocial fares
Tickets
Contribution to PT financing

15
Characteristics of PT servicing
• STIF-SNCF and STIF-RATP contracts signed in February 2008
• OPTILE contracts:• ‘Type I’ contracts (1st generation) were signed in 2007• ‘Type II’ contract negotiations (2nd generation) are underway
• RFF contract (railway infrastructure) signed in July 2009
Contractual relationships

16
Characteristics of PT servicing
• Better service for passengers in Ile de France
• Implementing tools for an ambitious policy on public transport development
• New partnership relation between STIF and operators
• Service standards: description of supply, regularity, accessibility, ticket distribution, station services, information, equipment reliability...
• Measuring, inspection methods and profit-sharing levels in relation to objectives (bonus / penalty)
• Stricter requirements: different rules apply according to line, type of day and time of day
• Clearer and more motivating methods of compensation that separate reserves for investment costs from reserves for operating expenses
• Ambitious multi-year investment programmes to modernise the networks(€ 7 billion for RATP and SNCF over four years)
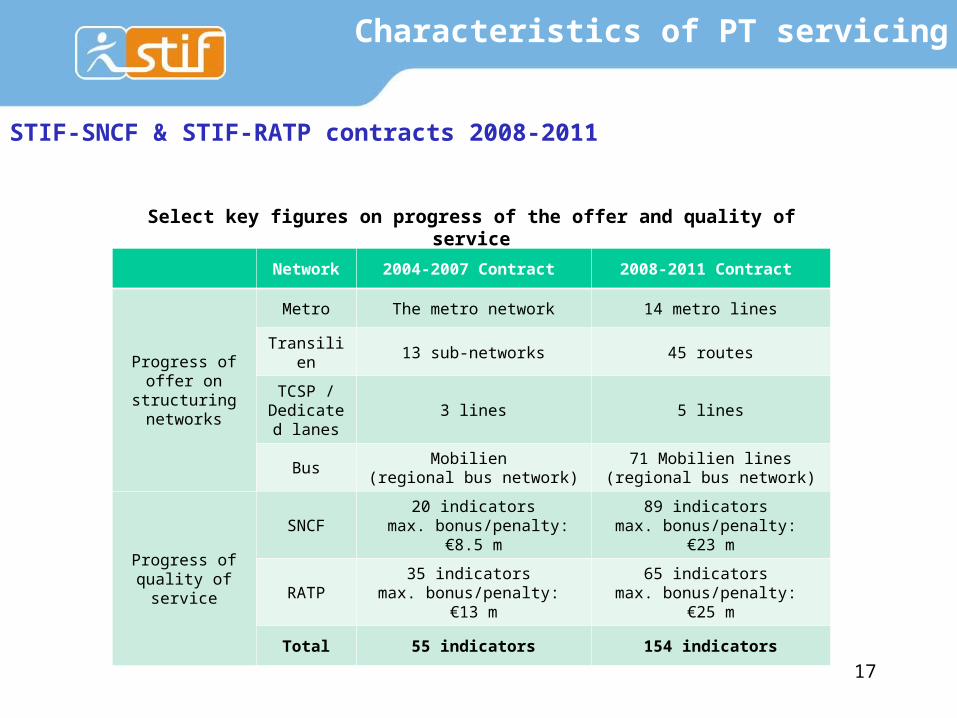
STIF-SNCF & STIF-RATP contracts 2008-2011
17
Network 2004-2007 Contract 2008-2011 Contract
Progress of offer on
structuring networks
Metro The metro network 14 metro lines
Transilien 13 sub-networks 45 routes
TCSP / Dedicated
lanes3 lines 5 lines
BusMobilien
(regional bus network)71 Mobilien lines
(regional bus network)
Progress of quality of service
SNCF20 indicators
max. bonus/penalty: €8.5 m
89 indicators max. bonus/penalty:
€23 m
RATP35 indicators
max. bonus/penalty: €13 m
65 indicators max. bonus/penalty:
€25 m
Total 55 indicators 154 indicators
Select key figures on progress of the offer and quality of service
Characteristics of PT servicing
STIF-SNCF & STIF-RATP contracts 2008-2011
18
These contracts are advancing the previous funding agreement towards an actual contractual system
The ‘Type I’ contract (1st generation) signed on 1st January 2007 for a maximum of four years is an initial step:
• Monitor and improve the offer and quality of service• Use a uniform pay scale• Produce multi-year business plans
The stakes of the ‘Type II’ contracts (2nd generation):• Cohesion/basin network (catchment area)• A public service contract• Stricter requirements for both the offer and the quality of service• Compensation in line with public service obligations
‘Type II’ contracts would include a partnership agreement involving the local governments affected, the STIF and the operator
Characteristics of PT servicing
Contracts with OPTILE companies

1. Single tickets: 5% (of the total of sales)
2. Ticket books: 15%
3. Season passes: 80%
• ‘Navigo’ : Weekly passesMonthly passes (3 million units)Yearly passes ‘Intégrale’ (1 million units)
• ‘Imagine’R’: Student pass (up to 26 years old)
Reduced Transit Fares:
Free for those receiving unemployment benefit (RMI), single-parent allowance (API), Specific Solidarity benefit (ASS), Supp. Universal Healthcare Coverage recipients (CMU) (RSA (job support income) benefits taken into account)
‘Carte Solidarité Transport’ (for recipients of State benefits): 75% discount
‘Améthyste’: yearly season pass distributed by the ’Départements’ (French counties) to 300,000 seniors and disabled
Tourist Passes:
‘Mobilis’ (valid during 1 day only) ‘Paris Visite’ (valid during 1,2,3 or 5 days) 19
Characteristics of PT servicing
Fares (incl. discounts)

20
Responsibilities regarding other transport modes in the MTA area
• Different actors are responsible for planning, at different levels:
– State, Region, ‘Département’ (Counties), Built-up (metropolitan) Area, Towns
• Plans are linked to legal compatibility requirements
State‘Départements’ (counties)
Region Municipalities
Public transport RoadsDelivery of goodsPublic parking
STIF
Sharing of responsibilities

21
Quality of service and passenger rights
Assessing quality delivered and quality perceived It is important that contracts include a dual quality assessment. • The quality of the service provided by the operator: this can be assessed using a set of indicators established by common agreement between the Organising Authority and the company. This measure enables the company’s performance in a certain number of areas to be assessed. • The quality of service as perceived by passengers: this is more often assessed through surveys conducted with passengers on the various networks, by asking them questions on the different points that are assessed in the contract. The important thing is to have this dual quality perspective, in order to check that what is being assessed in the contract with the operator is actually what passengers on the ground are experiencing. This enables us to ensure that the survey findings are consistent. Example: conducting a passenger survey enabled the STIF to realise that the RATP and the SNCF were receiving a bonus based on station and train cleanliness indicators, while passengers viewed the situation as unsatisfactory . La phrase n’est pas terminée dans la version FR. Voici donc ma suggestion.
Quality of service in general

22
Quality of service in the contracts 2008-2011
General principles and indicators within the contract
More detailed and complete description of the commitments regarding each
component of the quality of service (information, reception desks, selling, accessibility,
safety...)
Specifying regularity follow-up (objectives unchanged) as a replacement for the
global approach
Specifying the follow-up of network access indicators (information, reception in
station, functioning of the escalators) as a replacement for the global approach
New commitments coupled with penalties on services relevant for mobility reliability
(help desk to passengers in station, repairing of the lifts and escalators, information
about their reactivation lead time)
Quality of service and passenger rights

23
Better recognition of passenger’s feeling: setting up of a yearly survey in order to
assess the evolution of passenger’s perception regarding the quality of service
rendered, which results in bonus / malus
Widespread quality of service measuring device: threefold of the number of
indicators followed with bonus / malus (154 in total), doubling of the financial incentives
budget (€ 48 m), possible bonus decrease in case of aid and repairing delays
‘Technical’ measure completed by a yearly passenger's perception survey (resulting
in bonus / malus)
A strengthened control of the measures received by the operators: yearly audits and
penalties in case of significant gaps compared to the objectives
Quality of service and passenger rights
Quality of service in the contracts 2008-2011

24
Relationships with passengers
Communication: setting up of common principles with operators • consistent and readable communication• building up the image of an integrated network (fare policy, information, branding…)
Setting up local consultation process: • main rail lines committees• local collection of complaints from disabled passengers (provisioned in French law)• regular passenger’s perception measure
Linking the commitments of the operators into a sustainable development perspective
Quality of service and passenger rights
Quality of service in the contracts 2008-2011

25
• The PDUIF: a framework document on public transport in Ile-de-France that breaks down into short-term and medium-term operational actions
• A longer period than the current PDUIF so the actions are implemented effectively deadline 2020
• A scope covering all the transit policies (infrastructures, operation, quality of service) in observance of the authorities of the various players
• Strategic objectives that are broken down into region-specific operational actions
• Actions should be evaluated in relation to the planned objectives
• Ongoing monitoring
Selected tools and measures to promote sustainable mobility
The Regional Urban Mobility Plan (PDUIF)
26
• Urban challenges in Ile-de-France – 60,000 housing units built every year– fight against urban sprawl by encouraging urban density in city
centres or population centres in existing urban hubs.• Changes in the energy field
– decreasing supply of fossil fuel,– rising energy prices, – commitments to reduce greenhouse gas emissions
• Changing social expectations– increased awareness of sustainable development– changes in how cars are being used, which is becoming apparent
in Ile-de-France as well as the rest of France• Changes in society and lifestyles
– ageing of the population– patterns and times of transport are changing
Selected tools and measures to promote sustainable mobility
The objectives of the PDUIF: managing the changing context of the transit policy in Ile-de-France

27
Selected tools and measures to promote sustainable mobility
The PDUIF: a technical elaboration process to identify pertinent actions through thematic work groups
Which mobility by 2020 ?
Public Transport: Provision of transportation services
Public Transport: intermodality
Fare scheme
Multimodal passengers information
Car and two-wheel motorized vehicles parking
Operating of the road networks
Road safety
Pedestrians, cycling and sharing of the public space
Living and mobility areas
Link between urban planning and transport
Mobility of the people with disabilities
Mobility management
Taxis and on demand transport
Transport and delivery of goods
Financal needs, new modes of financing, urban toll
Environment
Governance, local implementation, Local Mobility Plans

28
Selected tools and measures to promote sustainable mobility
What is at stake in the PDUIF?
Ensuring the mobility needs of people and goods: According to the different scales of mobility For various motives For all
Reducing environmental nuisances (pollution, greenhouse gases, noise) Improving road safety Improving the quality of life Controlling energy consumption and reducing the dependence on fossil fuels
MOBILITYENVIRONMENT, HEALTH,
QUALITY OF LIFE
In order to ensure this balance today and moreover in the future, we have to: Change the mobility conditions Change our behaviour
The PDUIF must ensure a sustainable balance between the needs of mobility, the protection of environment and health and the financial needs.
This balance shall facilitate the attractiveness of the French region ‘Ile-de-France’ and guarantee the social cohesion.
Ensuring the financial sustainability Identifying the sources of financing for all the actions of the Regional Urban Mobility Plan (RUMP) whatever the scope Looking for efficient measures
FINANCING
Sustainable balance
29
Selected tools and measures to promote sustainable mobility
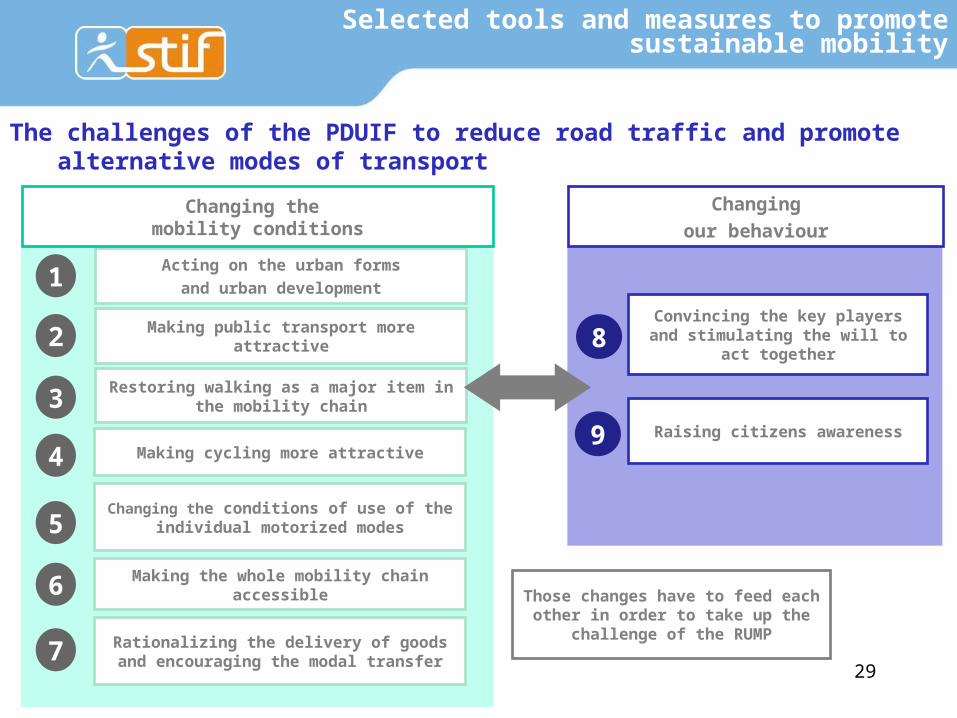
The challenges of the PDUIF to reduce road traffic and promote alternative modes of transport
1Acting on the urban formsand urban development
2 Making public transport more attractive
3 Restoring walking as a major item in the mobility chain
4 Making cycling more attractive
8Convincing the key players
and stimulating the will to act together
9 Raising citizens awareness
5Changing the conditions of use of the
individual motorized modes
Changing the mobility conditions
Changingour behaviour
Those changes have to feed each other in order to take up
the challenge of the RUMP
Making the whole mobility chain accessible6
Rationalizing the delivery of goods and encouraging the modal transfer7
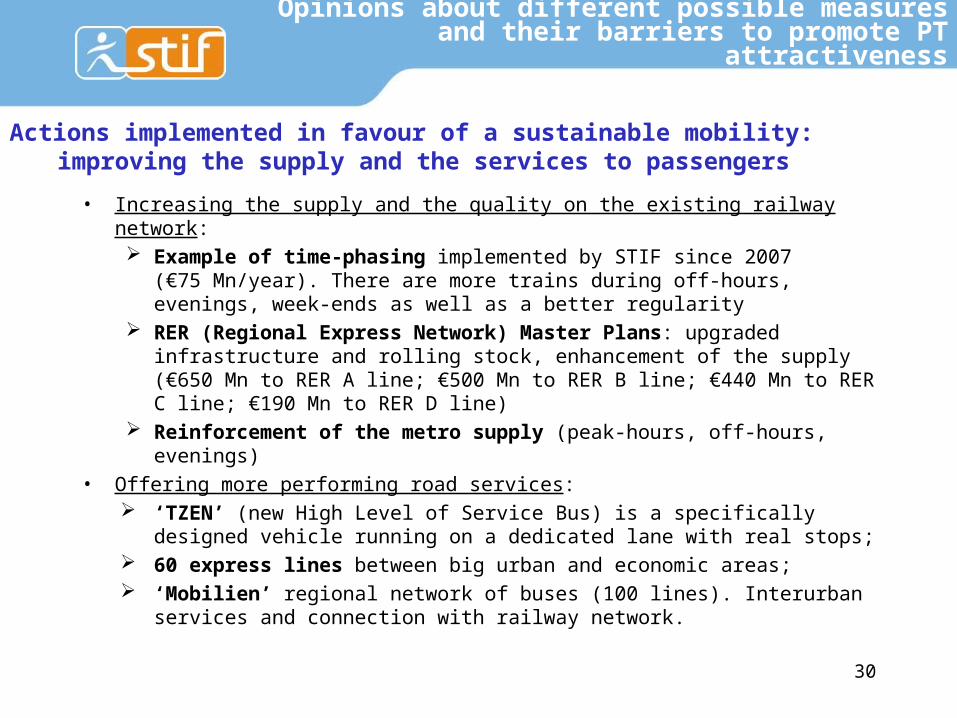
• Increasing the supply and the quality on the existing railway network: Example of time-phasing implemented by STIF since 2007
(€75 Mn/year). There are more trains during off-hours, evenings, week-ends as well as a better regularity
RER (Regional Express Network) Master Plans: upgraded infrastructure and rolling stock, enhancement of the supply (€650 Mn to RER A line; €500 Mn to RER B line; €440 Mn to RER C line; €190 Mn to RER D line)
Reinforcement of the metro supply (peak-hours, off-hours, evenings)
• Offering more performing road services: ‘TZEN’ (new High Level of Service Bus) is a specifically designed
vehicle running on a dedicated lane with real stops; 60 express lines between big urban and economic areas; ‘Mobilien’ regional network of buses (100 lines). Interurban
services and connection with railway network.
30
Actions implemented in favour of a sustainable mobility: improving the supply and the services to passengers
Opinions about different possible measures and their barriers to promote PT
attractiveness

31
Opinions about different possible measures and their barriers to promote PT
attractiveness
Francilien
Tzen
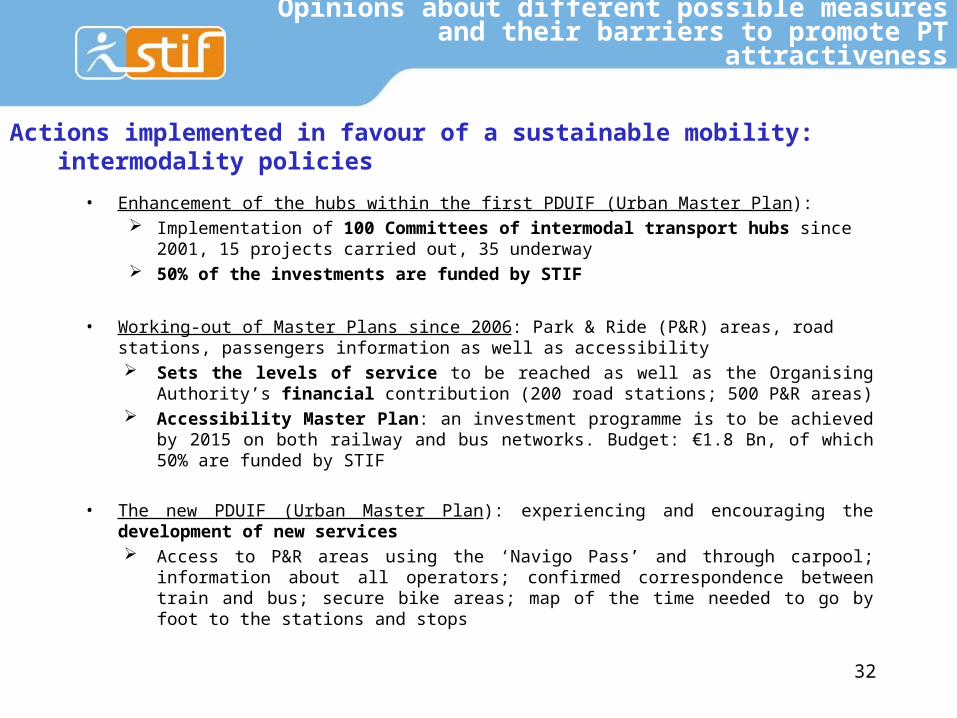
• Enhancement of the hubs within the first PDUIF (Urban Master Plan): Implementation of 100 Committees of intermodal transport hubs
since 2001, 15 projects carried out, 35 underway 50% of the investments are funded by STIF
• Working-out of Master Plans since 2006: Park & Ride (P&R) areas, road stations, passengers information as well as accessibility Sets the levels of service to be reached as well as the Organising
Authority’s financial contribution (200 road stations; 500 P&R areas) Accessibility Master Plan: an investment programme is to be achieved
by 2015 on both railway and bus networks. Budget: €1.8 Bn, of which 50% are funded by STIF
• The new PDUIF (Urban Master Plan): experiencing and encouraging the development of new services Access to P&R areas using the ‘Navigo Pass’ and through carpool;
information about all operators; confirmed correspondence between train and bus; secure bike areas; map of the time needed to go by foot to the stations and stops
32
Actions implemented in favour of a sustainable mobility: intermodality policies
Opinions about different possible measures and their barriers to promote PT
attractiveness

33
Sources and proportions of PT financing
The Regional Urban Mobility Plan (PDUIF) and the sources of funding
• Heavy trucks taxes
• City tolls
• Increase of parking fines (of which 50% go to STIF)
• Fare increases
• Land value capture
34
Thank you for your attention !
EMTA General Meeting15-16 April 2010 in Budapest (Hungary)