Embed Size (px)
Citation preview

1
FORECASTING ENERGY PRODUCT PRICES
M.E. MalliarisLoyola University Chicago
S.G. MalliarisMassachusetts Institute of Technology

2
The Problem
Forecasting 5 interrelated energy products using price data from all five of them
Crude Oil [CO] Heating Oil [HO] Gasoline [HU] Natural Gas [NG] Propane [PN]

3
Yield from a Barrel of Crude Oil

4
Natural Gas Breakdown

5
Correlation Among Variable Prices
CL HO PN HU NG
CL 1.00 - - - -
HO 0.96 1.00 - - -
PN 0.84 .88 1.00 - -
HU 0.96 .93 .85 1.00 -
NG 0.67 .73 .68 .66 1.00

6
ORIGINAL DATA
Daily spot prices for each of the five variables from December 1997 through November 2002 [5 years]
The first four years were used for the training set
The last year was used for validation

7
Variables
Inputs Daily closing price of the 5 products Percent change in price from previous day Standard deviation over 5 previous days Standard deviation over 21 previous days
Output Daily price 21 trading days away
8
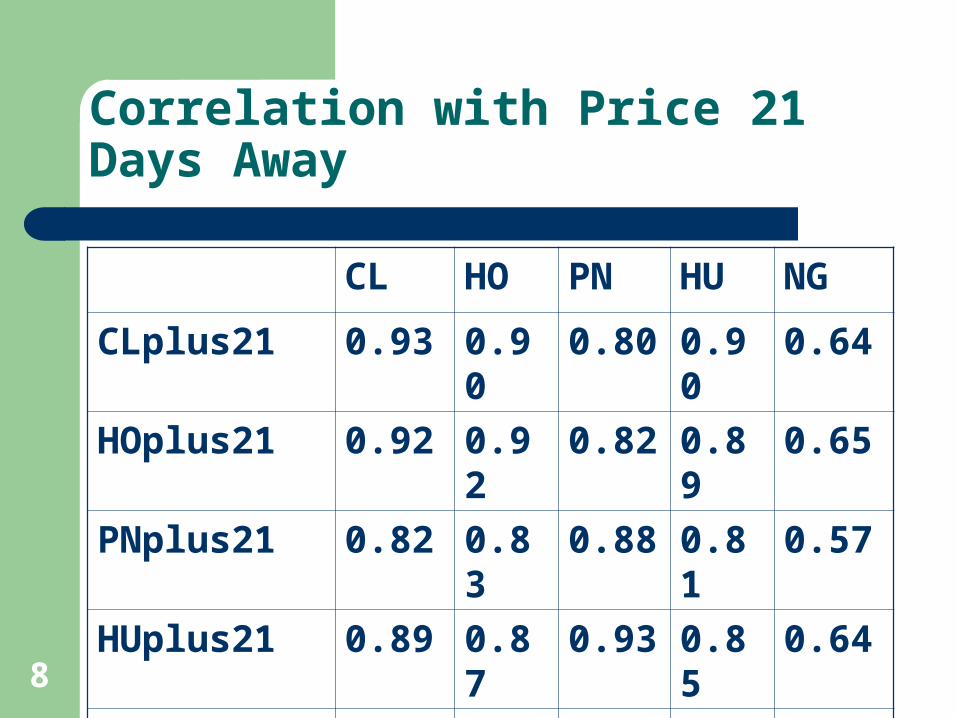
Correlation with Price 21 Days Away
CL HO PN HU NG
CLplus21 0.93 0.90 0.80 0.90 0.64
HOplus21 0.92 0.92 0.82 0.89 0.65
PNplus21 0.82 0.83 0.88 0.81 0.57
HUplus21 0.89 0.87 0.93 0.85 0.64
NGplus21 0.72 0.77 0.73 0.68 0.66

9
MODELS
Multiple Regression K-Means clustering (cluster group used as
additional input into the neural network) Neural Network

10
TOOLS
Excel– Multiple Regression
SPSS Clementine– Cluster Analysis– Neural Networks

11
SPSS Clementine Screen

12

13
ClementineNN Output

14
Natural Gas
1.5
2
2.5
3
3.5
4
4.5
5
5.5
1 13 25 37 49 61 73 85 97 109 121 133 145 157 169 181 193 205 217 229 241
NGplus21
Reg
KMeansNN

15
Heating Oil
0.4
0.5
0.6
0.7
0.8
0.9
1
1 11 21 31 41 51 61 71 81 91 101 111 121 131 141 151 161 171 181 191 201 211 221 231 241
HOplus21
Reg
KMeansNN

16
Gasoline
0.4
0.5
0.6
0.7
0.8
0.9
1
1 13 25 37 49 61 73 85 97 109 121 133 145 157 169 181 193 205 217 229 241
HUplus21
Reg
KMeansNN

17
Crude Oil
14
16
18
20
22
24
26
28
30
32
34
1 11 21 31 41 51 61 71 81 91 101 111 121 131 141 151 161 171 181 191 201 211 221 231 241
CLplus21
Reg
NN

18
Propane
0.2
0.25
0.3
0.35
0.4
0.45
0.5
0.55
0.6
0.65
1 12 23 34 45 56 67 78 89 100 111 122 133 144 155 166 177 188 199 210 221 232 243
PNplus21
Reg
KMeansNN

19
Variables Used
The number of variables used in each of the final regression models ranged from 9 to 14
Only NG appeared in every regression model The most significant variables in the NN
models had little agreement among them The CL model had no variable in the top five
in common with any other model’s top five

20
Forecasting Error
Avg. Absolute Error Mean Squared Error
Reg NN Reg NN
CL 2.13 1.12 6.65 2.27
HO .06 .04 .005 .002
HU .05 .03 .004 .001
NG .41 .22 .242 .075
PN .06 .08 .005 .009

21
% Correct Direction of Forecasts
Regression Neural Net
CL 40% 79%
HO 63% 72%
HU 65% 83%
NG 68% 81%
PN 68% 69%

22
Some Conclusions
In some cases, there is enough information contained in a simple set of price data to allow effective forecasting
The ability to predict the price of a source good does not imply an ability to predict the price of that good’s byproducts