Embed Size (px)
Citation preview
1
Fiscal Policy Overview
Keynesian Economics
2
FISCAL POLICY OVERVIEW
Fiscal Policy:
Deliberate use of taxes, transfer payments, and government payments for G & S to affect the level of production (GDP), income, prices & employment in the economy.
(AKA: Government tax & Spend policy)
3
FISCAL POLICY OVERVIEW
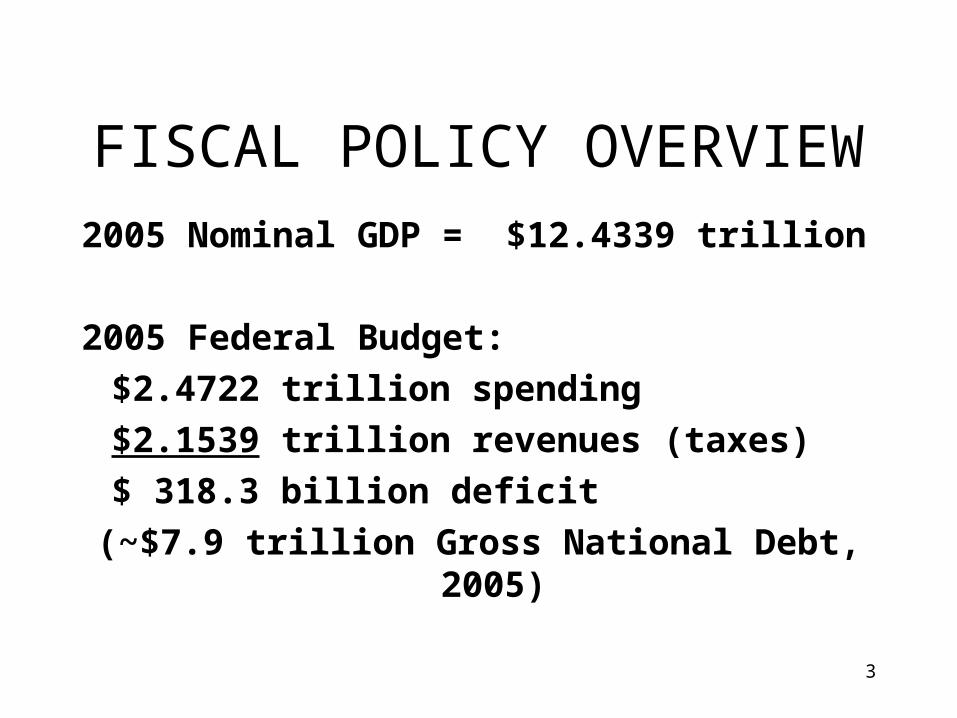
2005 Nominal GDP = $12.4339 trillion
2005 Federal Budget:
$2.4722 trillion spending
$2.1539 trillion revenues (taxes)
$ 318.3 billion deficit
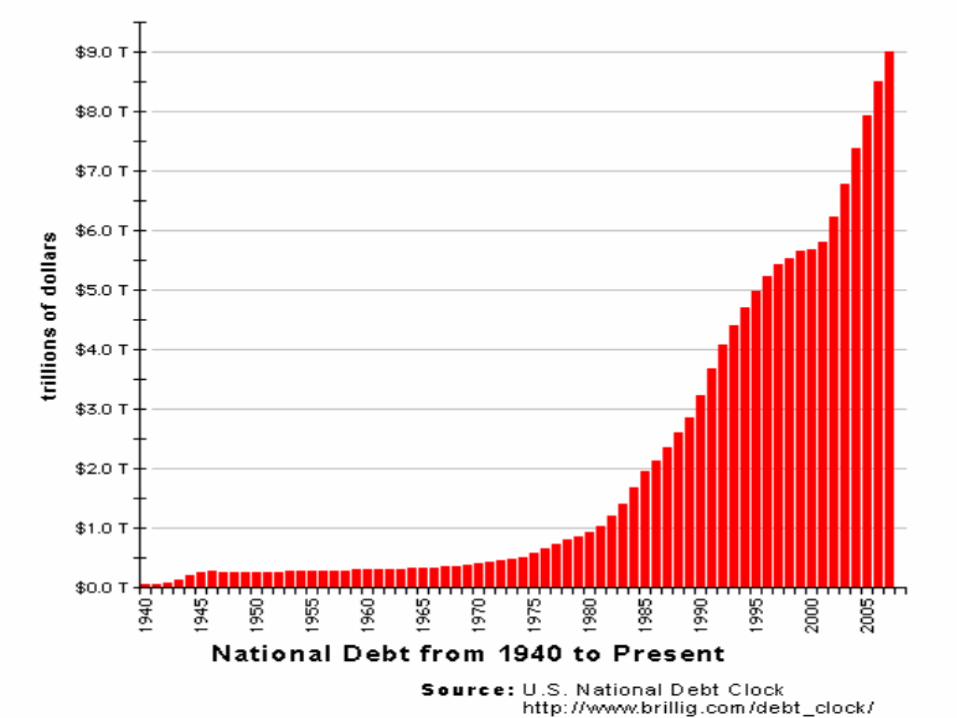
(~$7.9 trillion Gross National Debt, 2005)
4
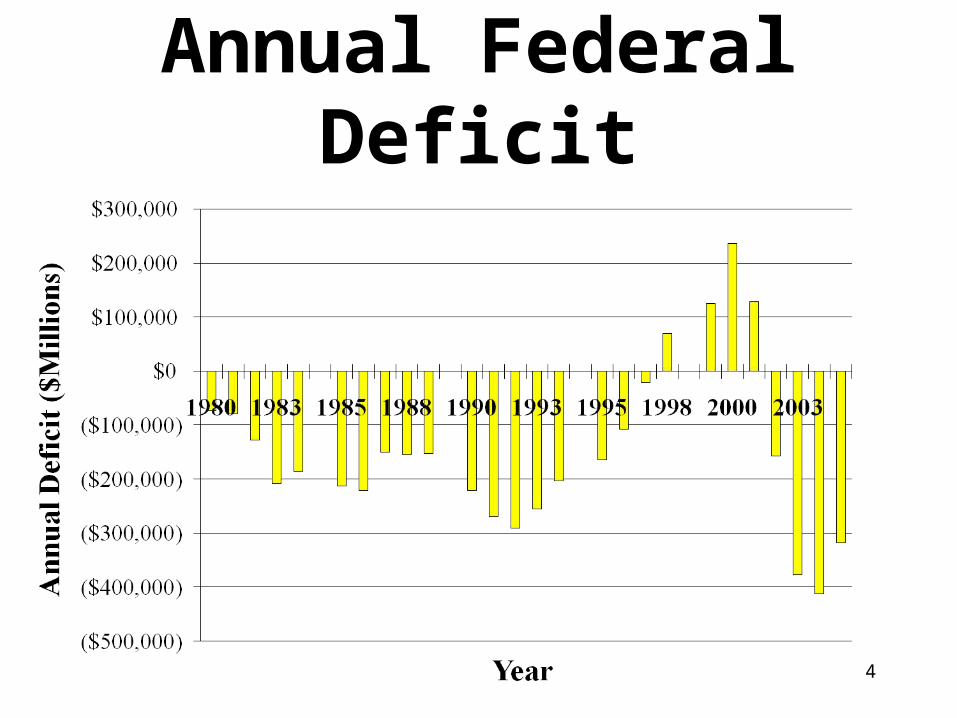
Annual Federal Deficit
5
A National Debt Clock
May be found on the WWW at the following URL:
http://www.brillig.com/debt_clock/
Or at the U.S. Treasury Public Debt site:
http://www.treasurydirect.gov/govt/govt.htm
6
7
FISCAL POLICY OVERVIEW
Federal Govt. spending in 2005 was
20.1% of GDP
8
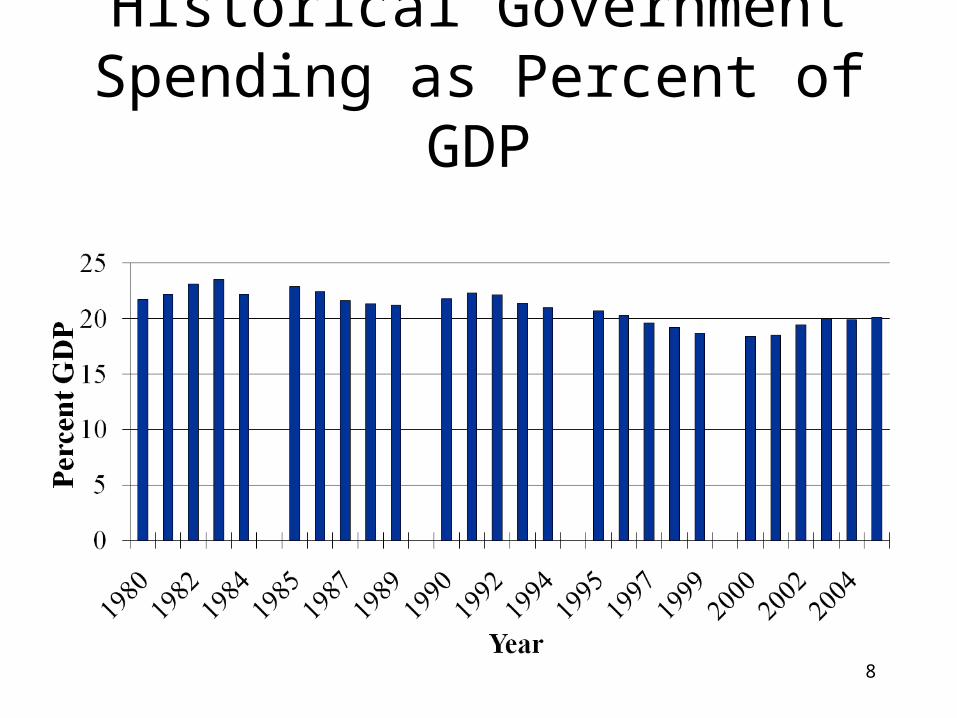
Historical Government Spending as Percent of GDP
9
What is Government Spending?
• Direct govt. purchases– some farm commodity programs,– defense spending– automobiles and trucks– office furniture and supplies– etc.
10
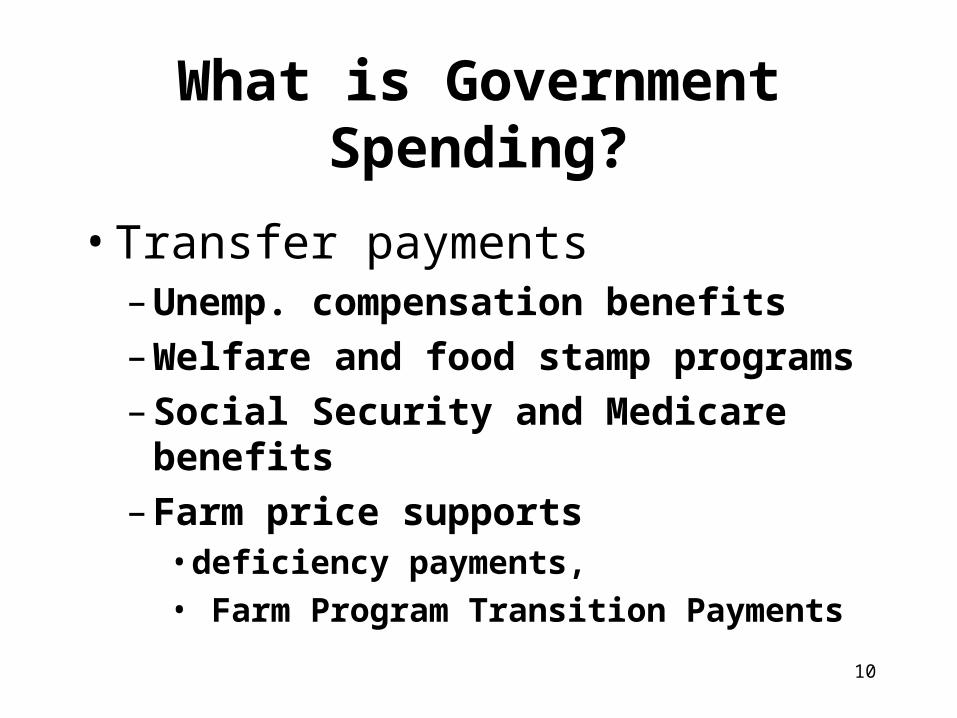
What is Government Spending?
• Transfer payments– Unemp. compensation benefits
– Welfare and food stamp programs
– Social Security and Medicare benefits
– Farm price supports • deficiency payments,
• Farm Program Transition Payments
11
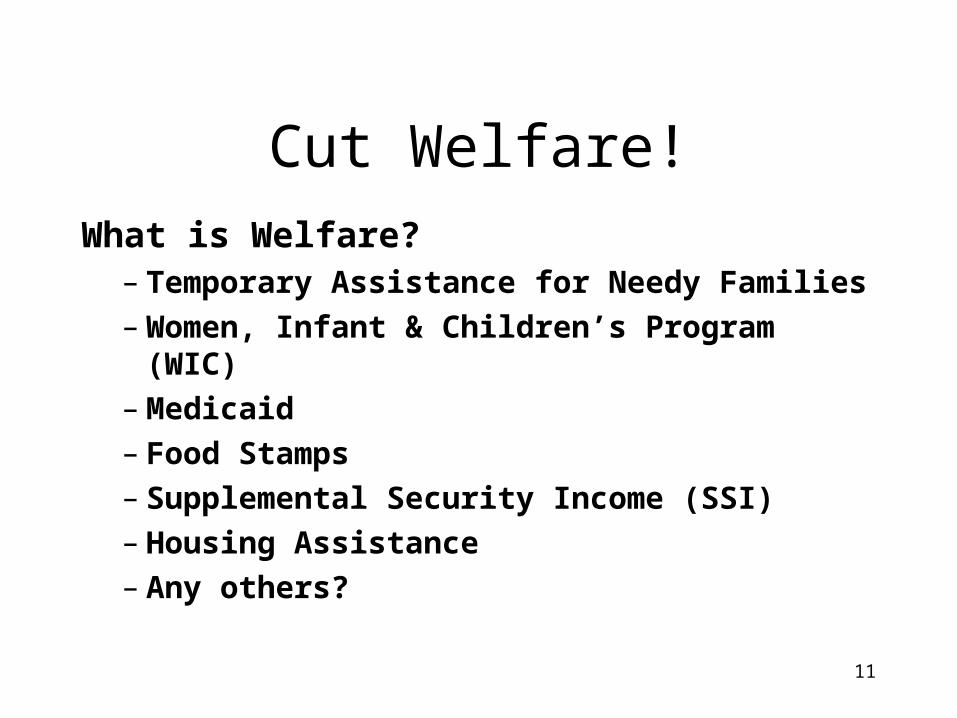
Cut Welfare!
What is Welfare?– Temporary Assistance for Needy Families
– Women, Infant & Children’s Program (WIC)
– Medicaid
– Food Stamps
– Supplemental Security Income (SSI)
– Housing Assistance
– Any others?
12
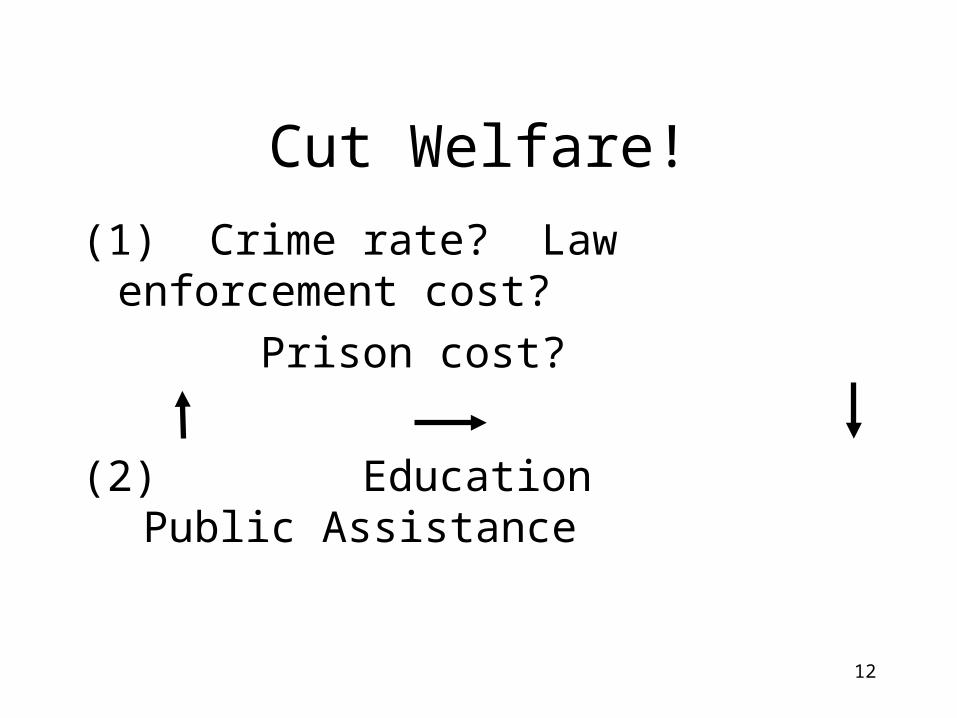
Cut Welfare!
(1) Crime rate? Law enforcement cost?
Prison cost?
(2) Education Public Assistance
13
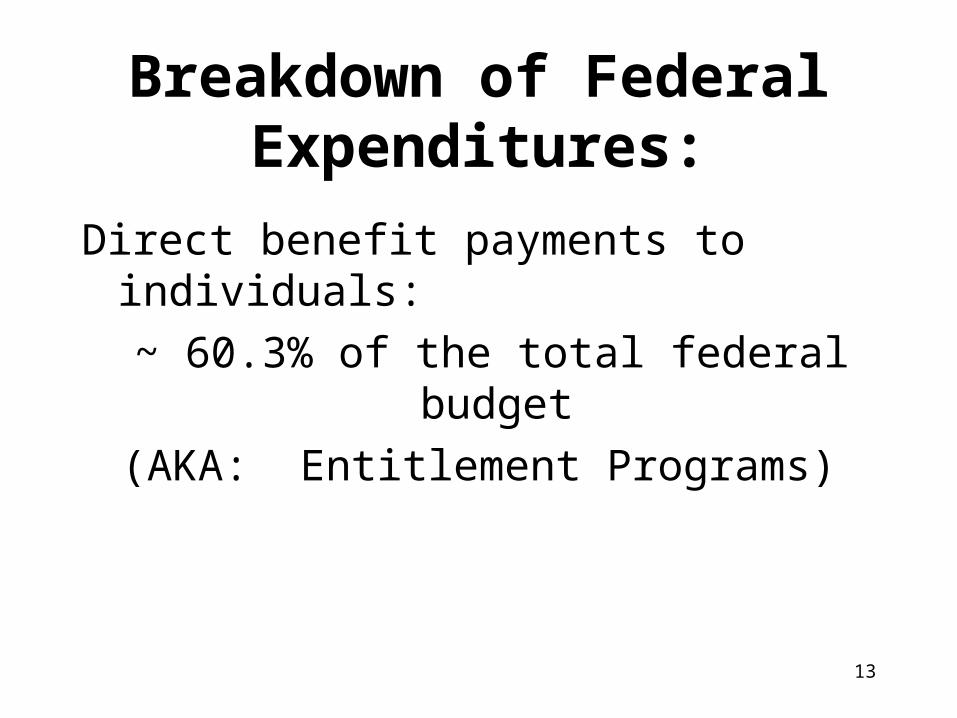
Breakdown of Federal Expenditures:
Direct benefit payments to individuals:
~ 60.3% of the total federal budget
(AKA: Entitlement Programs)
14
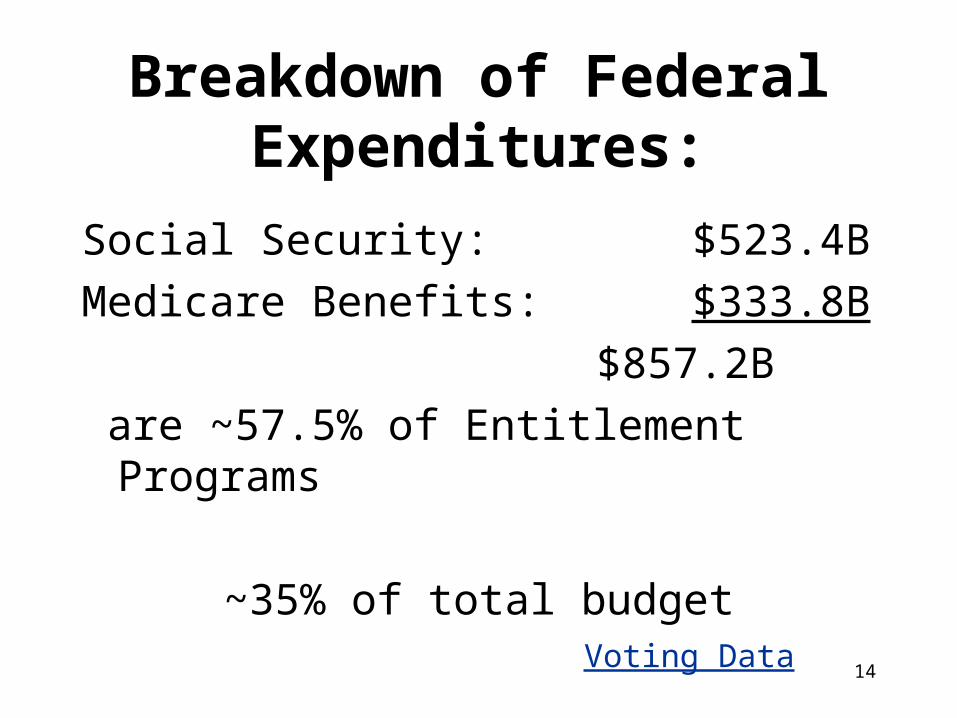
Breakdown of Federal Expenditures:
Social Security: $523.4B
Medicare Benefits: $333.8B
$857.2B
are ~57.5% of Entitlement Programs
~35% of total budget
Voting Data
15
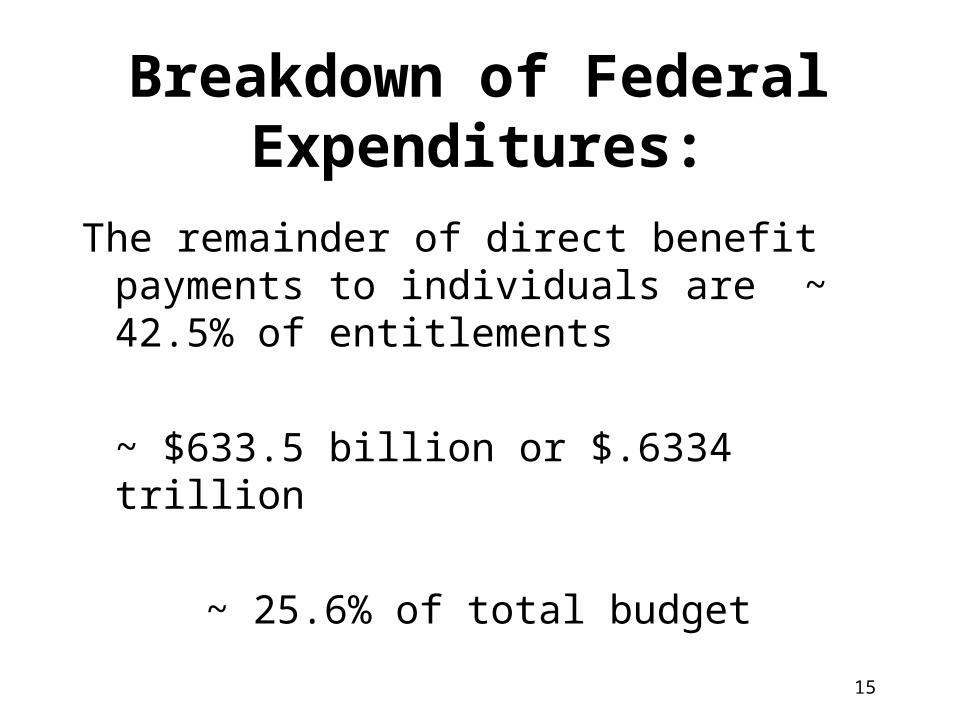
Breakdown of Federal Expenditures:
The remainder of direct benefit payments to individuals are ~ 42.5% of entitlements
~ $633.5 billion or $.6334 trillion
~ 25.6% of total budget
16
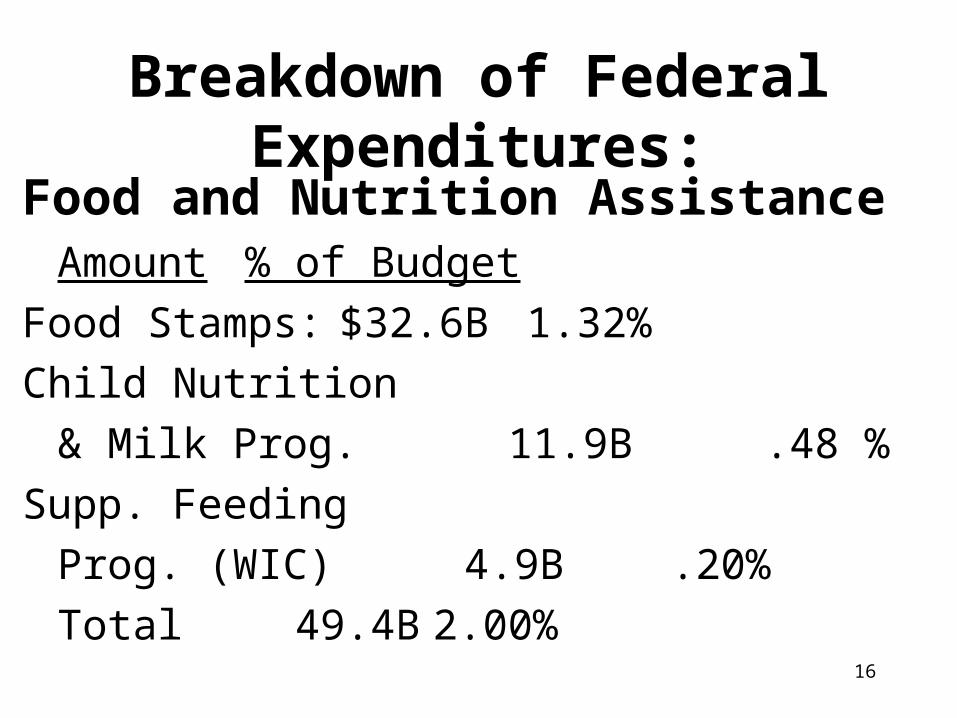
Breakdown of Federal Expenditures:
Food and Nutrition AssistanceAmount % of Budget
Food Stamps: $32.6B 1.32%
Child Nutrition
& Milk Prog. 11.9B .48 %
Supp. Feeding
Prog. (WIC) 4.9B .20%
Total 49.4B 2.00%
17
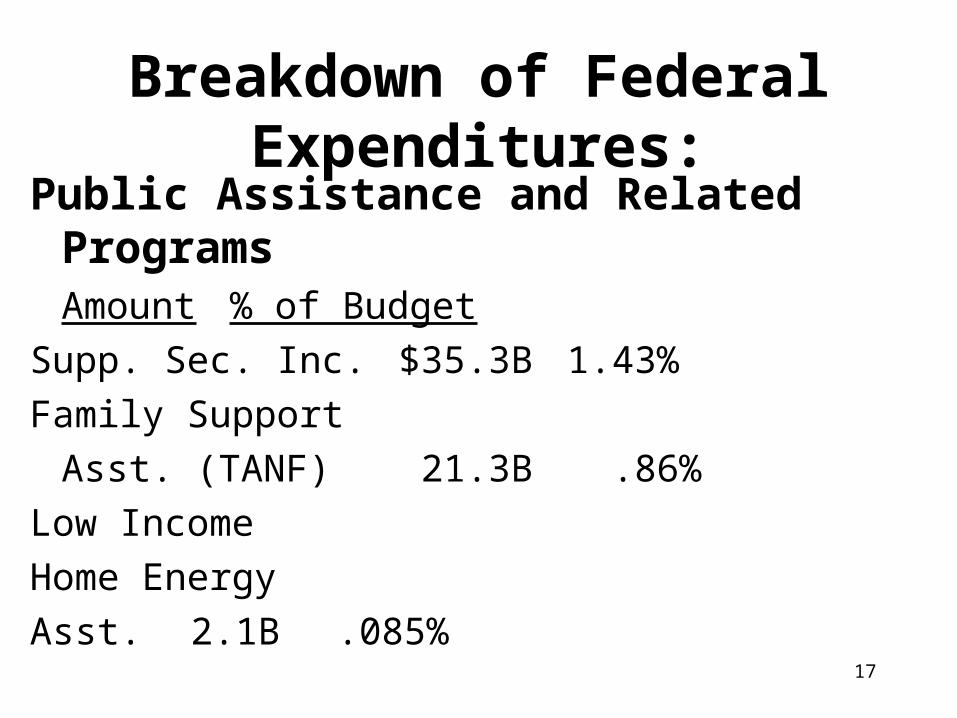
Breakdown of Federal Expenditures:
Public Assistance and Related ProgramsAmount % of Budget
Supp. Sec. Inc. $35.3B 1.43%
Family Support
Asst. (TANF) 21.3B .86%
Low Income
Home Energy
Asst. 2.1B .085%
18
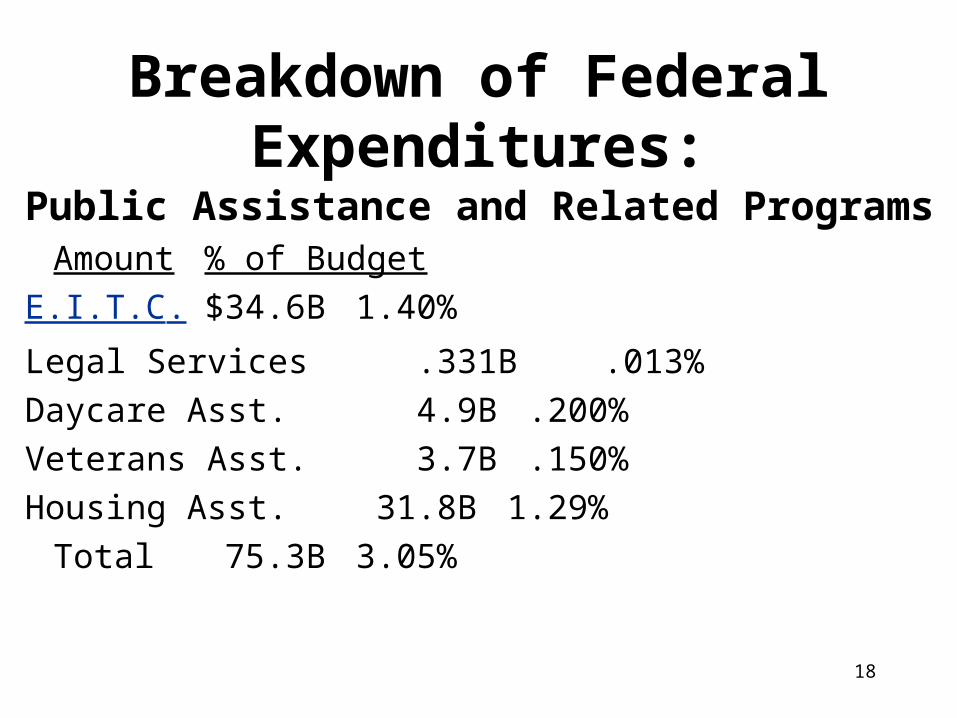
Breakdown of Federal Expenditures:
Public Assistance and Related ProgramsAmount % of Budget
E.I.T.C. $34.6B 1.40%
Legal Services .331B .013%
Daycare Asst. 4.9B .200%
Veterans Asst. 3.7B .150%
Housing Asst. 31.8B 1.29%
Total 75.3B 3.05%
19
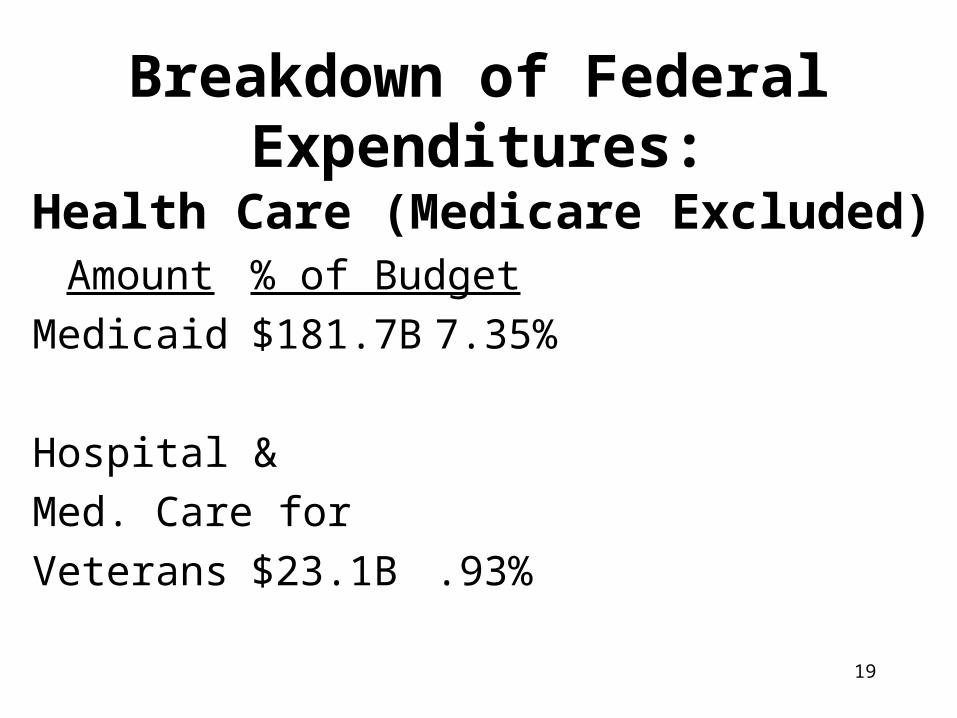
Breakdown of Federal Expenditures:
Health Care (Medicare Excluded)Amount % of Budget
Medicaid $181.7B 7.35%
Hospital &
Med. Care for
Veterans $23.1B .93%
20
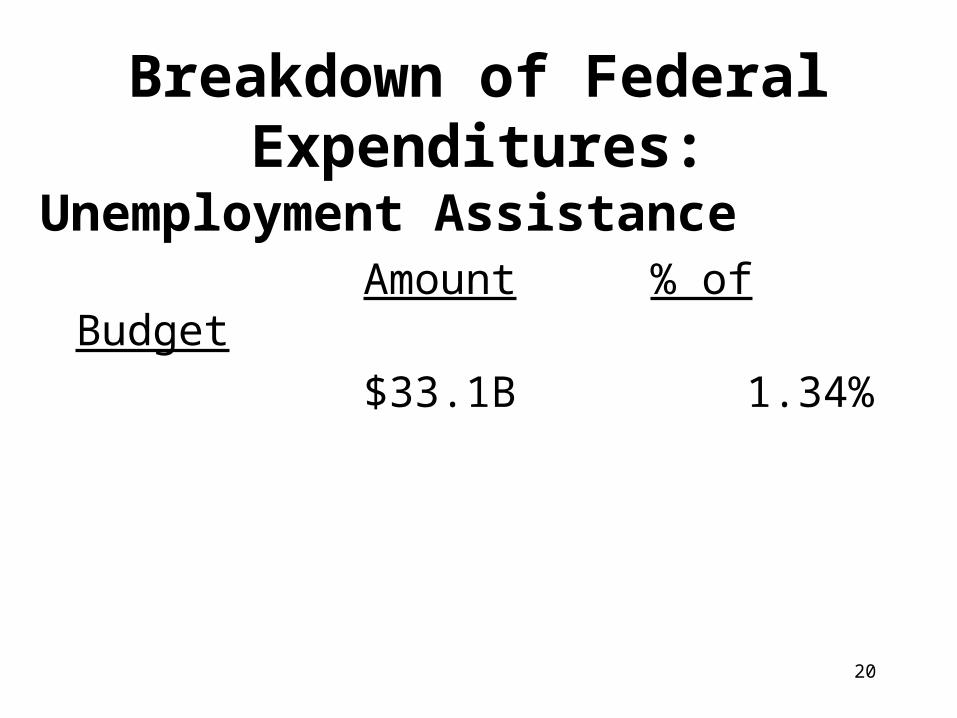
Breakdown of Federal Expenditures:
Unemployment AssistanceAmount % of Budget
$33.1B 1.34%
21
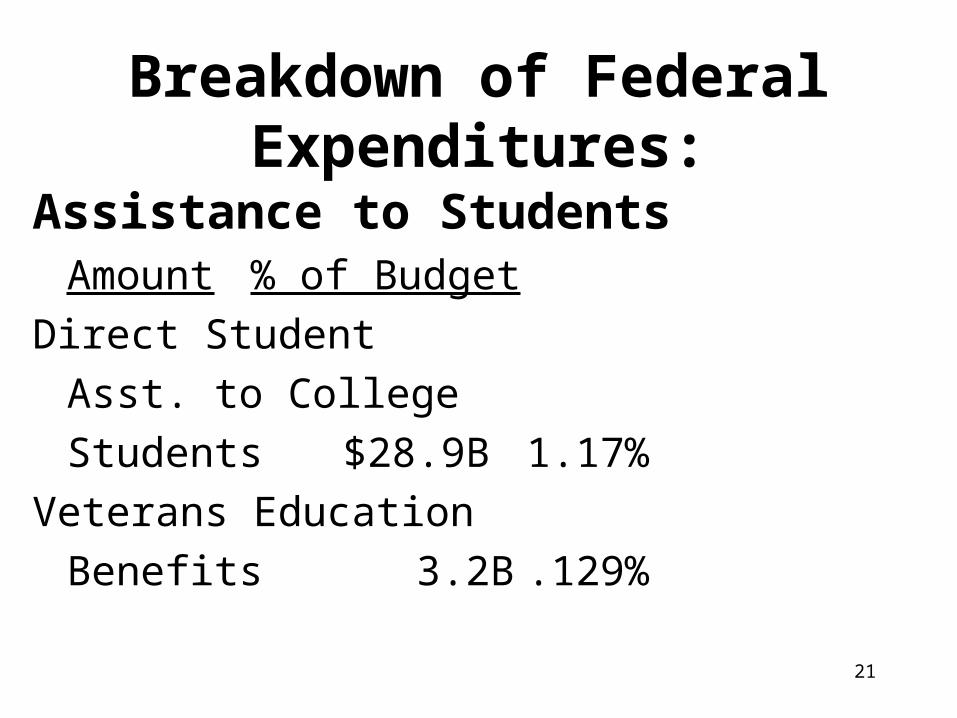
Breakdown of Federal Expenditures:
Assistance to StudentsAmount % of Budget
Direct Student
Asst. to College
Students $28.9B 1.17%
Veterans Education
Benefits 3.2B .129%
22
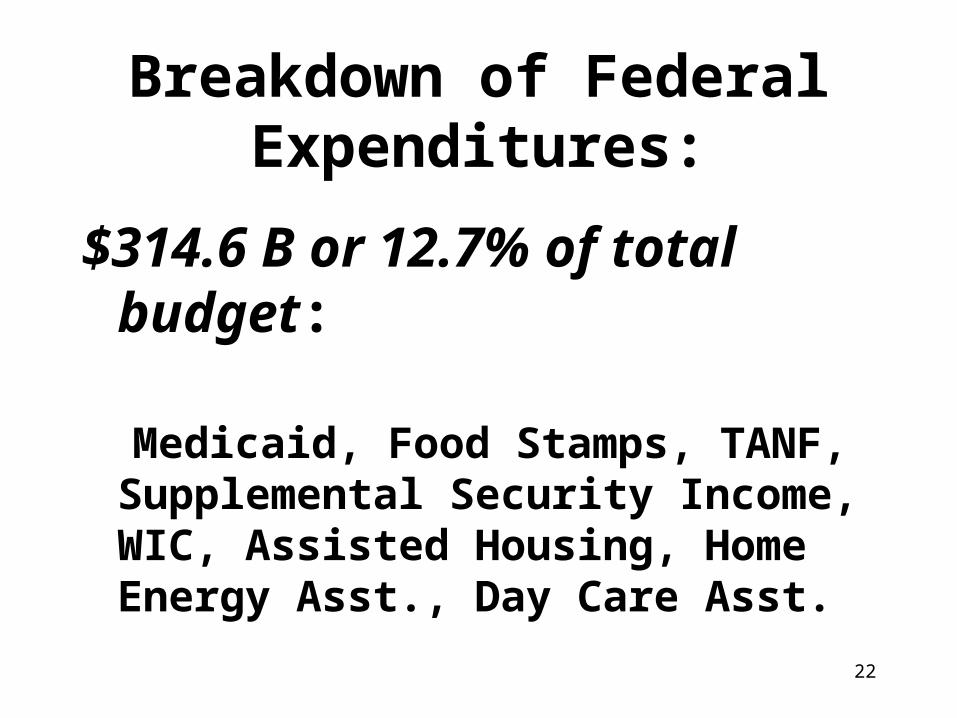
Breakdown of Federal Expenditures:
$314.6 B or 12.7% of total budget:
Medicaid, Food Stamps, TANF, Supplemental Security Income, WIC, Assisted Housing, Home Energy Asst., Day Care Asst.
23
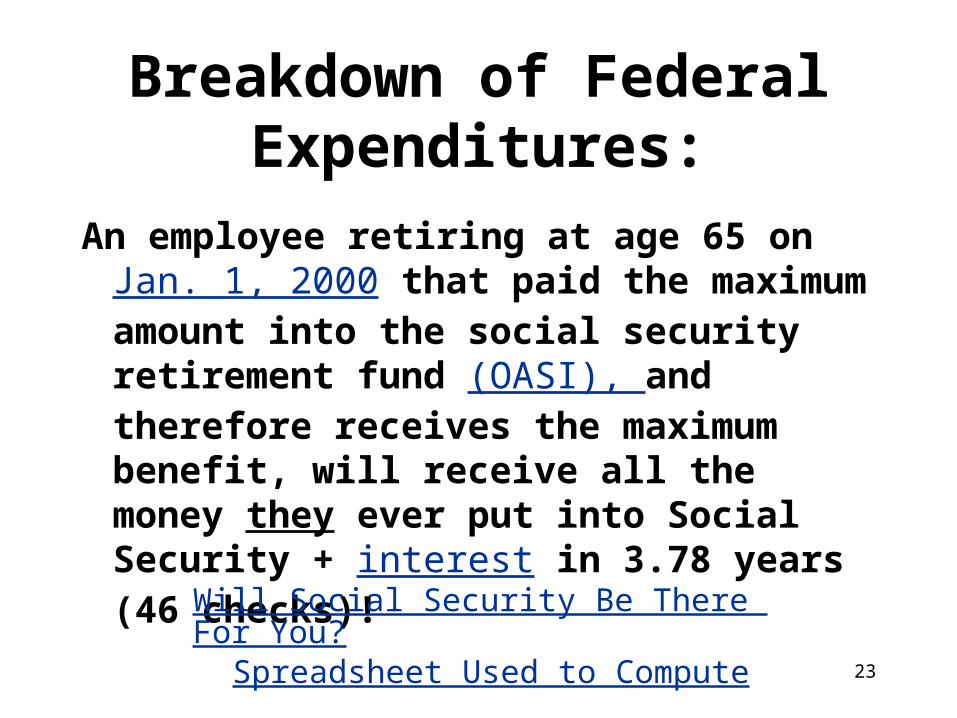
Breakdown of Federal Expenditures:
An employee retiring at age 65 on Jan. 1, 2000 that paid the maximum amount into the social security retirement fund (OASI), and therefore receives the maximum benefit, will receive all the money they ever put into Social Security + interest in 3.78 years (46 checks)! Will Social Security Be There For You?
Spreadsheet Used to Compute
24
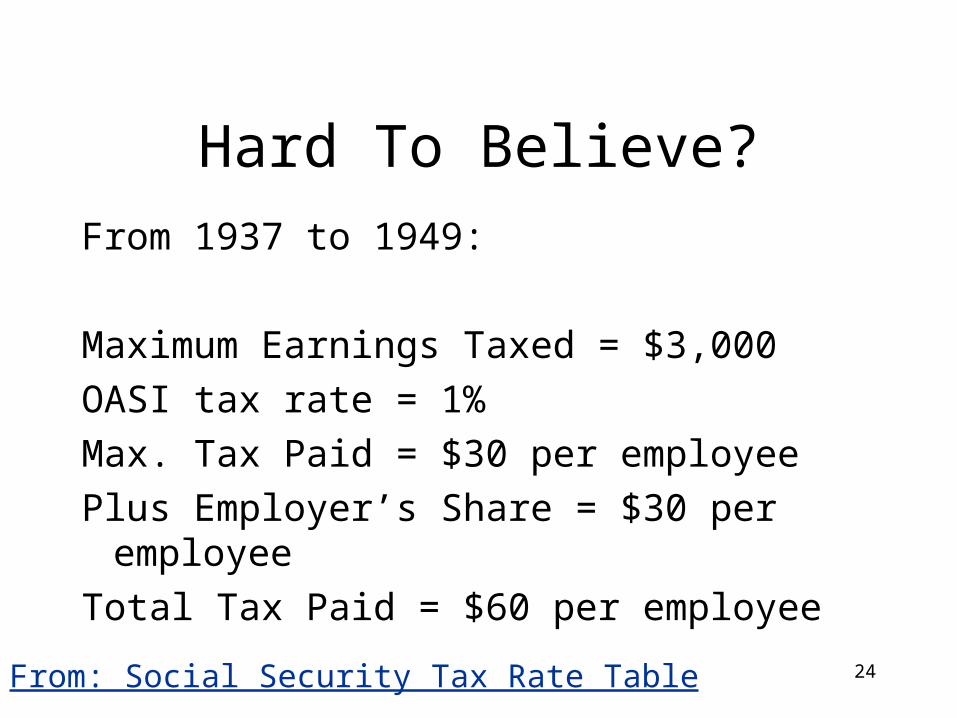
Hard To Believe?
From 1937 to 1949:
Maximum Earnings Taxed = $3,000
OASI tax rate = 1%
Max. Tax Paid = $30 per employee
Plus Employer’s Share = $30 per employee
Total Tax Paid = $60 per employee
From: Social Security Tax Rate Table
25
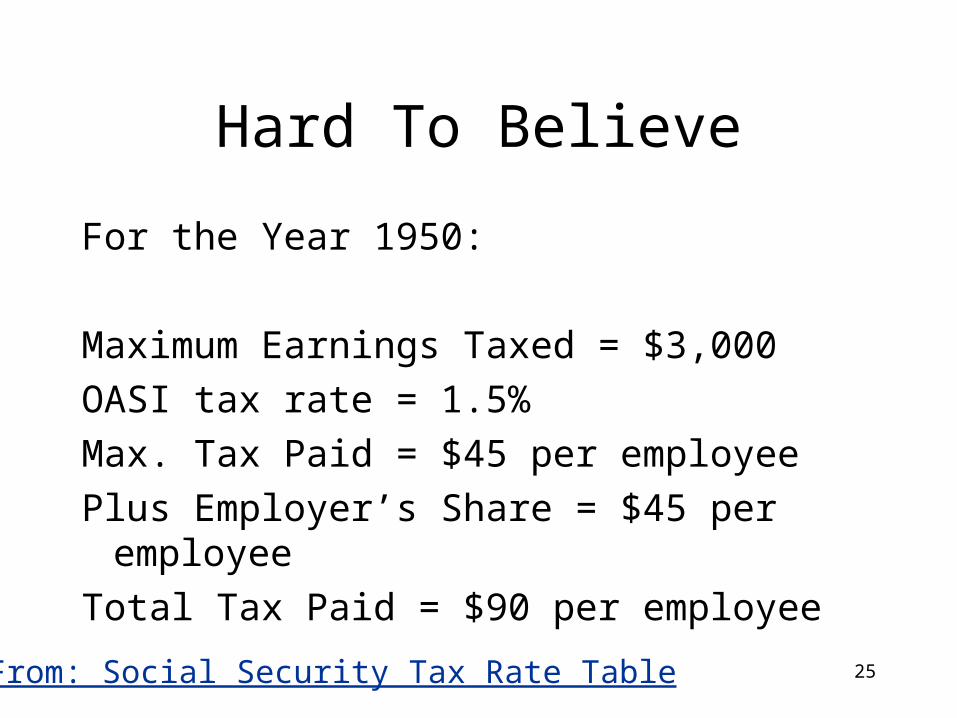
Hard To Believe
For the Year 1950:
Maximum Earnings Taxed = $3,000
OASI tax rate = 1.5%
Max. Tax Paid = $45 per employee
Plus Employer’s Share = $45 per employee
Total Tax Paid = $90 per employeeFrom: Social Security Tax Rate Table
26
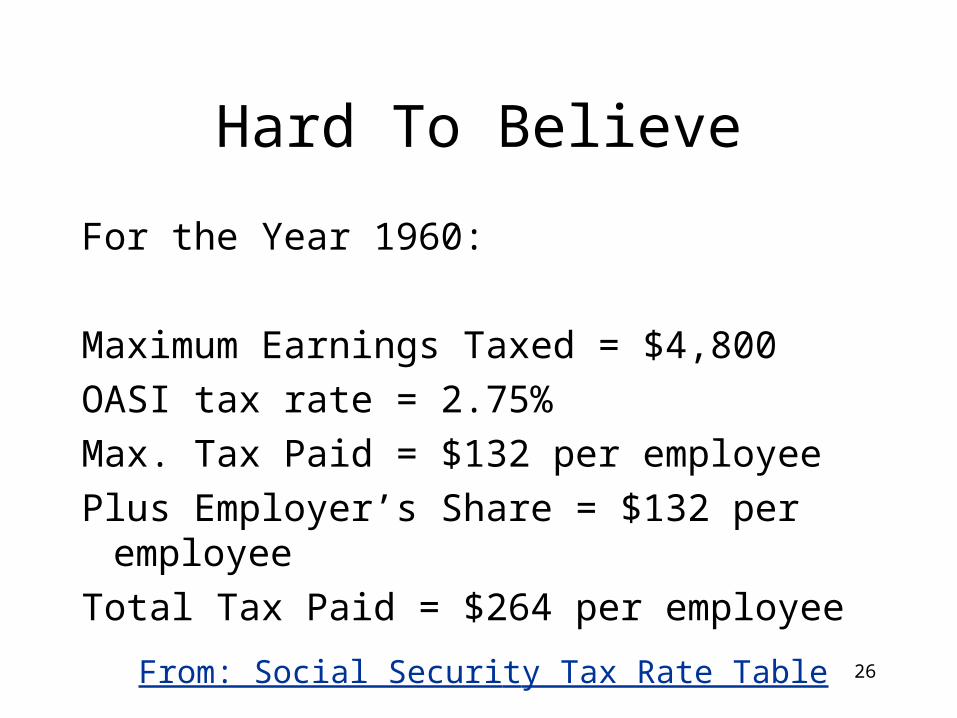
Hard To Believe
For the Year 1960:
Maximum Earnings Taxed = $4,800
OASI tax rate = 2.75%
Max. Tax Paid = $132 per employee
Plus Employer’s Share = $132 per employee
Total Tax Paid = $264 per employeeFrom: Social Security Tax Rate Table
27
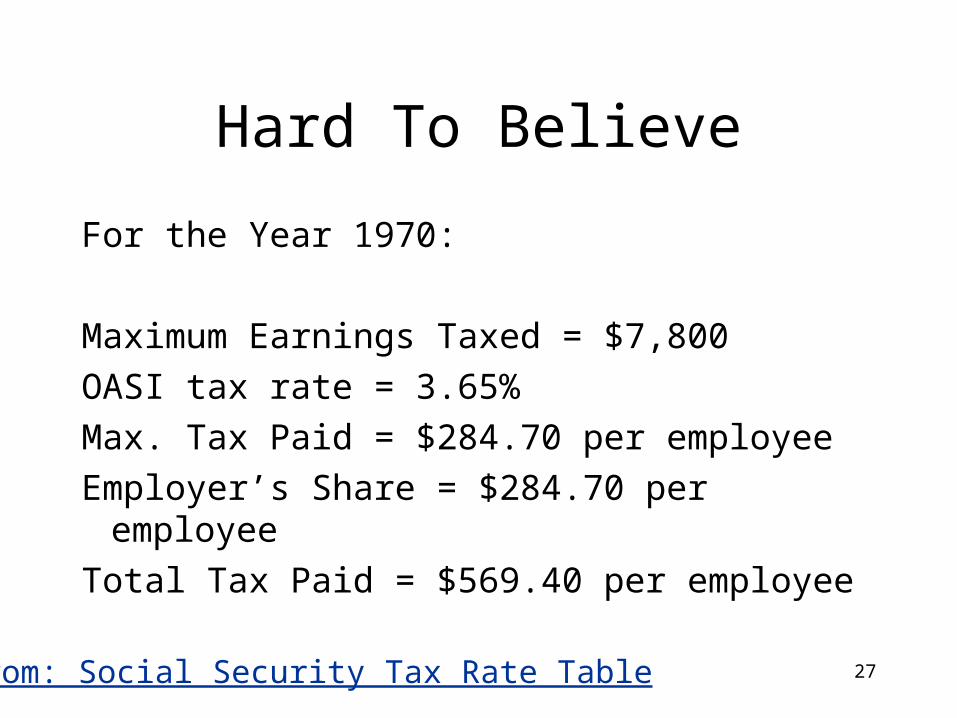
Hard To Believe
For the Year 1970:
Maximum Earnings Taxed = $7,800
OASI tax rate = 3.65%
Max. Tax Paid = $284.70 per employee
Employer’s Share = $284.70 per employee
Total Tax Paid = $569.40 per employeeFrom: Social Security Tax Rate Table
28
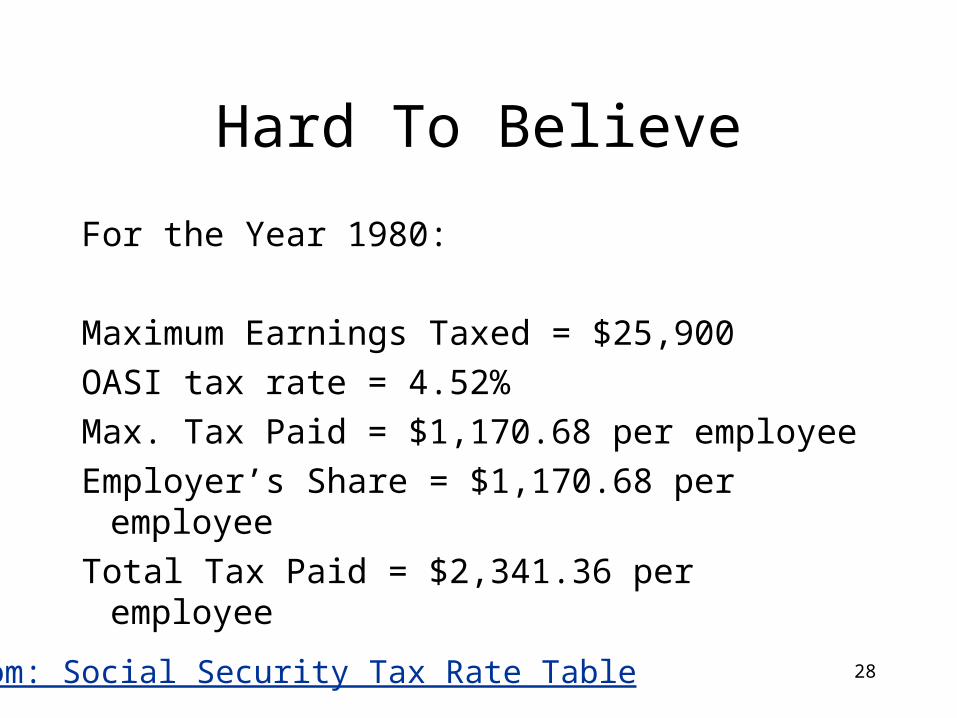
Hard To Believe
For the Year 1980:
Maximum Earnings Taxed = $25,900
OASI tax rate = 4.52%
Max. Tax Paid = $1,170.68 per employee
Employer’s Share = $1,170.68 per employee
Total Tax Paid = $2,341.36 per employeeFrom: Social Security Tax Rate Table
29
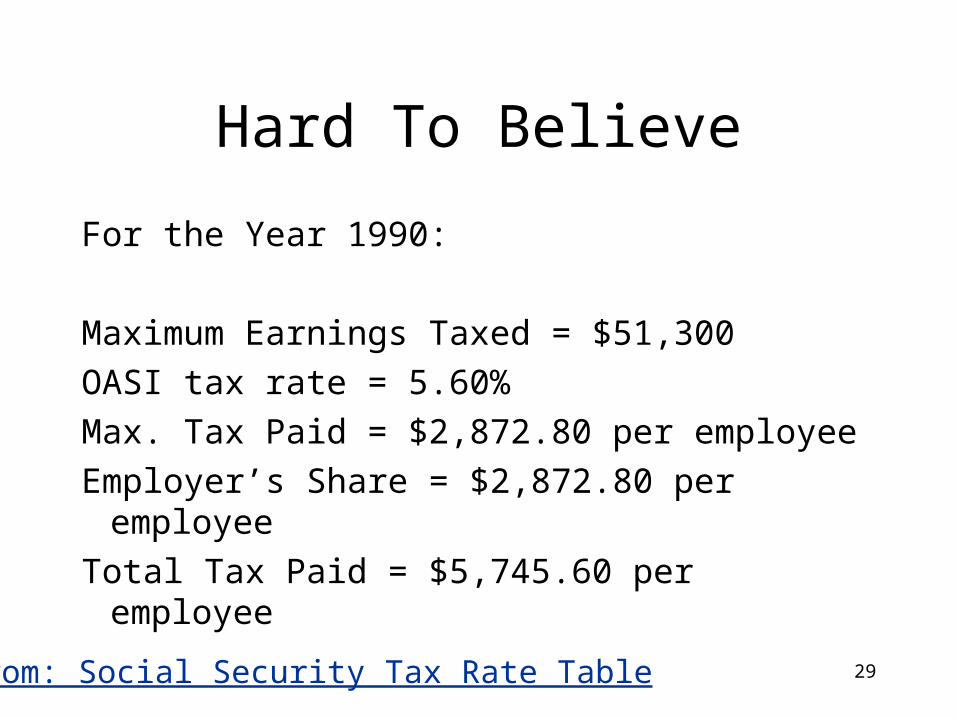
Hard To Believe
For the Year 1990:
Maximum Earnings Taxed = $51,300
OASI tax rate = 5.60%
Max. Tax Paid = $2,872.80 per employee
Employer’s Share = $2,872.80 per employee
Total Tax Paid = $5,745.60 per employeeFrom: Social Security Tax Rate Table
30
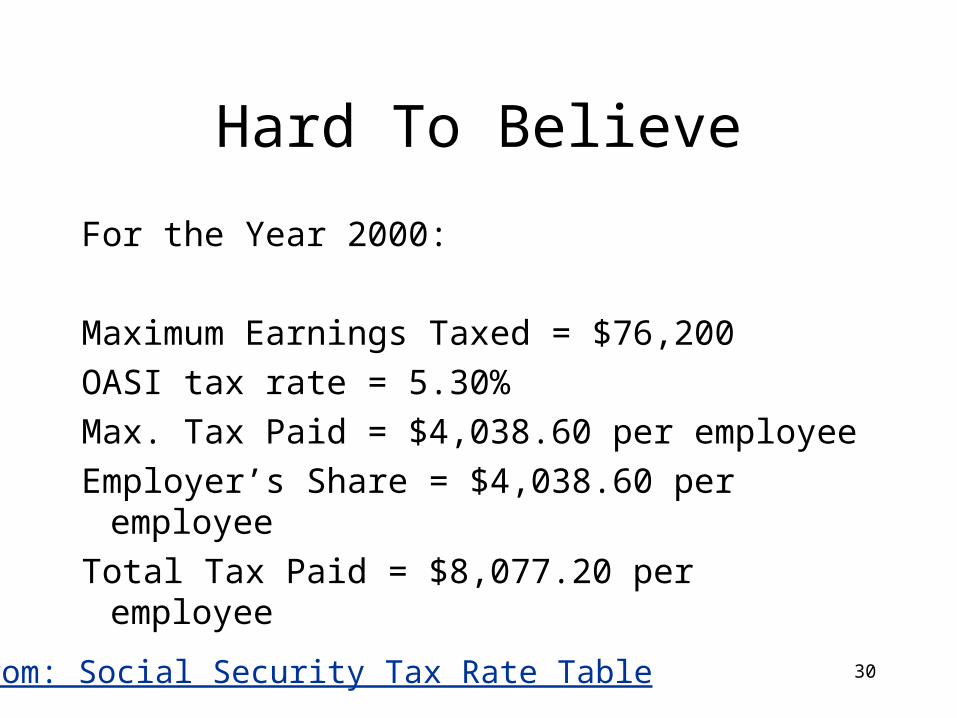
Hard To Believe
For the Year 2000:
Maximum Earnings Taxed = $76,200
OASI tax rate = 5.30%
Max. Tax Paid = $4,038.60 per employee
Employer’s Share = $4,038.60 per employee
Total Tax Paid = $8,077.20 per employeeFrom: Social Security Tax Rate Table
31
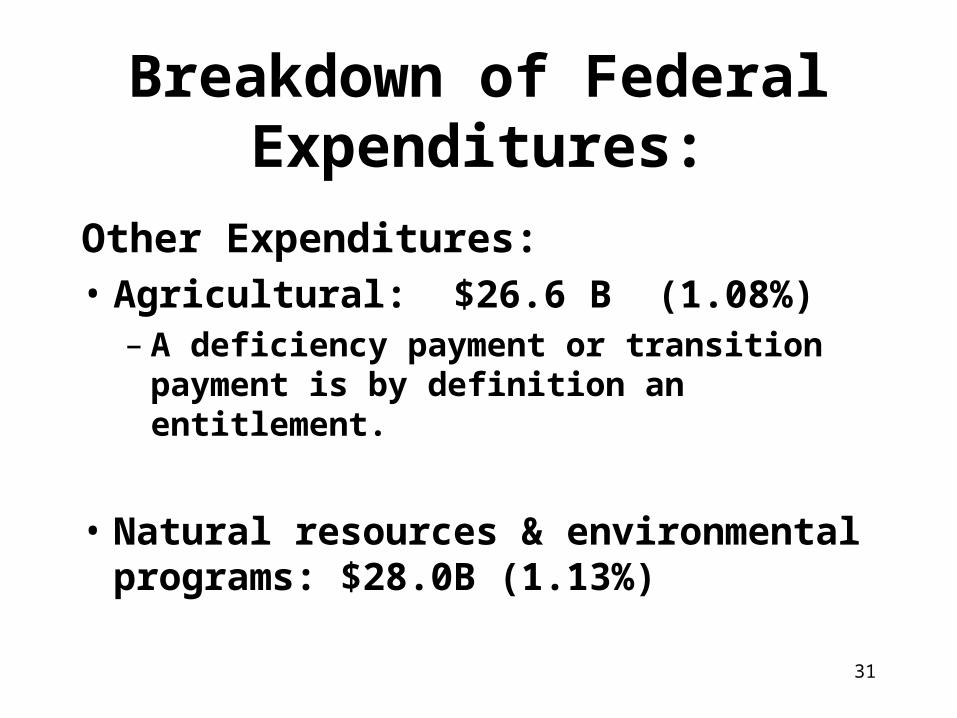
Breakdown of Federal Expenditures:
Other Expenditures: • Agricultural: $26.6 B (1.08%)
– A deficiency payment or transition payment is by definition an entitlement.
• Natural resources & environmental programs: $28.0B (1.13%)
32
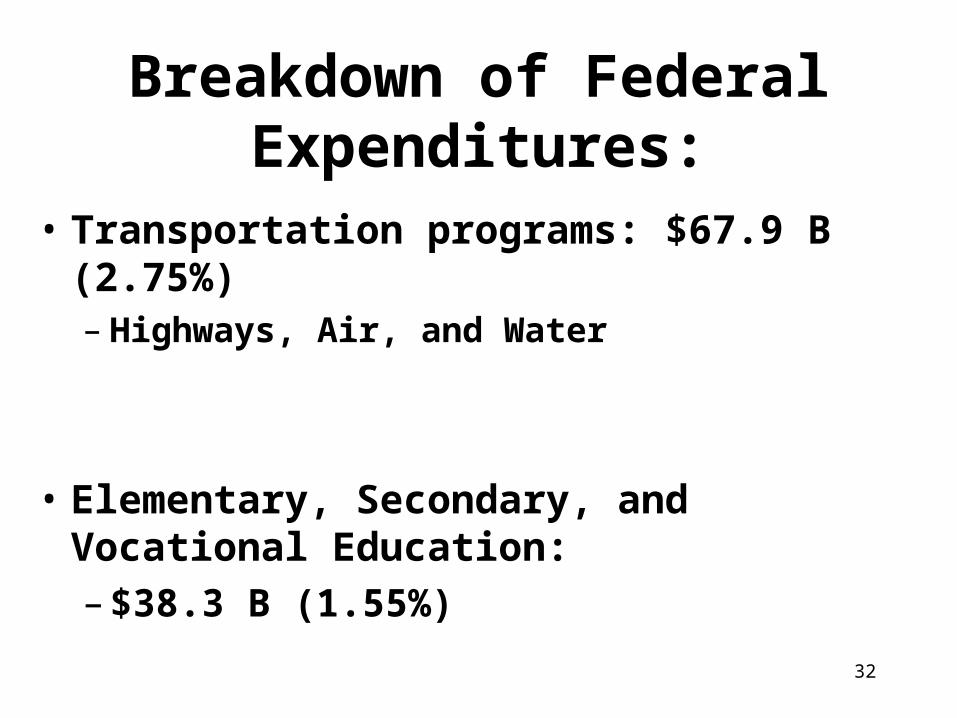
Breakdown of Federal Expenditures:
• Transportation programs: $67.9 B (2.75%)– Highways, Air, and Water
• Elementary, Secondary, and Vocational Education:– $38.3 B (1.55%)
33
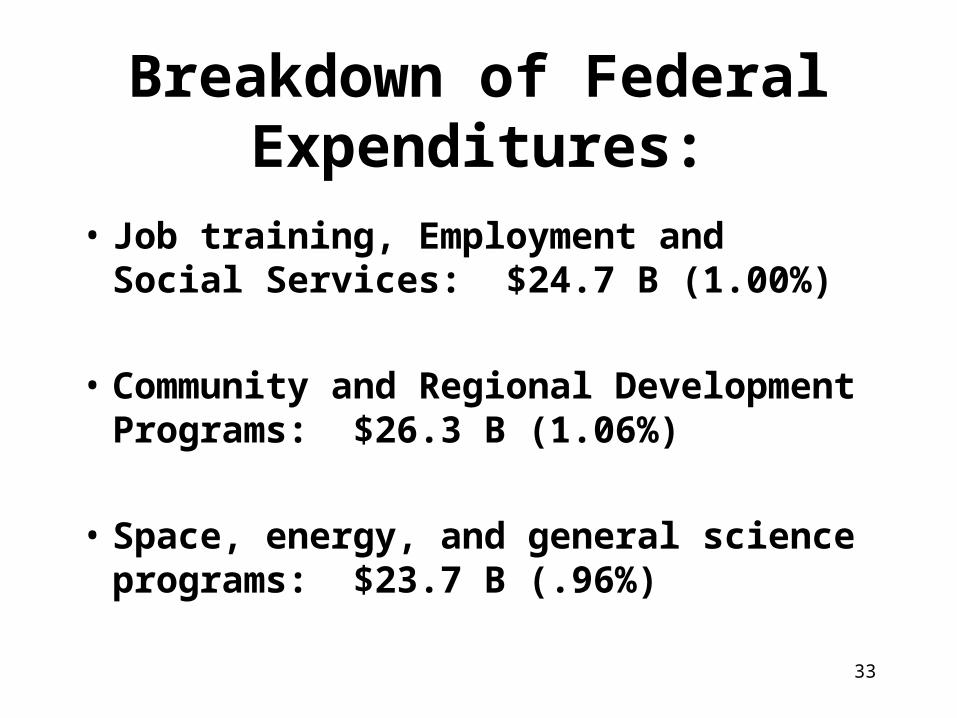
Breakdown of Federal Expenditures:
• Job training, Employment and Social Services: $24.7 B (1.00%)
• Community and Regional Development Programs: $26.3 B (1.06%)
• Space, energy, and general science programs: $23.7 B (.96%)
34
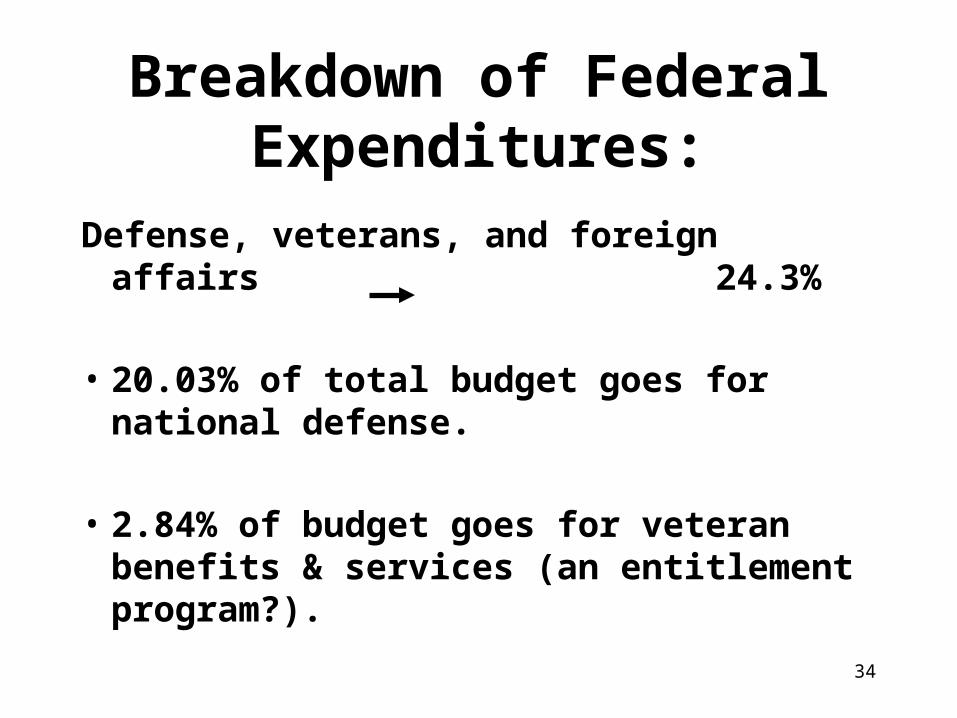
Breakdown of Federal Expenditures:
Defense, veterans, and foreign affairs 24.3%
• 20.03% of total budget goes for national defense.
• 2.84% of budget goes for veteran benefits & services (an entitlement program?).
35
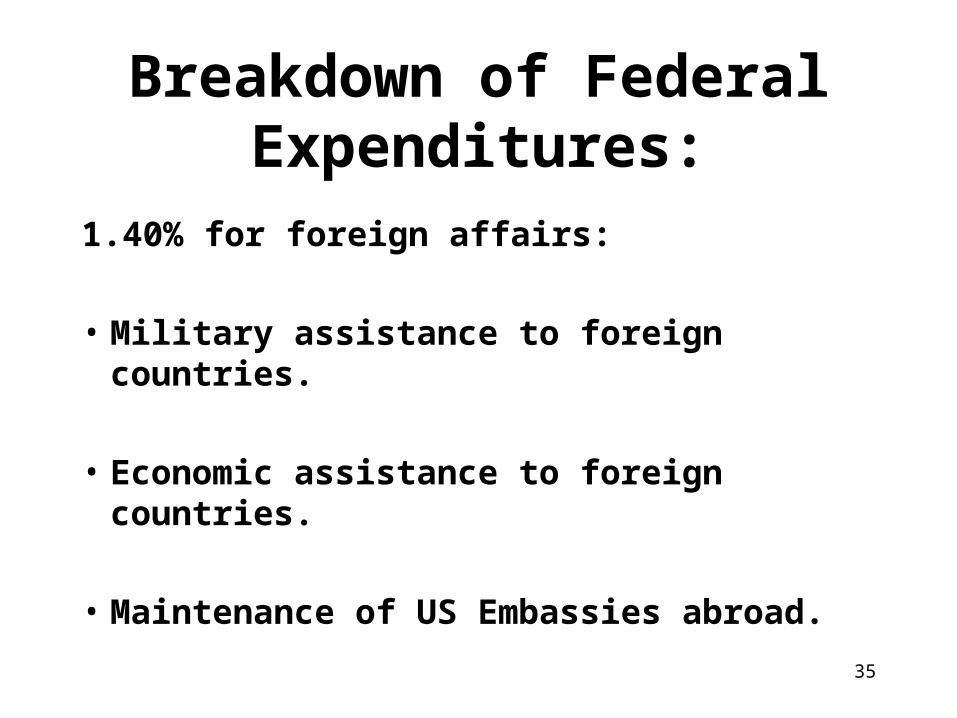
Breakdown of Federal Expenditures:
1.40% for foreign affairs:
• Military assistance to foreign countries.
• Economic assistance to foreign countries.
• Maintenance of US Embassies abroad.
36
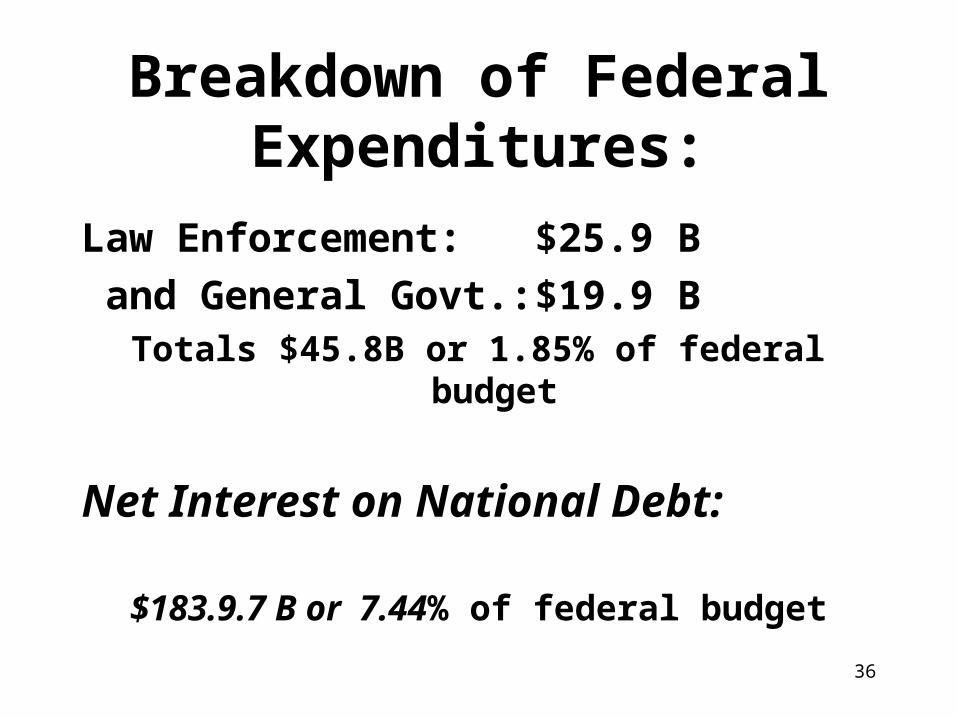
Breakdown of Federal Expenditures:
Law Enforcement: $25.9 B
and General Govt.: $19.9 BTotals $45.8B or 1.85% of federal budget
Net Interest on National Debt:
$183.9.7 B or 7.44% of federal budget
37
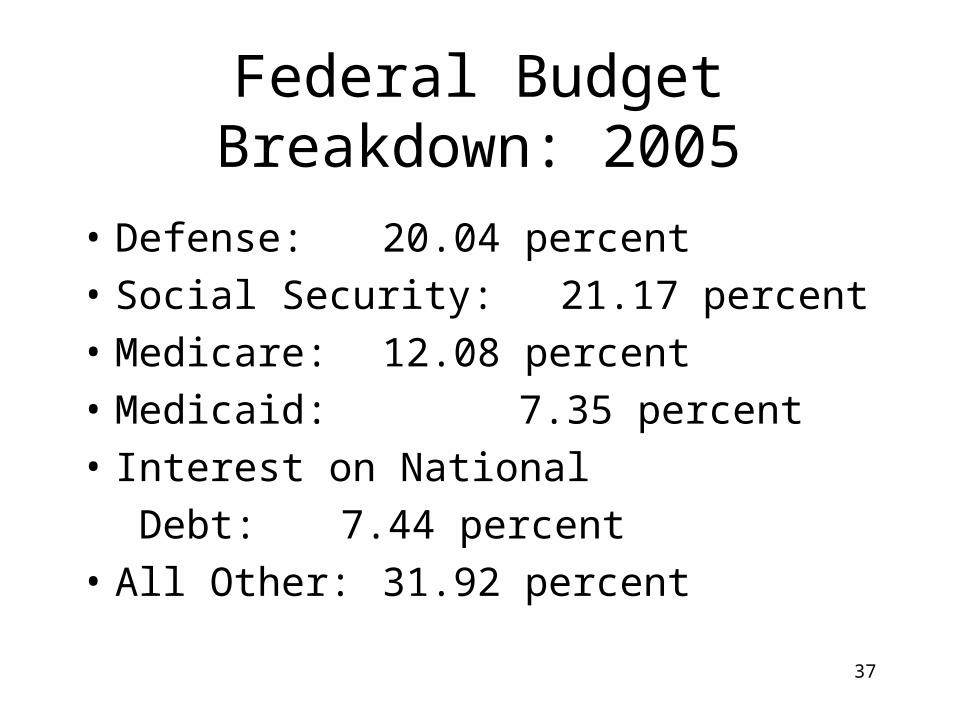
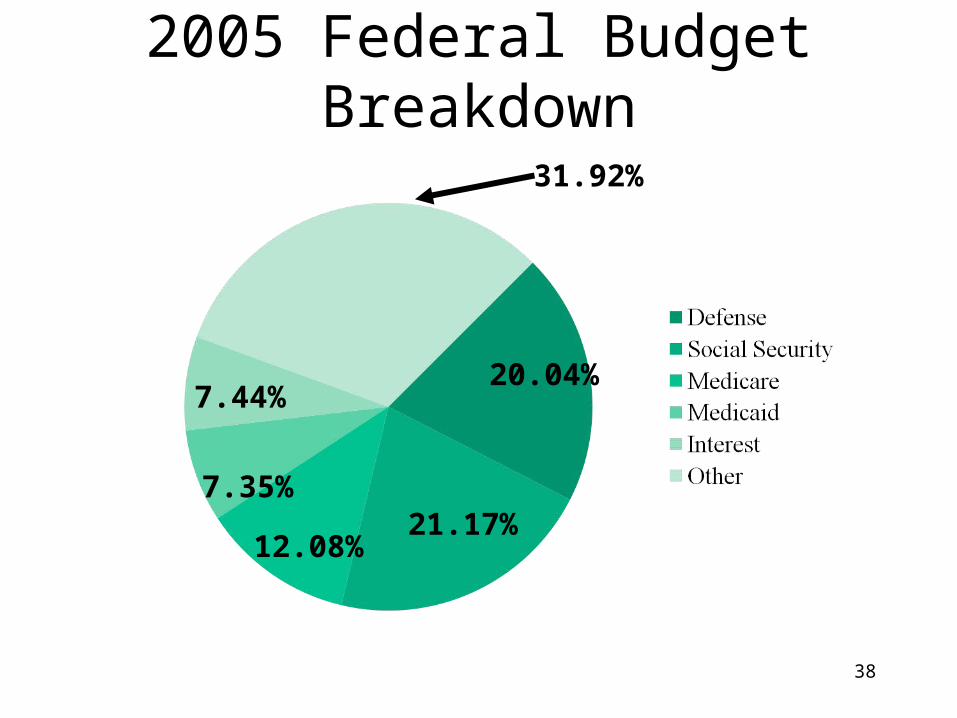
Federal Budget Breakdown: 2005
• Defense: 20.04 percent
• Social Security: 21.17 percent
• Medicare: 12.08 percent
• Medicaid: 7.35 percent
• Interest on National
Debt: 7.44 percent
• All Other: 31.92 percent
38
2005 Federal Budget Breakdown31.92%
20.04%7.44%
7.35%
12.08%21.17%
39
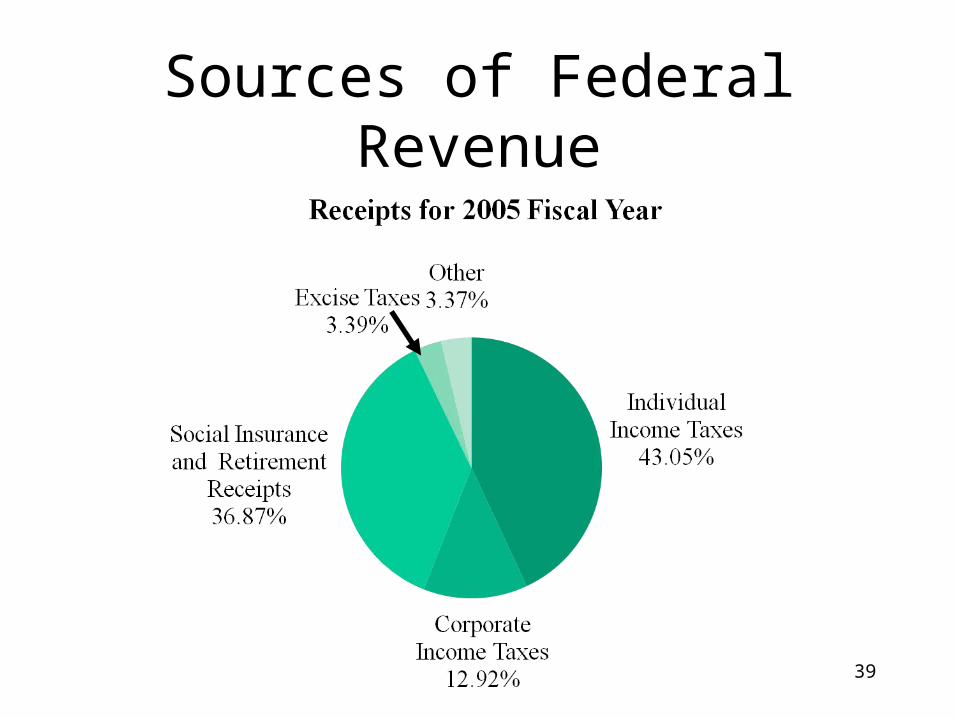
Sources of Federal Revenue
40
For More Information:Read:
• Budget of the United States Government:
Fiscal Year 2007
Additional Resource:
Budget of the United States Government:
Fiscal Year 1999
Other Budgets of the United States Government:
Fiscal Years 1996 forward
41
For More Information:
Read:
• “A Citizens Guide to the Federal Budget, Various Fiscal Years”
.
42
For More Information:Take a look at:
Budget of the United States Government,
Fiscal Year 2007, Historical Tables
This was my primary source for the Federal Budget Presentation.
43
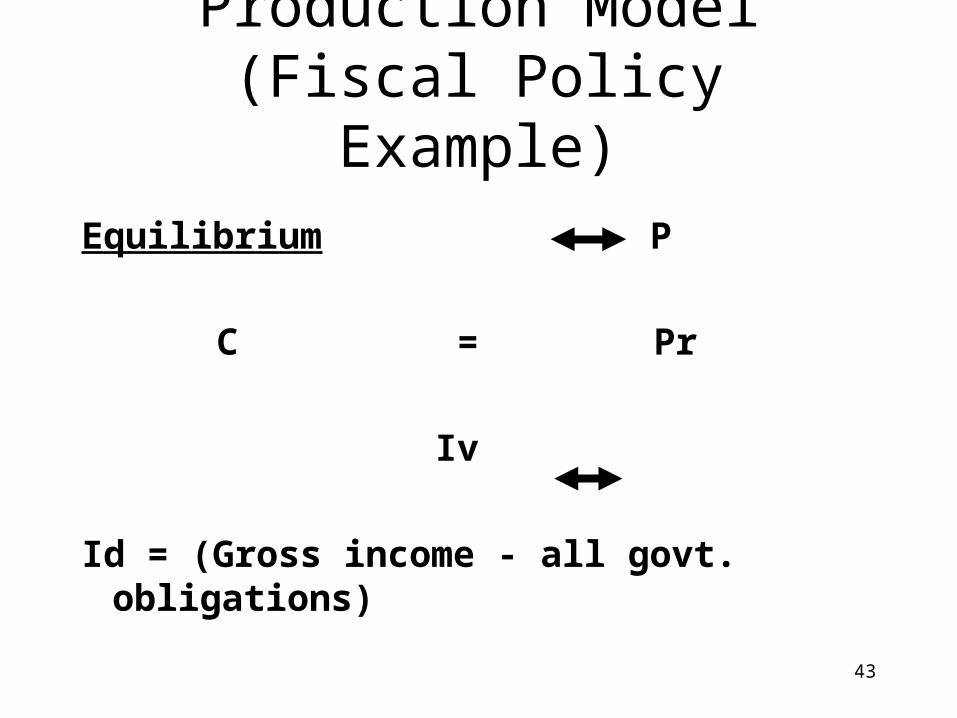
Consumption - Production Model (Fiscal Policy Example)
Equilibrium P
C = Pr
Iv
Id = (Gross income - all govt. obligations)
44
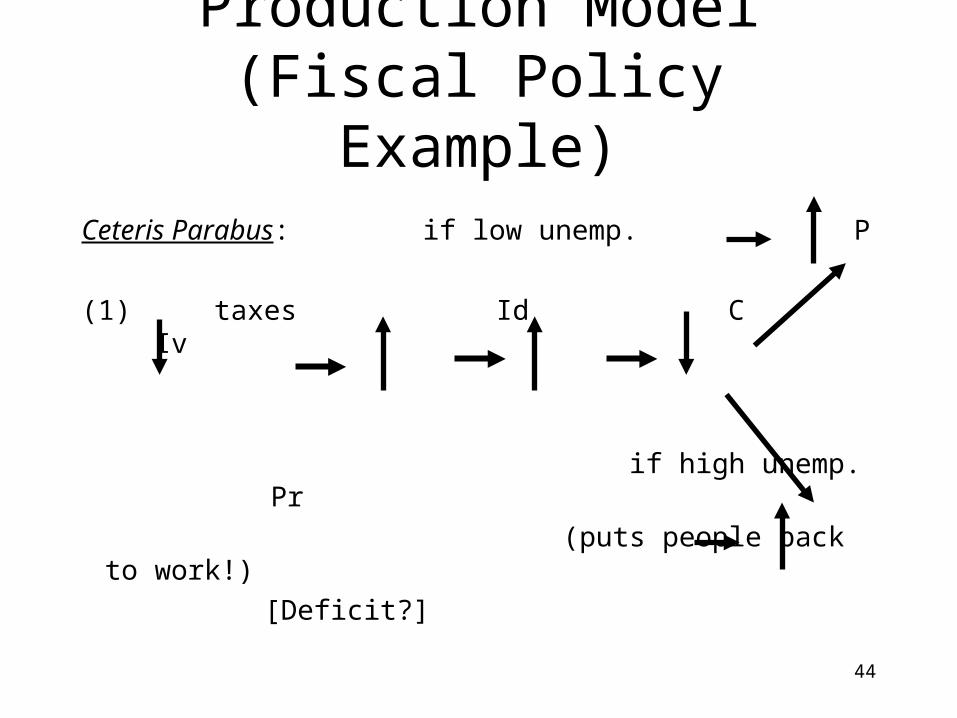
Consumption - Production Model (Fiscal Policy Example)
Ceteris Parabus: if low unemp. P
(1) taxes Id C Iv
if high unemp. Pr
(puts people back to work!)
[Deficit?]
45
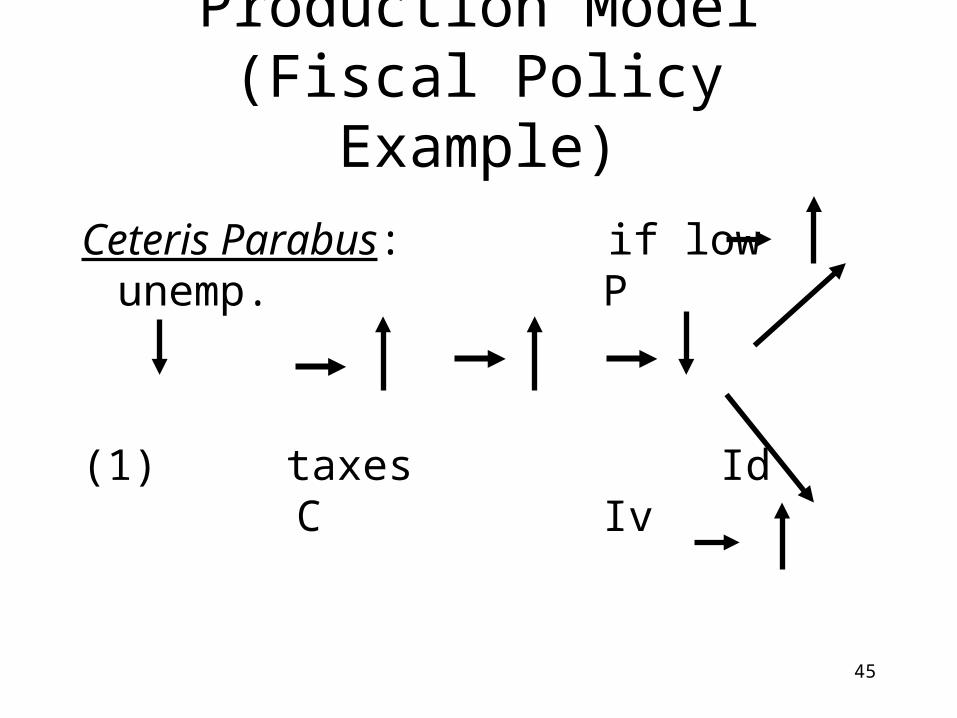
Consumption - Production Model (Fiscal Policy Example)
Ceteris Parabus: if low unemp. P
(1) taxes Id C Iv
if high unemp. Pr
(puts people back to work!)
[Deficit?]
46
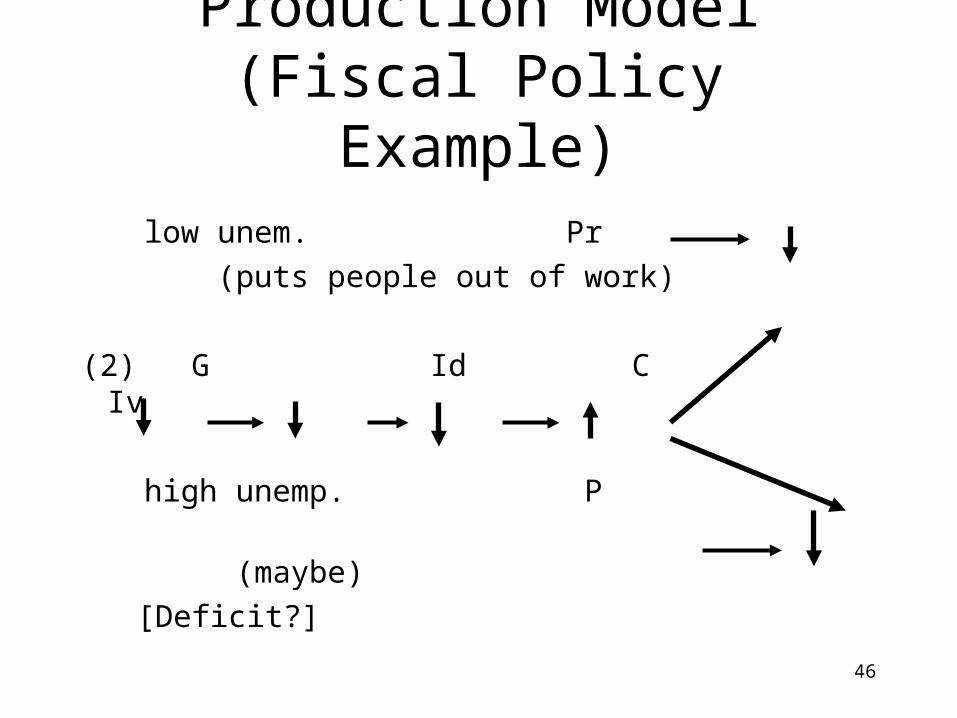
Consumption - Production Model (Fiscal Policy Example)
low unem. Pr
(puts people out of work)
(2) G Id C Iv
high unemp. P
(maybe)
[Deficit?]

47
Consumption - Production Model (Fiscal Policy Example)
low unem. Pr
(puts people out of work)
(2) G Id C Iv
high unemp. P
(maybe)
[Deficit?]
48
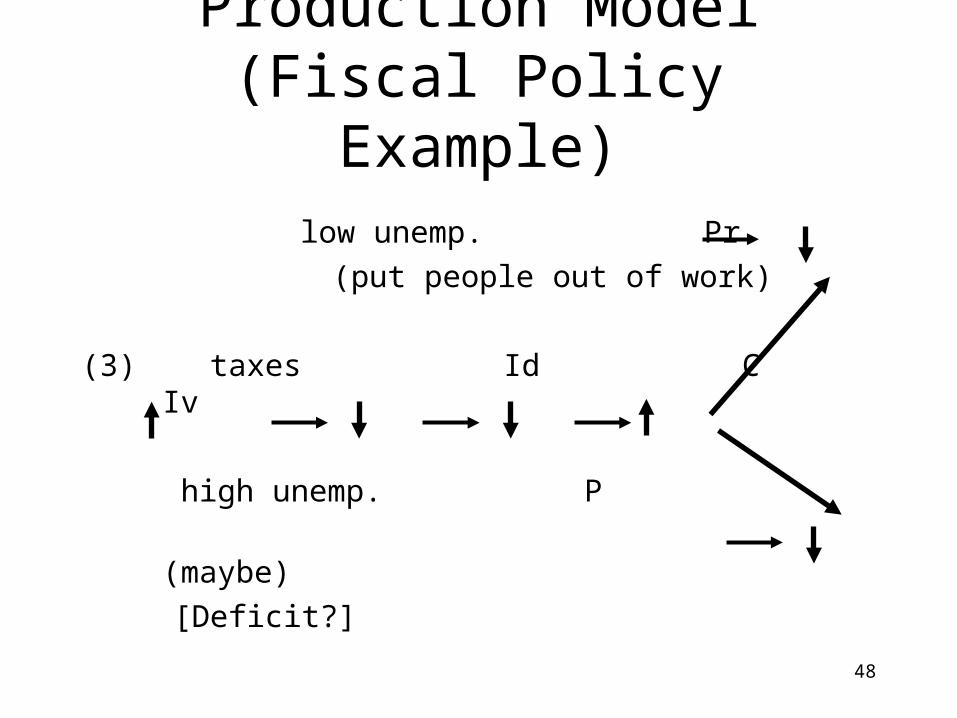
Consumption - Production Model (Fiscal Policy Example)
low unemp. Pr
(put people out of work)
(3) taxes Id C Iv
high unemp. P
(maybe)
[Deficit?]
49
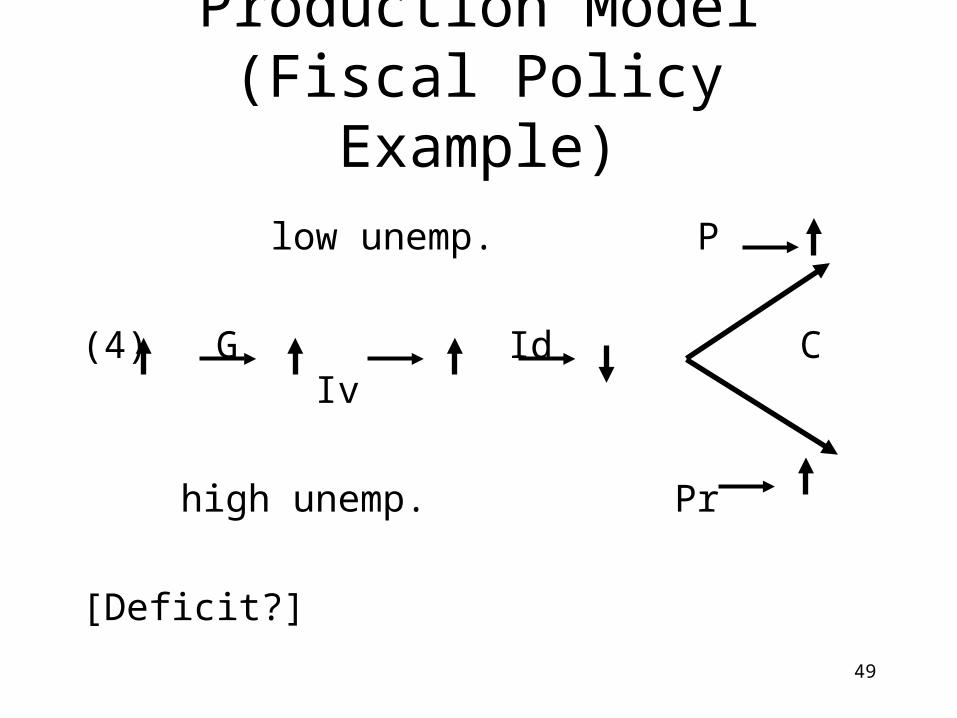
Consumption - Production Model (Fiscal Policy Example)
low unemp. P
(4) G Id C Iv
high unemp. Pr
[Deficit?]
50
Balanced Budget Amendment
• Is it really in our best interest?
• What would happen to the fiscal policy tools of the government if such an amendment were to become reality?
51
Govt. Employees: Are They Feeding at Public Trough?
$40,000/yr. salary + Benefits:
~ 20% Fed. & State income taxes.
Net cost to taxpayer = $32,000/yr. + Benefits
Now, what does that Govt. employee do with that $32,000?
52
Govt. Employees: Are They Feeding at Public Trough?
• Pays property taxes, sales taxes, and excise taxes.
• Buys automobiles.
• Buys home.
• Goes to Food Lion, WalMart, Dry Cleaners, etc.!
Do taxpayers ultimately get their
$32,000 /yr. back?


![Should the European Central Bank and the Federal Reserve ...= ["y + interest payments] + discretionary fiscal policy The nondiscretionary part of fiscal policy is composed of automatic](https://img.pdfslide.us/doc/110x75/5eb53c333d41f5491a4988cd/should-the-european-central-bank-and-the-federal-reserve-y-interest.jpg)