Embed Size (px)
Citation preview
1
Fine-grained LTE Radio Link Estimationfor Mobile Phones
Nicola Bui12, Foivos Michelinakis12, Joerg Widmer11IMDEA Networks Institute, Leganes (Madrid), Spain
2UC3M, Leganes (Madrid), Spain
Abstract—Recently, spectrum optimization solutions requiremobile phones to obtain precise, accurate and fine-grained esti-mates of the radio link data rate. In particular, the effectivenessof anticipatory schemes depends on the granularity of thesemeasurements. In this paper we use a reliable LTE controlchannel sniffer (OWL) to extensively compare mobile phonemeasurements against exact LTE radio link data rates. We alsoprovide a detailed study of latencies measured on mobile phones,the sniffer, and a server to which the phone is connected. Inthis study, we show that mobile phones can accurately (if slightlybiased) estimate the physical radio link data rate. We highlight thedifferences among measurements obtained using different mobilephones, communication technologies and protocols.
I. INTRODUCTION
Can we trust mobile phone data rate measurements? Thisapparently trivial question is key to evaluate the feasibility ofthe anticipatory networking [1] paradigm and the related futurenetwork solutions [2], [3]. For instance, exploiting achievablerate prediction to optimize mobile applications [4]–[6] requiressome information exchange between mobiles and base stationsso that current decisions (e.g. scheduling, admission control)can be made taking into account the future states of the system.However, while prediction errors have been studied [7], [8], thecapability of mobile phones to obtain accurate measurementshas never been investigated in mobile networks.
In addition to that, many recent studies [9]–[13] rely oncrowd-sourced datasets to derive their conclusions withoutquestioning mobile phone measurements accuracy and whetherit is possible to aggregate them. Although reliable mobilephone applications to measure the network bandwidth ex-ist [14]–[16], they focus on end-to-end measurements thatdo not provide the required level of granularity to enableanticipatory optimization. In fact, while end-to-end data rateis ideal to optimize TCP performance, the resource allocationoptimization would rather benefit from the actual radio linkdata rate between eNodeB and user equipment (UE).
In this paper, we study whether mobile phones can ac-curately measure LTE radio link data rate and with whichgranularity (i.e. sampling frequency). To achieve this, wecompare the data rate estimates computed at the physical layerof the radio link through a sniffer, at the mobile phone kernelthrough tcpdump and by a mobile application.
Our study is divided into two measurement campaigns:the first and largest set of experiments consists of bursttransmissions, where a small amount of data is sent back-to-back to collect data rate estimates computed by the differententities (i.e., phone, sniffer and server), while in the second set,
we evaluate latencies between single data packet transmissionsand their corresponding acknowledgements (ACKs). Theselatencies allow us to study the root-causes of differencesamong the behaviors of different phones. In all the tests,we compared three mobile phones by different vendors andequipped with different chipsets, first performing the test fromthe server to the phone and, then, in the opposite direction.
The main findings of our study are the following:1) Mobile phones achieve accurate (> 85%) and precise
(> 82%) data rate measurements with as few as 20KB in the downlink, where accuracy and precision arerelated to how close the measurement are to the snifferground-truth readings.
2) Uplink measurements are less accurate and less precise(65% and 60% respectively in the worst case), becauseLTE uplink scheduling delay causes a higher variabilityin the results.
3) Different chipsets exhibit variable biases and perfor-mance, thus requiring dedicated calibration to optimizeaccuracy.
4) Downlink accuracy and precision are linked to thelatency measured on the phone: chipsets providingshorter and more deterministic latencies obtain betterestimates.
The rest of the paper provides a survey of related work inSection II, specifies the measurement setup and the devicesinvolved in Section III, and discusses the two measurementcampaigns in Section IV and V. Sections VI summarizes themain findings and Section VII concludes the paper.
II. RELATED WORK
A considerable number of recent papers focus on LTEmeasurements and measurement techniques, but, to the best ofour knowledge, none of them rely on accurate LTE schedulinginformation to validate their findings. Among them, Huang etal. [10] studied LTE performance measured from mobile phonedata. In order to obtain a known reference for the results, theauthors performed experiments using controlled traffic patternsto validate their findings.
The fraction of LTE resources used for communication isdetected in [17] by means of power measurements. The goalof the authors is to evaluate the performance of M2M commu-nications using experimental data. Similarly, RMon [18] is asolution to assess which resource blocks are used by comparingthe average power measured over the resource bandwidth withthat of the closest LTE reference signals. RMon achieves goodperformance and robustness, but it can only assess the average
2
fraction of used resources. Hence, it cannot be used to capturethe actual base station data rate.
LTEye [19] was the first attempt to decode the LTE con-trol channel to access scheduling information. However theauthors found in their later work [18] that LTEye could notprovide sufficient reliability and a significant fraction of controlmessages remain undecoded. To overcome this limitation, wedeveloped a reliable LTE control channel sniffer, called OnlineWatcher for LTE (OWL) [20]. In our tests, OWL successfullydecoded 99.85% of LTE the control messages, thus obtaining acomplete log of the eNodeB scheduling. MobileInsight [21] isa mobile phone application capable of accessing LTE controlmessages directly from the radio chipset and could also havebeen as an alternative to OWL.
A few papers [22]–[24] use commercial tools and/or op-erator network information to evaluate LTE performance, buttheir datasets (if released) only provide aggregate metrics thatdo not allow us to achieve the objective of this paper. Thevast majority of papers however, just rely on measurementperformed using mobile phones or replicated in laboratoryexperiments. Phone traces are used in [12] to evaluate networkperformance. The same authors developed a framework [13]to manage mobile phone measurements and a similar projectwas developed in [9]. In [11], LTE performance predictors areevaluated in laboratory setups. In addition, [25] uses TCPdumptraces to perform energy efficiency evaluation of smartphonesand [26] studies LTE shared access in a trial environment.
Finally, although not specifically developed for LTE, the fol-lowing contributions discuss mobile measurements in generalterms. The most popular approach is Ookla’s Speedtest [14],which can provide a very accurate evaluation of the steady-state rate achievable by long-lived TCP connections. However,Speedtest is both data intensive (with fast connections, onetest can consume more than a few tens of megabytes) andcannot provide estimates at the granularity required in thisstudy. A few recent papers [15], [16] studied end-to-endachievable throughput, also accounting for inter-arrival timesand passive monitoring techniques, but without comparingtheir findings with ground-truth readings. The accuracy ofWiFi measurements performed by mobile phone is studiedin [27] based on a timing analysis. However, their resultscannot be applied to our scenario for two reasons: WiFi andLTE differs significantly in terms of scheduling and MACprotocols, and tcpdump traces do not provide a reliable groundtruth for the physical radio link.
This study improves over the current state of the art by, first,evaluating data rate estimates on the radio link, instead of end-to-end throughput and, second, by relying on an accurate LTEsniffer to obtain a ground truth of the measurements.
III. SETUP AND DEFINITIONS
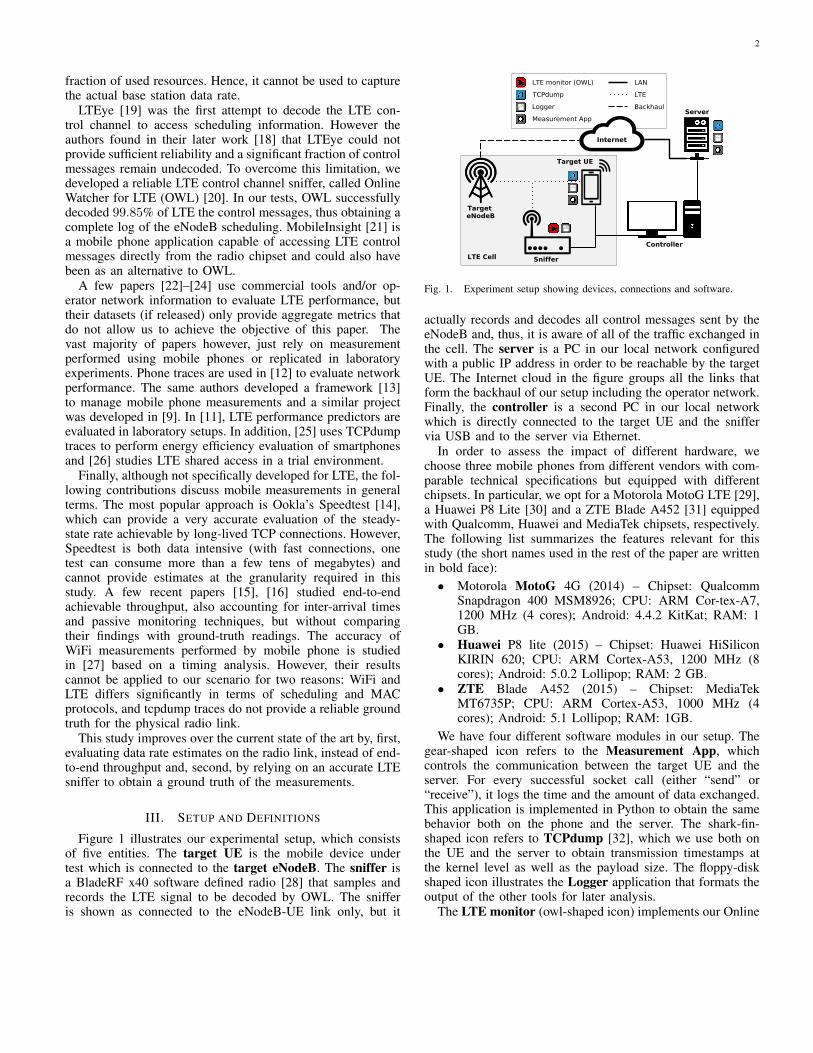
Figure 1 illustrates our experimental setup, which consistsof five entities. The target UE is the mobile device undertest which is connected to the target eNodeB. The sniffer isa BladeRF x40 software defined radio [28] that samples andrecords the LTE signal to be decoded by OWL. The snifferis shown as connected to the eNodeB-UE link only, but it
Fig. 1. Experiment setup showing devices, connections and software.
actually records and decodes all control messages sent by theeNodeB and, thus, it is aware of all of the traffic exchanged inthe cell. The server is a PC in our local network configuredwith a public IP address in order to be reachable by the targetUE. The Internet cloud in the figure groups all the links thatform the backhaul of our setup including the operator network.Finally, the controller is a second PC in our local networkwhich is directly connected to the target UE and the sniffervia USB and to the server via Ethernet.
In order to assess the impact of different hardware, wechoose three mobile phones from different vendors with com-parable technical specifications but equipped with differentchipsets. In particular, we opt for a Motorola MotoG LTE [29],a Huawei P8 Lite [30] and a ZTE Blade A452 [31] equippedwith Qualcomm, Huawei and MediaTek chipsets, respectively.The following list summarizes the features relevant for thisstudy (the short names used in the rest of the paper are writtenin bold face):• Motorola MotoG 4G (2014) – Chipset: Qualcomm
Snapdragon 400 MSM8926; CPU: ARM Cor-tex-A7,1200 MHz (4 cores); Android: 4.4.2 KitKat; RAM: 1GB.
• Huawei P8 lite (2015) – Chipset: Huawei HiSiliconKIRIN 620; CPU: ARM Cortex-A53, 1200 MHz (8cores); Android: 5.0.2 Lollipop; RAM: 2 GB.
• ZTE Blade A452 (2015) – Chipset: MediaTekMT6735P; CPU: ARM Cortex-A53, 1000 MHz (4cores); Android: 5.1 Lollipop; RAM: 1GB.
We have four different software modules in our setup. Thegear-shaped icon refers to the Measurement App, whichcontrols the communication between the target UE and theserver. For every successful socket call (either “send” or“receive”), it logs the time and the amount of data exchanged.This application is implemented in Python to obtain the samebehavior both on the phone and the server. The shark-fin-shaped icon refers to TCPdump [32], which we use both onthe UE and the server to obtain transmission timestamps atthe kernel level as well as the payload size. The floppy-diskshaped icon illustrates the Logger application that formats theoutput of the other tools for later analysis.
The LTE monitor (owl-shaped icon) implements our Online
3
tItG
tB
Fig. 2. Communication diagram for downlink burst transmissions.
Watcher for LTE (OWL [20]) control channel measurements.OWL is built starting from srs-LTE [33], an open-source im-plementation of LTE, and extends its functionalities to providea reliable decoder of the physical control channel. From LTEcontrol messages, OWL computes the transport block sizeassigned to each downlink and uplink communication. In thisway, we can measure the actual LTE radio link data rate inevery transmission time interval (TTI), i.e. 1 ms. This data ratediffers from the usual notion of end-to-end throughput and itis the main metric needed for anticipatory networking.
The LTE cell used during the tests belongs to Yoigo, aSpanish mobile network operator, and operates in LTE band 3(1800 MHz) using a bandwidth of 10 MHz. The cell is chosendue of the relatively low load and the very good signal qualityfrom the test location.
Our setup is characterized by three physical and five logicalmeasurement points: we monitor the communications at thetarget UE, at the sniffer and at the server. Both the UE andthe server collect information by means of TCPdump and atthe application to capture the difference between applicationand kernel measurements by means of a data rate estimationtechnique using packet train dispersion [34].
As introduced above, we perform two measurement cam-paigns, the first dealing with burst transmission (see Sec-tion IV-A and IV-B for the test description and the resultsrespectively) and the second with periodic isolated transmis-sions (Section V-A and V-B). In the first campaign our goalis to evaluate the accuracy and the precision of fine-grainedmeasurements, while in the second we study latencies in thedifferent devices. Both campaigns consider both downlink(from the server to the UE) and uplink communication.
IV. BURST TRANSMISSIONS
The first measurement campaign has the main objectives ofevaluating the accuracy and the precision of data rate estimatesobtained by mobile applications, and to analyze the differencesin performance obtained by the three phones.
We use the following symbols: t, s, n and r denote durations,transmission sizes, number of packets, and the data rates. Allthese quantities are easy to compute from the informationavailable in our tests and they do not require complex filtering.In fact, we just evaluate the data rate r = s/t as the ratiobetween the amount of data s transmitted in a given time andthe time t itself.
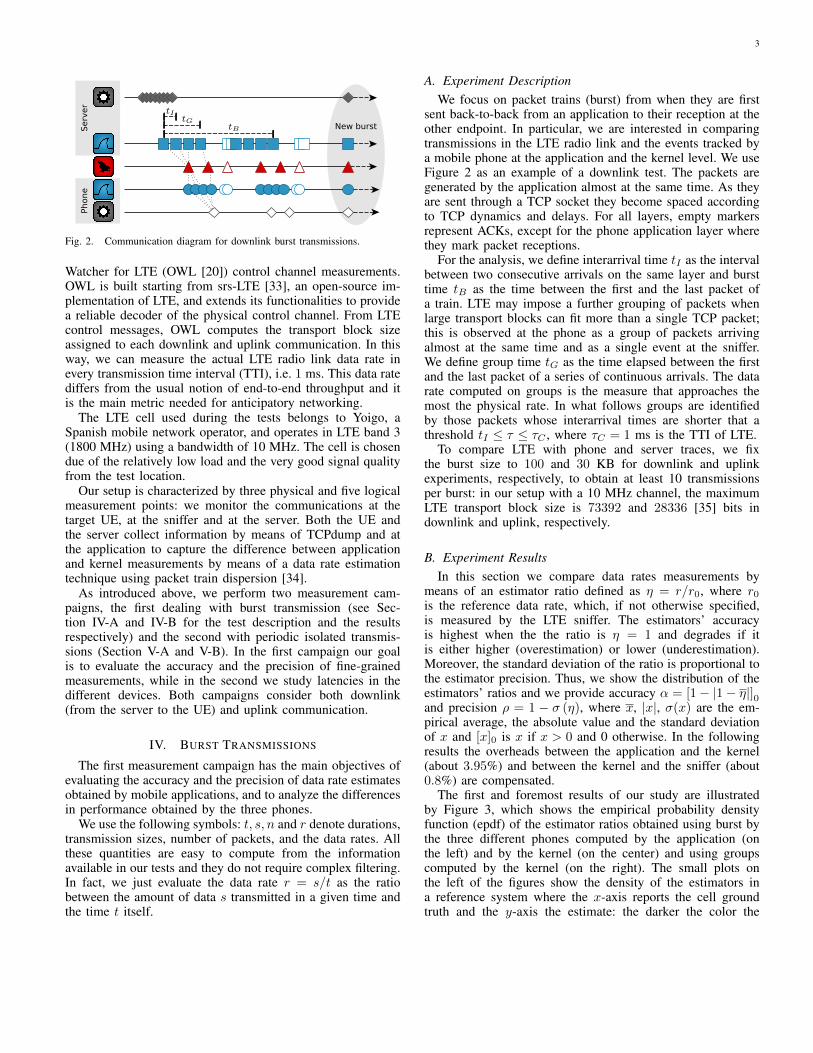
A. Experiment DescriptionWe focus on packet trains (burst) from when they are first
sent back-to-back from an application to their reception at theother endpoint. In particular, we are interested in comparingtransmissions in the LTE radio link and the events tracked bya mobile phone at the application and the kernel level. We useFigure 2 as an example of a downlink test. The packets aregenerated by the application almost at the same time. As theyare sent through a TCP socket they become spaced accordingto TCP dynamics and delays. For all layers, empty markersrepresent ACKs, except for the phone application layer wherethey mark packet receptions.
For the analysis, we define interarrival time tI as the intervalbetween two consecutive arrivals on the same layer and bursttime tB as the time between the first and the last packet ofa train. LTE may impose a further grouping of packets whenlarge transport blocks can fit more than a single TCP packet;this is observed at the phone as a group of packets arrivingalmost at the same time and as a single event at the sniffer.We define group time tG as the time elapsed between the firstand the last packet of a series of continuous arrivals. The datarate computed on groups is the measure that approaches themost the physical rate. In what follows groups are identifiedby those packets whose interarrival times are shorter that athreshold tI ≤ τ ≤ τC , where τC = 1 ms is the TTI of LTE.
To compare LTE with phone and server traces, we fixthe burst size to 100 and 30 KB for downlink and uplinkexperiments, respectively, to obtain at least 10 transmissionsper burst: in our setup with a 10 MHz channel, the maximumLTE transport block size is 73392 and 28336 [35] bits indownlink and uplink, respectively.
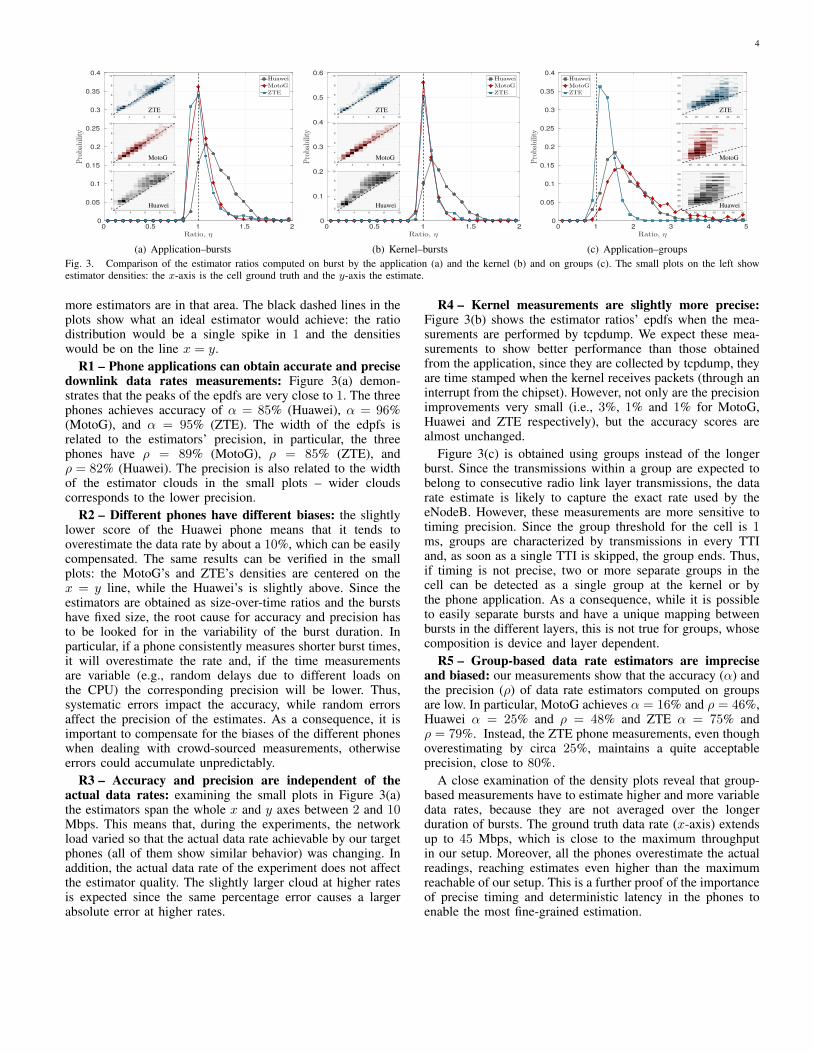
B. Experiment ResultsIn this section we compare data rates measurements by
means of an estimator ratio defined as η = r/r0, where r0is the reference data rate, which, if not otherwise specified,is measured by the LTE sniffer. The estimators’ accuracyis highest when the the ratio is η = 1 and degrades if itis either higher (overestimation) or lower (underestimation).Moreover, the standard deviation of the ratio is proportional tothe estimator precision. Thus, we show the distribution of theestimators’ ratios and we provide accuracy α = [1− |1− η|]0and precision ρ = 1 − σ (η), where x, |x|, σ(x) are the em-pirical average, the absolute value and the standard deviationof x and [x]0 is x if x > 0 and 0 otherwise. In the followingresults the overheads between the application and the kernel(about 3.95%) and between the kernel and the sniffer (about0.8%) are compensated.
The first and foremost results of our study are illustratedby Figure 3, which shows the empirical probability densityfunction (epdf) of the estimator ratios obtained using burst bythe three different phones computed by the application (onthe left) and by the kernel (on the center) and using groupscomputed by the kernel (on the right). The small plots onthe left of the figures show the density of the estimators ina reference system where the x-axis reports the cell groundtruth and the y-axis the estimate: the darker the color the
4
0 0.5 1 1.5 2
Ratio, η
0
0.05
0.1
0.15
0.2
0.25
0.3
0.35
0.4
Probab
ility
Huawei
MotoG
ZTE
2 4 6 8 10
2
4
6
8
10
2 4 6 8 10
2
4
6
8
10
2 4 6 8 10
2
4
6
8
10
ZTE
MotoG
Huawei
(a) Application–bursts
0 0.5 1 1.5 2
Ratio, η
0
0.1
0.2
0.3
0.4
0.5
0.6
Probab
ility
Huawei
MotoG
ZTE
2 4 6 8 10
2
4
6
8
10
2 4 6 8 10
2
4
6
8
10
2 4 6 8 10
2
4
6
8
10
ZTE
MotoG
Huawei
(b) Kernel–bursts
0 1 2 3 4 5
Ratio, η
0
0.05
0.1
0.15
0.2
0.25
0.3
0.35
0.4
Probab
ility
Huawei
MotoG
ZTE
15 20 25 30 35 40 45
20
30
40
50
60
70
80
20 25 30 35 40 45 50
20
40
60
80
100
15 20 25 30 35 40
20
30
40
50
60
ZTE
MotoG
Huawei
(c) Application–groupsFig. 3. Comparison of the estimator ratios computed on burst by the application (a) and the kernel (b) and on groups (c). The small plots on the left showestimator densities: the x-axis is the cell ground truth and the y-axis the estimate.
more estimators are in that area. The black dashed lines in theplots show what an ideal estimator would achieve: the ratiodistribution would be a single spike in 1 and the densitieswould be on the line x = y.
R1 – Phone applications can obtain accurate and precisedownlink data rates measurements: Figure 3(a) demon-strates that the peaks of the epdfs are very close to 1. The threephones achieves accuracy of α = 85% (Huawei), α = 96%(MotoG), and α = 95% (ZTE). The width of the edpfs isrelated to the estimators’ precision, in particular, the threephones have ρ = 89% (MotoG), ρ = 85% (ZTE), andρ = 82% (Huawei). The precision is also related to the widthof the estimator clouds in the small plots – wider cloudscorresponds to the lower precision.
R2 – Different phones have different biases: the slightlylower score of the Huawei phone means that it tends tooverestimate the data rate by about a 10%, which can be easilycompensated. The same results can be verified in the smallplots: the MotoG’s and ZTE’s densities are centered on thex = y line, while the Huawei’s is slightly above. Since theestimators are obtained as size-over-time ratios and the burstshave fixed size, the root cause for accuracy and precision hasto be looked for in the variability of the burst duration. Inparticular, if a phone consistently measures shorter burst times,it will overestimate the rate and, if the time measurementsare variable (e.g., random delays due to different loads onthe CPU) the corresponding precision will be lower. Thus,systematic errors impact the accuracy, while random errorsaffect the precision of the estimates. As a consequence, it isimportant to compensate for the biases of the different phoneswhen dealing with crowd-sourced measurements, otherwiseerrors could accumulate unpredictably.
R3 – Accuracy and precision are independent of theactual data rates: examining the small plots in Figure 3(a)the estimators span the whole x and y axes between 2 and 10Mbps. This means that, during the experiments, the networkload varied so that the actual data rate achievable by our targetphones (all of them show similar behavior) was changing. Inaddition, the actual data rate of the experiment does not affectthe estimator quality. The slightly larger cloud at higher ratesis expected since the same percentage error causes a largerabsolute error at higher rates.
R4 – Kernel measurements are slightly more precise:Figure 3(b) shows the estimator ratios’ epdfs when the mea-surements are performed by tcpdump. We expect these mea-surements to show better performance than those obtainedfrom the application, since they are collected by tcpdump, theyare time stamped when the kernel receives packets (through aninterrupt from the chipset). However, not only are the precisionimprovements very small (i.e., 3%, 1% and 1% for MotoG,Huawei and ZTE respectively), but the accuracy scores arealmost unchanged.
Figure 3(c) is obtained using groups instead of the longerburst. Since the transmissions within a group are expected tobelong to consecutive radio link layer transmissions, the datarate estimate is likely to capture the exact rate used by theeNodeB. However, these measurements are more sensitive totiming precision. Since the group threshold for the cell is 1ms, groups are characterized by transmissions in every TTIand, as soon as a single TTI is skipped, the group ends. Thus,if timing is not precise, two or more separate groups in thecell can be detected as a single group at the kernel or bythe phone application. As a consequence, while it is possibleto easily separate bursts and have a unique mapping betweenbursts in the different layers, this is not true for groups, whosecomposition is device and layer dependent.
R5 – Group-based data rate estimators are impreciseand biased: our measurements show that the accuracy (α) andthe precision (ρ) of data rate estimators computed on groupsare low. In particular, MotoG achieves α = 16% and ρ = 46%,Huawei α = 25% and ρ = 48% and ZTE α = 75% andρ = 79%. Instead, the ZTE phone measurements, even thoughoverestimating by circa 25%, maintains a quite acceptableprecision, close to 80%.
A close examination of the density plots reveal that group-based measurements have to estimate higher and more variabledata rates, because they are not averaged over the longerduration of bursts. The ground truth data rate (x-axis) extendsup to 45 Mbps, which is close to the maximum throughputin our setup. Moreover, all the phones overestimate the actualreadings, reaching estimates even higher than the maximumreachable of our setup. This is a further proof of the importanceof precise timing and deterministic latency in the phones toenable the most fine-grained estimation.
5
0 0.5 1 1.5 2
Time, tI [ms]
0
0.1
0.2
0.3
0.4
0.5
0.6
0.7
0.8
0.9
1
ApplicationKernel
Mot
oGShort interval, < 2 ms
0 10 20 30 40 50
Time, tI [ms]
0
0.1
0.2
0.3
0.4
0.5
0.6
0.7
0.8
0.9
1
ApplicationKernelCell
Long interval, ≥ 2 ms
0 0.5 1 1.5 2
Time, tI [ms]
0
0.1
0.2
0.3
0.4
0.5
0.6
0.7
0.8
0.9
1
ApplicationKernel
Hua
wei
0 10 20 30 40 50
Time, tI [ms]
0
0.1
0.2
0.3
0.4
0.5
0.6
0.7
0.8
0.9
1
ApplicationKernelCell
0 0.5 1 1.5 2
Time, tI [ms]
0
0.1
0.2
0.3
0.4
0.5
0.6
0.7
0.8
0.9
1
ApplicationKernel
ZT
E
0 10 20 30 40 50
Time, tI [ms]
0
0.1
0.2
0.3
0.4
0.5
0.6
0.7
0.8
0.9
1
ApplicationKernelCell
Fig. 4. Interarrival time CDFs for short (left) and long (right) intervals andthe three phones.
Before moving to uplink results, a few considerations onthe packet interarrival times are in order. Figure 4 provides aset of graphs showing the Cumulative Distribution Function(CDF) of the interarrival times. To emphasizes the differencebetween the interarrival times of packets related to the sameLTE transmission from those related to intervals separatingcontinuous arrivals, we plot on the left column the CDFs forthe interarrival times shorter than 2 ms (2 TTIs) and, thoselonger or equal to 2 ms and shorter than 50 ms on the rightcolumn. We don’t show interarrival times longer than 50 ms,since those are almost always related to inter-burst rather thanintra-burst arrivals. The matrix rows show from the top to thebottom, results for MotoG, Huawei and ZTE. We omitted thecell CDFs in the plots on the left, since it would have been asingle spike at 1 ms.
Focusing on the left column, we can see that the CDFs ofdifferent phones and those obtained at the kernel and at theapplication are very different. For instance, the MotoG plotshows that the majority (90%) of interarrival times measuredat the kernel are shorter than 0.3 ms, but only 30% of thosemeasured by the application are shorter than 0.3 ms. Thismeans that multiple packets that are distinguishable at the
0 0.5 1 1.5 2 2.5 3
Ratio, η
0
0.05
0.1
0.15
0.2
0.25
0.3
0.35
0.4
0.45
0.5
Probab
ility
Huawei
MotoG
ZTE
2 4 6 8
2
4
6
8
2 4 6 8
2
3
4
5
6
7
8
9
1 2 3 4 5 6 7
1
2
3
4
5
6
7
ZTE
MotoG
Huawei
20 50 100 2000
0.5
1
1.5
2
Dow
nlinkratio,
η
20 50 100 200
Burst size, s [KB]
0
0.5
1
1.5
2
Uplinkratio,
η
Fig. 5. Estimator ratios computed on burst in the uplink (left). Estimatorratios against different burst size.
kernel are received by the application as a single stream, thus,fixing the threshold τ = 0.3 ms identify packets belonging tothe same LTE transmission from those belonging to either theprevious or the next.
Instead, the CDF of ZTE interarrival times at the kernelshows two flat regions, one before 0.15 ms and the secondafter 1 ms: this is caused by intra-transmission arrivals (theformer) and inter-transmissions arrivals (the latter). Conversely,this noticeable distinction is not found in the application trace.Accordingly, we fix the grouping thresholds to different values:τ = 0.2 ms for the kernel and τ = 1 ms for the application.
Finally, the Huawei CDFs only show slight inflections at0.4 ms (kernel) and 0.7 ms (application), but both are lessmarked than those of the other phones. We set the two thresh-olds accordingly. As will be more evident hereafter, a moreskewed CDF with distinguishable intra- and inter-transmissionthresholds corresponds to more deterministic latencies in thephone and, in turn, to better group data rate estimates.
Analyzing the plots on the right, we can compare theinterarrival time CDFs measured by the application, the kerneland the sniffer. Here we observe that the Huawei phone thathas a slightly lower accuracy in terms of data rate estimation,and also shows a larger gap between the cell CDF and theother two, in particular between 10 and 30 ms. This confirmsthat data rate measurements are influenced by timing precision.
One final observation related to the ZTE phone is that boththe application and the kernel CDFs show the same stair-shaped trend as in the cell CDF. Again, this is due to a lowervariability of the ZTE latency, which will become more evidentin the following second set of experiments.
Figure 5 (left) shows the uplink data rate estimator ratiosof the three phones. Again, we compare kernel measurementson the phone against the sniffer’s ground truth for the cell.Note that uplink application measurements would require adedicated application that could intercept ACKs or especiallydesigned to monitor the sending socket. The normal socketbehavior is to accept send requests from the application untilthe transmission buffer is full and, since this buffer is usuallylarger than our data burst, the application can send to the socketa whole burst at once making it impossible to measure the datarate at the phone application.
R6 – Mobile phones can obtain accurate and preciseuplink data rates measurements: although the MotoG un-derestimates the rate by about 30%, the other two phoneshave the peaks of their epdfs very close to 1. In particular,
6
they achieve an accuracy α of 93% (Huawei) and 97% (ZTE),while MotoG stops at 65%. The edpfs are also wider thanthose related to the downlink. This is even more evident fromthe density plots on the right of the figure, which highlightthat the precision of uplink measurements is lower than thatobtained in the downlink: 73% for the Huawei and 74% forthe ZTE. Not only does the MotoG have only 60% precision,but also its density plot shows two regions where the densitiesaccumulate. This exhibits a binary behavior of the device thatwill become more evident in the next section where we analyzethe phone latencies.
In addition, we compare the phone kernel to the serverdata rate measurements. Since the results obtained are verysimilar to those shown in Figure 5 (left) we omit the graphics.However, it is interesting that in our experiments, uplink burstcan be measured both on the phone and the server achievingsimilar results. Since phone to cell measurements are takenbefore traversing the backhaul while phone to server resultsinclude it, we can conclude that the backhaul plays a minorrole in our setup, because of the favorable location of themeasurement server.
Figure 5 (right) reports the results obtained by varying theburst size from 10 KB to 1 MB for the downlink, and from6 to 300 KB for the uplink. All the figures plot the averageestimator ratio in the center of a shaded area that extends onestandard deviation on each side. The figures are obtained bymixing together the results for all the phones.
R7 – Bursts of 20 KB provide high accuracy and highprecision: the figures show that the estimator accuracy isindependent of the burst size and the precision slowly improveswith increasing size. Uplink proves to be more sensitive to verysmall burst (i.e., the shaded area is larger in the uplink plotsfor small bursts) as it is subject to more network randomnessand it requires slightly longer transmissions. In contrast, in thedownlink communication as few as two LTE transmissions aresufficient to obtain an accurate estimate. In our test we choosethe minimum burst size to cause at least two transmissionsat the maximum reachable data rate. In a larger bandwidthsetup and when the next LTE releases will be deployed, theminimum burst size to achieve this results has to be increasedproportionally to the maximum data rate.
R8 – UDP tests obtain the same results: the networkprovider used in our campaigns does not allow us to makereliable UDP tests, because of firewall and traffic shapingpolicies. To overcome this limitation, we repeated all the testsby emulating UDP by sending its packets with a TCP headerthrough a raw socket. All the repetitions result in performancealmost identical to that obtained by their TCP counterparts.The reason is that the measurement characteristics are dictatedby the intra-burst timing, which, in turn, depend on the radiolink technology, and not by the inter-burst timing, which, in-stead, depends on the protocol. Thus, radio link measurementsonly need for clearly separated burst in order for mobile phonesto precisely estimate the data rate.
R9 – WiFi measurements are consistent, but different:we repeated the main tests on WiFi (IEEE 802.11g) byreplacing OWL with a Warp Software Defined Radio [36]using the 802.11 reference design. We consistently observe
tA
tS
tC
tP
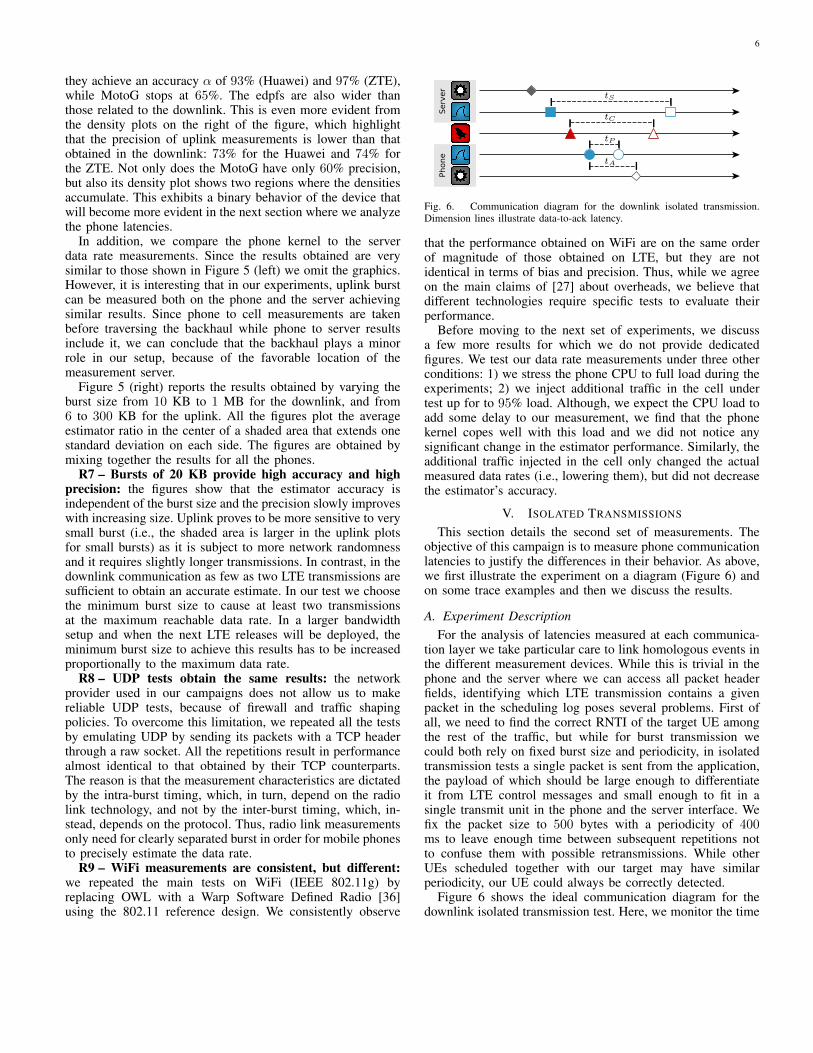
Fig. 6. Communication diagram for the downlink isolated transmission.Dimension lines illustrate data-to-ack latency.
that the performance obtained on WiFi are on the same orderof magnitude of those obtained on LTE, but they are notidentical in terms of bias and precision. Thus, while we agreeon the main claims of [27] about overheads, we believe thatdifferent technologies require specific tests to evaluate theirperformance.
Before moving to the next set of experiments, we discussa few more results for which we do not provide dedicatedfigures. We test our data rate measurements under three otherconditions: 1) we stress the phone CPU to full load during theexperiments; 2) we inject additional traffic in the cell undertest up for to 95% load. Although, we expect the CPU load toadd some delay to our measurement, we find that the phonekernel copes well with this load and we did not notice anysignificant change in the estimator performance. Similarly, theadditional traffic injected in the cell only changed the actualmeasured data rates (i.e., lowering them), but did not decreasethe estimator’s accuracy.
V. ISOLATED TRANSMISSIONS
This section details the second set of measurements. Theobjective of this campaign is to measure phone communicationlatencies to justify the differences in their behavior. As above,we first illustrate the experiment on a diagram (Figure 6) andon some trace examples and then we discuss the results.
A. Experiment DescriptionFor the analysis of latencies measured at each communica-
tion layer we take particular care to link homologous events inthe different measurement devices. While this is trivial in thephone and the server where we can access all packet headerfields, identifying which LTE transmission contains a givenpacket in the scheduling log poses several problems. First ofall, we need to find the correct RNTI of the target UE amongthe rest of the traffic, but while for burst transmission wecould both rely on fixed burst size and periodicity, in isolatedtransmission tests a single packet is sent from the application,the payload of which should be large enough to differentiateit from LTE control messages and small enough to fit in asingle transmit unit in the phone and the server interface. Wefix the packet size to 500 bytes with a periodicity of 400ms to leave enough time between subsequent repetitions notto confuse them with possible retransmissions. While otherUEs scheduled together with our target may have similarperiodicity, our UE could always be correctly detected.
Figure 6 shows the ideal communication diagram for thedownlink isolated transmission test. Here, we monitor the time
7
0 50 100 150
Latency, t [ms]
0
0.05
0.1
0.15
0.2HuaweiMotoGZTE
Serv
erDownlink
0.01 0.02 0.03 0.04 0.05 0.06 0.07 0.08
Latency, t [ms]
0
0.05
0.1
0.15
0.2HuaweiMotoGZTE
Uplink
0 5 10 15 20 25 30
Latency, t [ms]
0
0.05
0.1
0.15
0.2HuaweiMotoGZTE
Cel
l
0 10 20 30 40 50
Latency, t [ms]
0
0.05
0.1
0.15
0.2HuaweiMotoGZTE
0 0.5 1 1.5 2 2.5 3
Latency, t [ms]
0
0.05
0.1
0.15
0.2HuaweiMotoGZTE
Phon
e
0 50 100 150
Latency, t [ms]
0
0.05
0.1
0.15
0.2HuaweiMotoGZTE
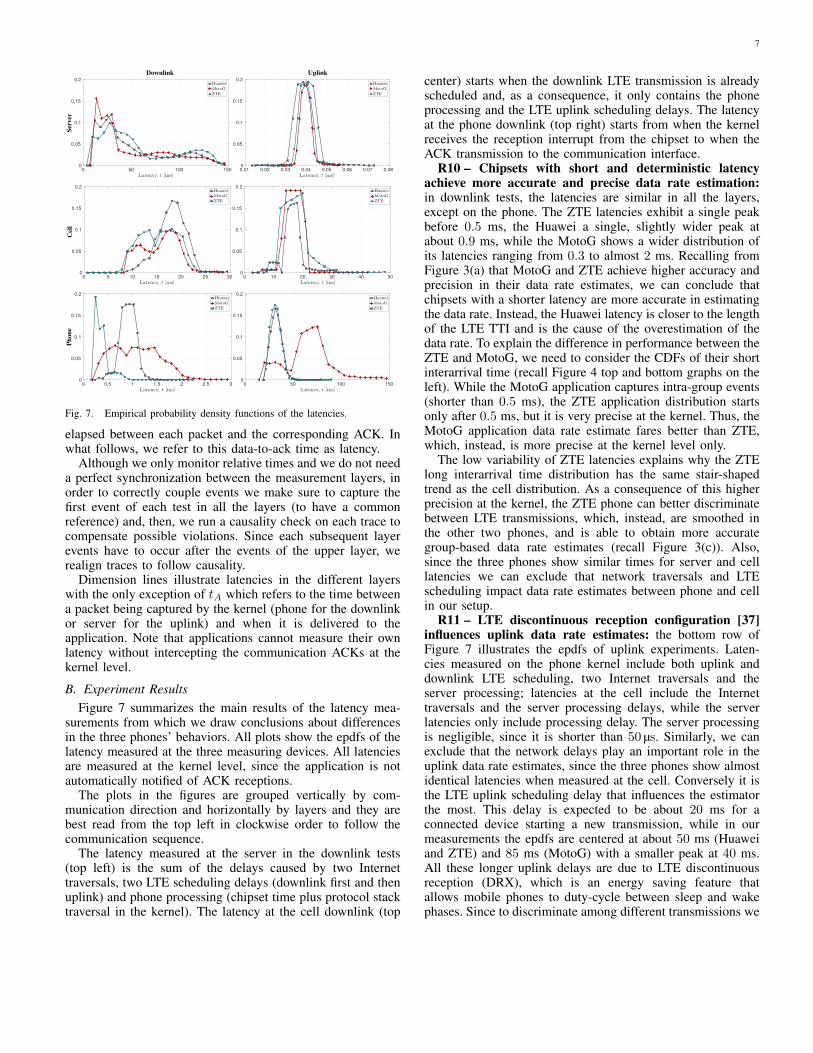
Fig. 7. Empirical probability density functions of the latencies.
elapsed between each packet and the corresponding ACK. Inwhat follows, we refer to this data-to-ack time as latency.
Although we only monitor relative times and we do not needa perfect synchronization between the measurement layers, inorder to correctly couple events we make sure to capture thefirst event of each test in all the layers (to have a commonreference) and, then, we run a causality check on each trace tocompensate possible violations. Since each subsequent layerevents have to occur after the events of the upper layer, werealign traces to follow causality.
Dimension lines illustrate latencies in the different layerswith the only exception of tA which refers to the time betweena packet being captured by the kernel (phone for the downlinkor server for the uplink) and when it is delivered to theapplication. Note that applications cannot measure their ownlatency without intercepting the communication ACKs at thekernel level.
B. Experiment ResultsFigure 7 summarizes the main results of the latency mea-
surements from which we draw conclusions about differencesin the three phones’ behaviors. All plots show the epdfs of thelatency measured at the three measuring devices. All latenciesare measured at the kernel level, since the application is notautomatically notified of ACK receptions.
The plots in the figures are grouped vertically by com-munication direction and horizontally by layers and they arebest read from the top left in clockwise order to follow thecommunication sequence.
The latency measured at the server in the downlink tests(top left) is the sum of the delays caused by two Internettraversals, two LTE scheduling delays (downlink first and thenuplink) and phone processing (chipset time plus protocol stacktraversal in the kernel). The latency at the cell downlink (top
center) starts when the downlink LTE transmission is alreadyscheduled and, as a consequence, it only contains the phoneprocessing and the LTE uplink scheduling delays. The latencyat the phone downlink (top right) starts from when the kernelreceives the reception interrupt from the chipset to when theACK transmission to the communication interface.
R10 – Chipsets with short and deterministic latencyachieve more accurate and precise data rate estimation:in downlink tests, the latencies are similar in all the layers,except on the phone. The ZTE latencies exhibit a single peakbefore 0.5 ms, the Huawei a single, slightly wider peak atabout 0.9 ms, while the MotoG shows a wider distribution ofits latencies ranging from 0.3 to almost 2 ms. Recalling fromFigure 3(a) that MotoG and ZTE achieve higher accuracy andprecision in their data rate estimates, we can conclude thatchipsets with a shorter latency are more accurate in estimatingthe data rate. Instead, the Huawei latency is closer to the lengthof the LTE TTI and is the cause of the overestimation of thedata rate. To explain the difference in performance between theZTE and MotoG, we need to consider the CDFs of their shortinterarrival time (recall Figure 4 top and bottom graphs on theleft). While the MotoG application captures intra-group events(shorter than 0.5 ms), the ZTE application distribution startsonly after 0.5 ms, but it is very precise at the kernel. Thus, theMotoG application data rate estimate fares better than ZTE,which, instead, is more precise at the kernel level only.
The low variability of ZTE latencies explains why the ZTElong interarrival time distribution has the same stair-shapedtrend as the cell distribution. As a consequence of this higherprecision at the kernel, the ZTE phone can better discriminatebetween LTE transmissions, which, instead, are smoothed inthe other two phones, and is able to obtain more accurategroup-based data rate estimates (recall Figure 3(c)). Also,since the three phones show similar times for server and celllatencies we can exclude that network traversals and LTEscheduling impact data rate estimates between phone and cellin our setup.
R11 – LTE discontinuous reception configuration [37]influences uplink data rate estimates: the bottom row ofFigure 7 illustrates the epdfs of uplink experiments. Laten-cies measured on the phone kernel include both uplink anddownlink LTE scheduling, two Internet traversals and theserver processing; latencies at the cell include the Internettraversals and the server processing delays, while the serverlatencies only include processing delay. The server processingis negligible, since it is shorter than 50 µs. Similarly, we canexclude that the network delays play an important role in theuplink data rate estimates, since the three phones show almostidentical latencies when measured at the cell. Conversely it isthe LTE uplink scheduling delay that influences the estimatorthe most. This delay is expected to be about 20 ms for aconnected device starting a new transmission, while in ourmeasurements the epdfs are centered at about 50 ms (Huaweiand ZTE) and 85 ms (MotoG) with a smaller peak at 40 ms.All these longer uplink delays are due to LTE discontinuousreception (DRX), which is an energy saving feature thatallows mobile phones to duty-cycle between sleep and wakephases. Since to discriminate among different transmissions we
8
0
0.5
0.75
1
1.25
1.5
2
3
Ratio,η
UplinkDownlinkHuaweiMotoG ZTEHuaweiMotoG ZTE
BA BP
GA
BA BP
GA
BA BP
GA PC PS PC PS PC PS
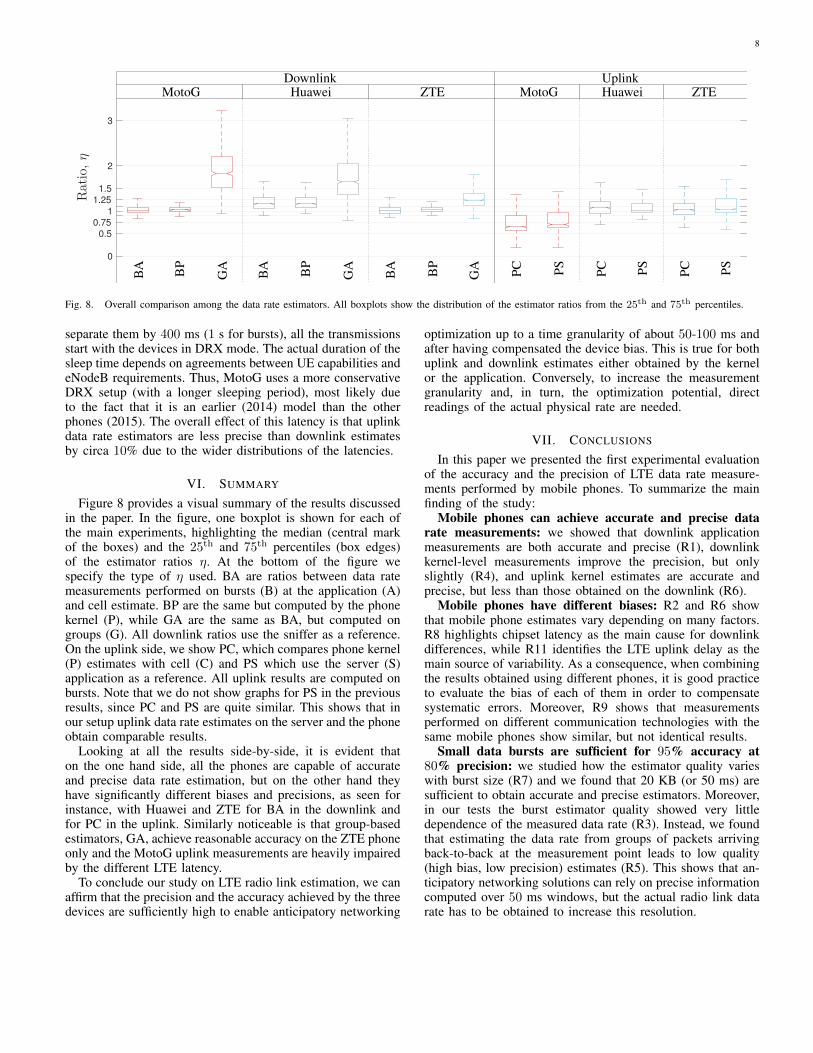
Fig. 8. Overall comparison among the data rate estimators. All boxplots show the distribution of the estimator ratios from the 25th and 75th percentiles.
separate them by 400 ms (1 s for bursts), all the transmissionsstart with the devices in DRX mode. The actual duration of thesleep time depends on agreements between UE capabilities andeNodeB requirements. Thus, MotoG uses a more conservativeDRX setup (with a longer sleeping period), most likely dueto the fact that it is an earlier (2014) model than the otherphones (2015). The overall effect of this latency is that uplinkdata rate estimators are less precise than downlink estimatesby circa 10% due to the wider distributions of the latencies.
VI. SUMMARY
Figure 8 provides a visual summary of the results discussedin the paper. In the figure, one boxplot is shown for each ofthe main experiments, highlighting the median (central markof the boxes) and the 25th and 75th percentiles (box edges)of the estimator ratios η. At the bottom of the figure wespecify the type of η used. BA are ratios between data ratemeasurements performed on bursts (B) at the application (A)and cell estimate. BP are the same but computed by the phonekernel (P), while GA are the same as BA, but computed ongroups (G). All downlink ratios use the sniffer as a reference.On the uplink side, we show PC, which compares phone kernel(P) estimates with cell (C) and PS which use the server (S)application as a reference. All uplink results are computed onbursts. Note that we do not show graphs for PS in the previousresults, since PC and PS are quite similar. This shows that inour setup uplink data rate estimates on the server and the phoneobtain comparable results.
Looking at all the results side-by-side, it is evident thaton the one hand side, all the phones are capable of accurateand precise data rate estimation, but on the other hand theyhave significantly different biases and precisions, as seen forinstance, with Huawei and ZTE for BA in the downlink andfor PC in the uplink. Similarly noticeable is that group-basedestimators, GA, achieve reasonable accuracy on the ZTE phoneonly and the MotoG uplink measurements are heavily impairedby the different LTE latency.
To conclude our study on LTE radio link estimation, we canaffirm that the precision and the accuracy achieved by the threedevices are sufficiently high to enable anticipatory networking
optimization up to a time granularity of about 50-100 ms andafter having compensated the device bias. This is true for bothuplink and downlink estimates either obtained by the kernelor the application. Conversely, to increase the measurementgranularity and, in turn, the optimization potential, directreadings of the actual physical rate are needed.
VII. CONCLUSIONS
In this paper we presented the first experimental evaluationof the accuracy and the precision of LTE data rate measure-ments performed by mobile phones. To summarize the mainfinding of the study:
Mobile phones can achieve accurate and precise datarate measurements: we showed that downlink applicationmeasurements are both accurate and precise (R1), downlinkkernel-level measurements improve the precision, but onlyslightly (R4), and uplink kernel estimates are accurate andprecise, but less than those obtained on the downlink (R6).
Mobile phones have different biases: R2 and R6 showthat mobile phone estimates vary depending on many factors.R8 highlights chipset latency as the main cause for downlinkdifferences, while R11 identifies the LTE uplink delay as themain source of variability. As a consequence, when combiningthe results obtained using different phones, it is good practiceto evaluate the bias of each of them in order to compensatesystematic errors. Moreover, R9 shows that measurementsperformed on different communication technologies with thesame mobile phones show similar, but not identical results.
Small data bursts are sufficient for 95% accuracy at80% precision: we studied how the estimator quality varieswith burst size (R7) and we found that 20 KB (or 50 ms) aresufficient to obtain accurate and precise estimators. Moreover,in our tests the burst estimator quality showed very littledependence of the measured data rate (R3). Instead, we foundthat estimating the data rate from groups of packets arrivingback-to-back at the measurement point leads to low quality(high bias, low precision) estimates (R5). This shows that an-ticipatory networking solutions can rely on precise informationcomputed over 50 ms windows, but the actual radio link datarate has to be obtained to increase this resolution.
9
Burst measurements are protocol independent: by com-paring TCP and UDP tests, R8 shows that precision andaccuracy depend on the capability of detecting burst precisely.
Finally, we believe that this study offered a new perspectiveabout crowd-sourced measurement campaigns and that willhelp improving the reliability of future campaigns.
ACKNOWLEDGMENTS
This work has been supported by the European UnionH2020-ICT grant 644399 (MONROE), by the Madrid RegionalGovernment through the TIGRE5-CM program (S2013/ICE-2919), the Ramon y Cajal grant from the Spanish Ministryof Economy and Competitiveness RYC-2012-10788 and grantTEC2014-55713-R.
REFERENCES
[1] N. Bui, M. Cesana, A. Hosseini, Q. Liao, I. Malanchini, and J. Widmer,“A survey of anticipatory mobile networking: Context-based classifica-tion, prediction methodologies, and optimization techniques,” Submittedto IEEE Communications Surveys and Tutorials, 2016.
[2] NGMN. Next Generation Mobile Networks. [Online].Available: {http://www.ngmn.de/publications/all-downloads/article/ngmn-5g-white-paper.html}
[3] G. P. Fettweis, “The tactile internet: applications and challenges,”Vehicular Technology Magazine, IEEE, vol. 9, no. 1, pp. 64–70, 2014.
[4] N. Bui, I. Malanchini, and J. Widmer, “Anticipatory admission controland resource allocation for media streaming in mobile networks,”in ACM MSWiM, Nov. 2015, pp. 255–262. [Online]. Available:http://doi.acm.org/10.1145/2811587.2811604
[5] X. Yin, A. Jindal, V. Sekar, and B. Sinopoli, “A control-theoreticapproach for dynamic adaptive video streaming over HTTP,” ACMSIGCOMM Computer Communication Review, vol. 45, no. 4, pp. 325–338, 2015.
[6] Y. Sun, X. Yin, J. Jiang, V. Sekar, F. Lin, N. Wang, T. Liu, andB. Sinopoli, “CS2P: Improving video bitrate selection and adaptationwith data-driven throughput prediction,” in ACM SIGCOMM, 2016, pp.272–285.
[7] N. Bui and J. Widmer, “Mobile network resource optimization underimperfect prediction,” in IEEE WoWMoM, 2015.
[8] T. Mangla, N. Theera-Ampornpunt, M. Ammar, E. Zegura, andS. Bagchi, “Video through a crystal ball: effect of bandwidth predic-tion quality on adaptive streaming in mobile environments,” in ACMInternational Workshop on Mobile Video (MoVid), 2016, p. 1.
[9] J. Huang, F. Qian, A. Gerber, Z. M. Mao, S. Sen, and O. Spatscheck,“A close examination of performance and power characteristics of 4glte networks,” in ACM MobiSys, 2012, pp. 225–238.
[10] J. Huang, F. Qian, Y. Guo, Y. Zhou, Q. Xu, Z. M. Mao, S. Sen, andO. Spatscheck, “An in-depth study of lte: Effect of network protocoland application behavior on performance,” in ACM SIGCOMM, Oct.2013, pp. 363–374.
[11] J. B. Landre, Z. E. Rawas, and R. Visoz, “Lte performance assessmentprediction versus field measurements,” in IEEE PIMRC, Sep. 2013, pp.2866–2870.
[12] A. Nikravesh, D. R. Choffnes, E. Katz-Bassett, Z. M. Mao, andM. Welsh, “Mobile network performance from user devices: A longitu-dinal, multidimensional analysis,” in Springer PAM, 2014, pp. 12–22.
[13] A. Nikravesh, H. Yao, S. Xu, D. Choffnes, and Z. M. Mao, “Mobilyzer:An open platform for controllable mobile network measurements,” inACM MobiSys, 2015, pp. 389–404.
[14] Ookla, “Speedtest mobile apps,” http://www.speedtest.net/mobile/, lastaccessed November 2016.
[15] Q. Xu, S. Mehrotra, Z. Mao, and J. Li, “PROTEUS: network perfor-mance forecast for real-time, interactive mobile applications,” in ACMMobiSys, Taipei, Taiwan, June 2013, pp. 347–360.
[16] Y. Xu, Z. Wang, W. K. Leong, and B. Leong, “An end-to-end measure-ment study of modern cellular data networks,” in Springer PAM, 2014,pp. 34–45.
[17] C. Ide, B. Dusza, and C. Wietfeld, “Performance of channel-awareM2M communications based on LTE network measurements.” in IEEEPIMRC, 2013, pp. 1614–1618.
[18] X. Xie, X. Zhang, S. Kumar, and L. E. Li, “pistream: Physical layerinformed adaptive video streaming over lte,” in ACM MobiCom, Sep.2015, pp. 413–425.
[19] S. Kumar, E. Hamed, D. Katabi, and L. Erran Li, “LTE radio analyticsmade easy and accessible,” in ACM SIGCOMM, vol. 44, no. 4, 2014,pp. 211–222.
[20] N. Bui and J. Widmer, “OWL: a Reliable Online Watcher for LTEControl Channel Measurements,” in ACM All Things Cellular, Oct.2016.
[21] Y. Li, C. Peng, Z. Yuan, J. Li, H. Deng, and T. Wang, “Mobileinsight:Extracting and analyzing cellular network information on smartphones,”in ACM Mobicom, Oct. 2016.
[22] A. Elnashar and M. A. El-Saidny, “Looking at lte in practice: Aperformance analysis of the lte system based on field test results,” IEEEVehicular Technology Magazine, vol. 8, no. 3, pp. 81–92, Sep. 2013.
[23] N. Becker, A. Rizk, and M. Fidler, “A measurement study on theapplication-level performance of lte,” in IFIP Networking Conference,June 2014, pp. 1–9.
[24] M. Jovanovic, M. K. Karray, and B. Blaszczyszyn, “QoS and networkperformance estimation in heterogeneous cellular networks validated byreal-field measurements,” in ACM PE-WASUN, 2014, pp. 25–32.
[25] M. Siekkinen, M. A. Hoque, J. K. Nurminen, and M. Aalto, “Streamingover 3g and lte: How to save smartphone energy in radio accessnetwork-friendly way,” in ACM MoVid, May 2013, pp. 13–18.
[26] M. Palola, M. Matinmikko, J. Prokkola, M. Mustonen, M. Heikkil,T. Kippola, S. Yrjl, V. Hartikainen, L. Tudose, A. Kivinen, J. Paavola,and K. Heiska, “Live field trial of licensed shared access (LSA) conceptusing LTE network in 2.3 GHz band,” in IEEE DYSPAN, Apr. 2014,pp. 38–47.
[27] W. Li, R. K. P. Mok, D. Wu, and R. K. C. Chang, “On the accuracy ofsmartphone-based mobile network measurement,” in IEEE INFOCOM,Apr. 2015, pp. 370–378.
[28] Nuand, “Bladerf software defined radio,” https://www.nuand.com/blog/product/bladerf-x40/, last accessed November 2016.
[29] Motorola, “MotoG LTE,” http://www.devicespecifications.com/en/model/10da2ca3, last accessed November 2016.
[30] Huawei, “P8 Lite,” http://www.devicespecifications.com/en/model/b95e33c3, last accessed November 2016.
[31] ZTE, “Blade A452,” http://www.devicespecifications.com/en/model/a44f38ba, last accessed November 2016.
[32] MartinGarcia, Luis, “TCPdump,” http://www.tcpdump.org/, last ac-cessed November 2016.
[33] I. Gomez-Miguelez, A. Garcia-Saavedra, P. D. Sutton, P. Serrano,C. Cano, and D. J. Leith, “srsLTE: An open-source platform for LTEevolution and experimentation,” in ACM WinTECH, Oct. 2016.
[34] F. Michelinakis, N. Bui, G. Fioravantti, F. Kaup, D. Hausheer, andJ. Widmer, “Lightweight mobile bandwidth availability measurement,”Elsevier Computer Communications, vol. 84, pp. 73–83, Jun. 2016.
[35] ETSI, “E-UTRA; Physical layer procedures,” 3GPP TS, vol. 36.213, p.V13, 2016.
[36] Wireless Open Access Research Platform, “802.11 reference designfor WARP v3,” http://warpproject.org/trac/wiki/802.11, last accessedNovember 2016.
[37] ETSI, “E-UTRA; Medium Access Control (MAC) protocol specifica-tion,” 3GPP TS, vol. 36.321, p. V13, 2016.


![Fine-Grained Classification of Product Images Based on ...For fine-grained classification, Yao [7] presented a codebook-free and annota-tion-free approach for fine-grained image categorization](https://img.pdfslide.us/doc/110x75/604cb33cad8012213a236236/fine-grained-classification-of-product-images-based-on-for-fine-grained-classification.jpg)