Embed Size (px)
Citation preview

1Fin 2802, Spring 10 - TangChapter 24: Performance Evaluation
Fin2802: Investments
Spring, 2010Dragon Tang
Fin2802: Investments
Spring, 2010Dragon Tang
Lectures 21&22Performance Evaluation
April 13 & 15, 2010
Readings: Chapter 24Practice Problem Sets: 4,6,8,9,10-14

2Fin 2802, Spring 10 - TangChapter 24: Performance Evaluation
Wall Street Interview QuestionWall Street Interview Question
You have a large jar containing 999 fair pennies and one two-headed penny. Suppose you pick one coin out of the jar and flip it 10 times and get all heads. What is the probability that the coin you chose is the two-headed one?

3Fin 2802, Spring 10 - TangChapter 24: Performance Evaluation
Performance EvaluationPerformance Evaluation
Objectives:
1. Compute risk-adjusted rates of return.
2. Decompose excess returns into components attributable to asset allocation choices versus security selection choices.
3. Assess the performance of portfolio managers.
4. Assess the value of Market Timing Ability

4Fin 2802, Spring 10 - TangChapter 24: Performance Evaluation
PerformancePerformance
• Skill– Timing ability (asset allocation)– Selection ability (security selection)
• Luck
Goal of performance evaluation is to distinguish skill (and specific components) from luck!

5Fin 2802, Spring 10 - TangChapter 24: Performance Evaluation
Risk-Adjusted ReturnsRisk-Adjusted Returns
Comparison groups:
•Blindly comparing rates of return ignores risk
•Comparison groups with similar investment styles and portfolio characteristics can be used for performance comparison

6
Figure 24.1 Universe ComparisonFigure 24.1 Universe Comparison
Fin 2802, Spring 10 - TangChapter 24: Performance Evaluation

7Fin 2802, Spring 10 - TangChapter 24: Performance Evaluation
Risk AdjustmentsRisk Adjustments
•Sharpe measure
•Treynor measure
•Jensen measure
8Fin 2802, Spring 10 - TangChapter 24: Performance Evaluation
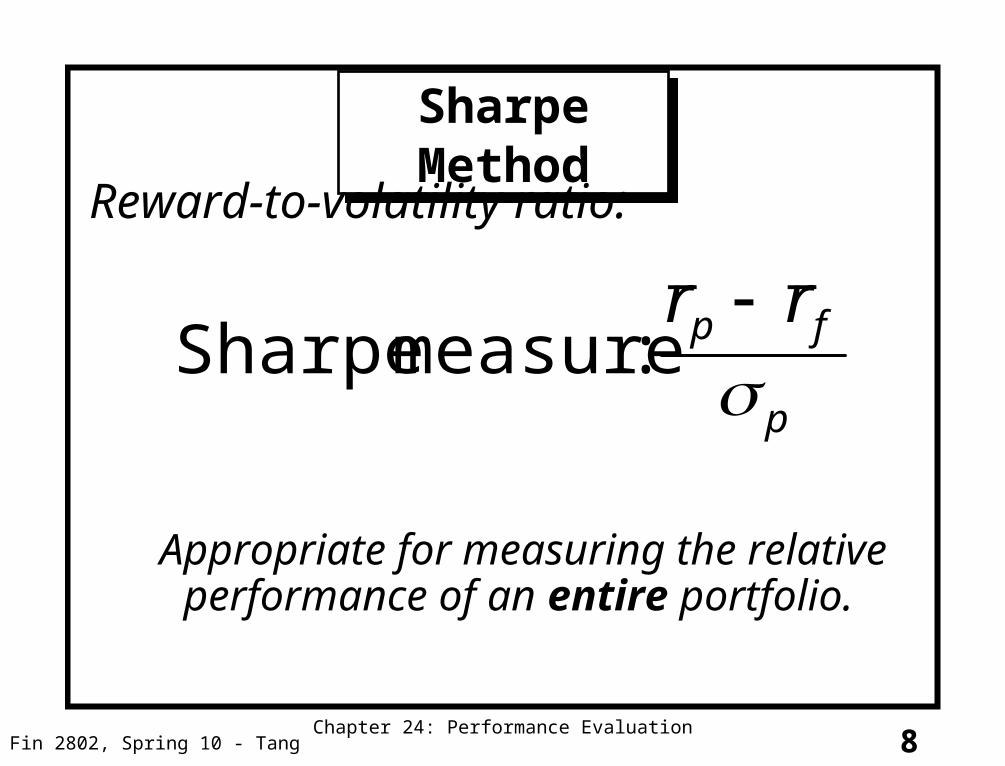
Sharpe MethodSharpe Method
Sharpe measure:r rp f
p
_ _Reward-to-volatility ratio:
Appropriate for measuring the relative performance of an entire portfolio.

9
M2 MeasureM2 Measure
• Developed by Modigliani and Modigliani
• Equates the volatility of the managed portfolio with the market by creating a hypothetical portfolio made up of T-bills and the managed portfolio
• If the risk is lower than the market, leverage is used and the hypothetical portfolio is compared to the market
Fin 2802, Spring 10 - TangChapter 24: Performance Evaluation

10
Figure 24.2 M2 of Portfolio P Figure 24.2 M2 of Portfolio P
Fin 2802, Spring 10 - TangChapter 24: Performance Evaluation

11
M2 Measure: ExampleM2 Measure: Example
Managed Portfolio: return = 35% standard deviation = 42%
Market Portfolio: return = 28% standard deviation = 30% T-bill return = 6%
Hypothetical Portfolio:
30/42 = .714 in P (1-.714) or .286 in T-bills
(.714) (.35) + (.286) (.06) = 26.7%
Since this return is less than the market, the managed portfolio underperformed
Fin 2802, Spring 10 - TangChapter 24: Performance Evaluation
12Fin 2802, Spring 10 - TangChapter 24: Performance Evaluation
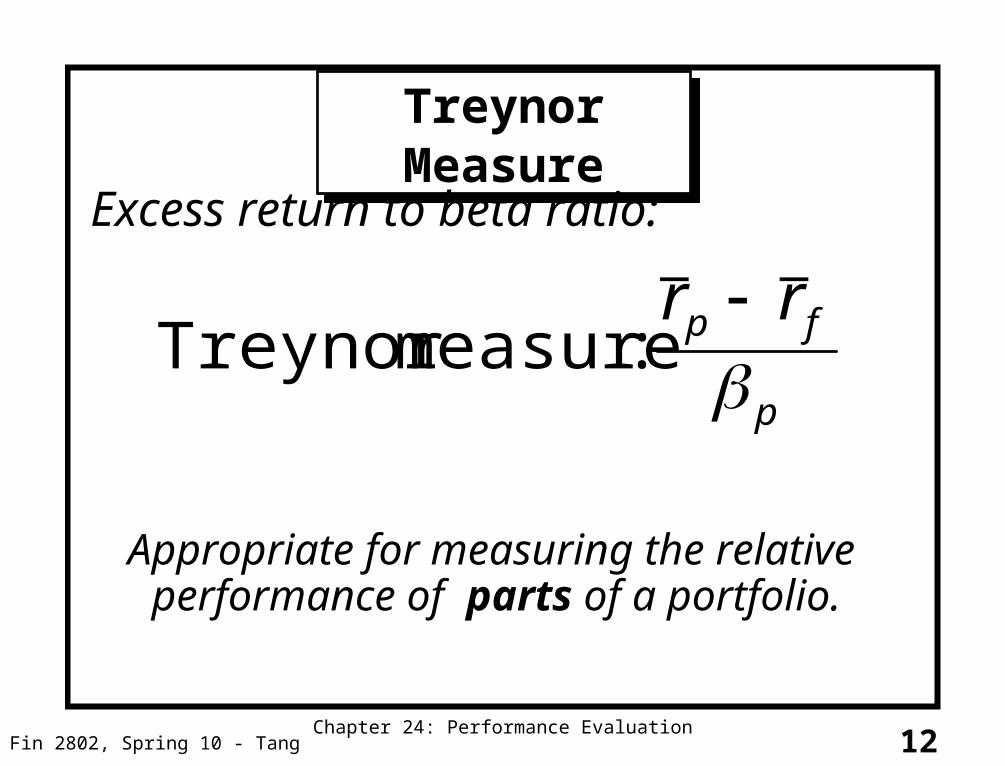
Treynor MeasureTreynor Measure
Treynor measure:r rp f
p
_ _Excess return to beta ratio:
Appropriate for measuring the relative performance of parts of a portfolio.

13Fin 2802, Spring 10 - TangChapter 24: Performance Evaluation
Jensen MeasureJensen Measure
Jensen measure:
p p f p M fr r r r
Appropriate for measuring the absolute performance of a portfolio.
Alpha of an investment (from CAPM):

14
Information RatioInformation Ratio
Information Ratio = p / (ep)
Information Ratio divides the alpha of the portfolio by the nonsystematic risk
Nonsystematic risk could, in theory, be eliminated by diversification
Fin 2802, Spring 10 - TangChapter 24: Performance Evaluation

15Fin 2802, Spring 10 - TangChapter 24: Performance Evaluation
Which one to use?Which one to use?
• Sharpe measure:
Useful when assets are concentrated within a single portfolio managers
• Treynor and Jensen measures:
Useful when assets are spread across many portfolio managers.

16
Figure 24.3 Treynor’s MeasureFigure 24.3 Treynor’s Measure
Fin 2802, Spring 10 - TangChapter 24: Performance Evaluation

17
Table 24.2 Excess Returns for Portfolios P and Q and the Benchmark M over 12 Months
Table 24.2 Excess Returns for Portfolios P and Q and the Benchmark M over 12 Months
Fin 2802, Spring 10 - TangChapter 24: Performance Evaluation

18
Table 24.3 Performance Statistics Table 24.3 Performance Statistics
Fin 2802, Spring 10 - TangChapter 24: Performance Evaluation

19Fin 2802, Spring 10 - TangChapter 24: Performance Evaluation
Risk and Changing Portfolio Composition (Limitation of Performance Measures)
Risk and Changing Portfolio Composition (Limitation of Performance Measures)
• Risk adjustment techniques assume that portfolio risk is constant over the relevant time period.
• However, changing the mean return and risk will add to the appearance of higher volatility.

20Fin 2802, Spring 10 - TangChapter 24: Performance Evaluation
Market Timing and LuckMarket Timing and Luck
• If the portfolio manager can time the market, she would shift funds from the safe asset to the market portfolio (from cash to stocks or bonds) just before the market upturn.
• This would increase the portfolio beta.
• Empirical evidence indicates that betas did not increase prior to market advances indicating no evidence of successful market timing. (EMH strikes again)!

21Fin 2802, Spring 10 - TangChapter 24: Performance Evaluation
Performance Attribution ProceduresPerformance Attribution Procedures
•Understand which decisions lead to superior or inferior performance
•Attribution studies start from the broadest asset allocation choices and progress towards every-finer details of portfolio choice.

22Fin 2802, Spring 10 - TangChapter 24: Performance Evaluation
Performance Attribution ProcessPerformance Attribution Process
Components of Decomposition:
1. Broad asset market allocation choices (equity, fixed income and money market funds)
2. Industries (sectors) choices within each market
3. Security choices within each sector

23Fin 2802, Spring 10 - TangChapter 24: Performance Evaluation
Performance Attribution ProceduresPerformance Attribution Procedures
• The Bogey is the return an investment manager is compared to for performance evaluation.
• The bogey portfolio indicates the returns of a completely passive strategy.
• Performance at each step is to be compared to a benchmark or bogey portfolio.

24Fin 2802, Spring 10 - TangChapter 24: Performance Evaluation
Performance of the Managed PortfolioPerformance of the Managed Portfolio

25Fin 2802, Spring 10 - TangChapter 24: Performance Evaluation
Performance AttributionPerformance Attribution
1. Asset allocation
2. Security selection– Equity
» Sector allocation
» Security allocation
– Fixed Income

26Fin 2802, Spring 10 - TangChapter 24: Performance Evaluation
Performance Attribution:Asset Allocation Contribution
Performance Attribution:Asset Allocation Contribution
Was superior performance due to asset allocation?
• Compare the return from the active allocation procedure to a hypothetical passive portfolio composed of indices in every category (stocks, bonds…).

27Fin 2802, Spring 10 - TangChapter 24: Performance Evaluation
Performance AttributionPerformance Attribution
28Fin 2802, Spring 10 - TangChapter 24: Performance Evaluation
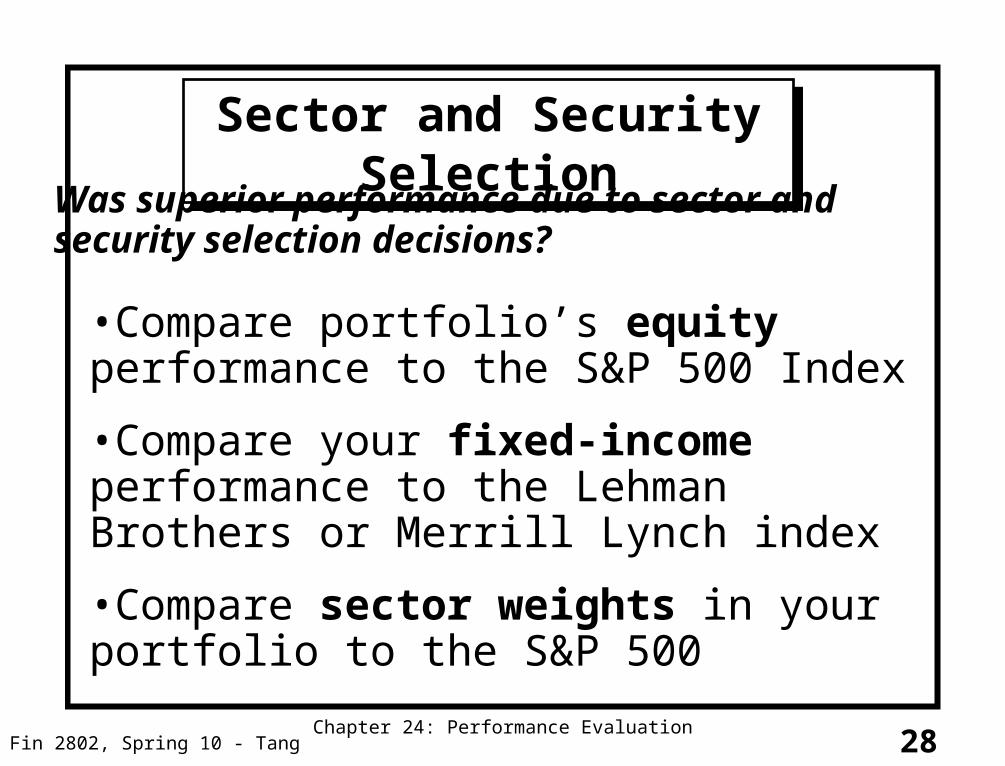
Sector and Security SelectionSector and Security Selection
Was superior performance due to sector and security selection decisions?
•Compare portfolio’s equity performance to the S&P 500 Index
•Compare your fixed-income performance to the Lehman Brothers or Merrill Lynch index
•Compare sector weights in your portfolio to the S&P 500

29Fin 2802, Spring 10 - TangChapter 24: Performance Evaluation
Sector Allocation Within the Equity MarketSector Allocation Within the Equity Market

30Fin 2802, Spring 10 - TangChapter 24: Performance Evaluation
Portfolio Attribution: SummaryPortfolio Attribution: Summary
31Fin 2802, Spring 10 - TangChapter 24: Performance Evaluation
Market TimingMarket Timing
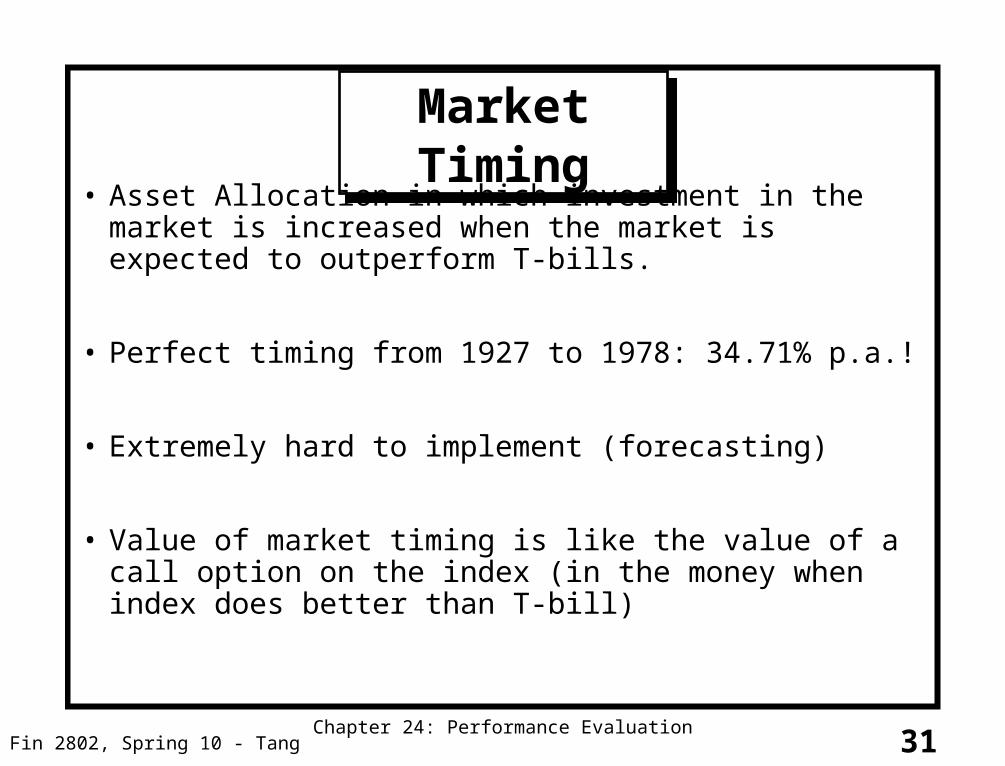
• Asset Allocation in which investment in the market is increased when the market is expected to outperform T-bills.
• Perfect timing from 1927 to 1978: 34.71% p.a.!
• Extremely hard to implement (forecasting)
• Value of market timing is like the value of a call option on the index (in the money when index does better than T-bill)

32
Table 24.5 Performance of Bills, Equities and (Annual) Timers – Perfect and Imperfect
Table 24.5 Performance of Bills, Equities and (Annual) Timers – Perfect and Imperfect
Fin 2802, Spring 10 - TangChapter 24: Performance Evaluation

33Fin 2802, Spring 10 - TangChapter 24: Performance Evaluation
rrff
rrffrrMM
Rate of Return of a Perfect Market TimerRate of Return of a Perfect Market Timer

34Fin 2802, Spring 10 - TangChapter 24: Performance Evaluation
Value of Imperfect ForecastingValue of Imperfect Forecasting
• Being “right most of the time” does not necessarily mean having forecasting abilities.
• Need to examine the proportion of correct “bull market forecast” (P1) and correct “bear market forecast” (P2).
• Measure of market timing ability: P1+P2-1
• Value of imperfect forecasting: (P1+P2-1)xC
where C=call option value of a perfect market timer

35Fin 2802, Spring 10 - TangChapter 24: Performance Evaluation
Practical MeasuresPractical Measures
• Morningstar mutual fund rankings– Similar to mean Standard Deviation rankings
– Companies are put into peer groups
– Stars are assigned: 1-lowest; 5-highest
– Highly correlated to Sharpe measures
• Style analysis– Explaining percentage returns by allocation to style
– Popular with the industry
• Treynor-Black Model: combine actively managed stocks with a passively managed portfolio

36
Style AnalysisStyle Analysis• Introduced by William Sharpe
• 1992 study of mutual fund performance
– 91.5% of variation in return could be explained by the funds’ allocations to bills, bonds and stocks
• Later studies show that 97% of the variation in return could be explained by the funds’ allocation to a broader range of asset classes
Fin 2802, Spring 10 - TangChapter 24: Performance Evaluation

37
Table 24.6 Sharpe’s Style Portfolios for the Magellan FundTable 24.6 Sharpe’s Style Portfolios for the Magellan Fund
Fin 2802, Spring 10 - TangChapter 24: Performance Evaluation
38
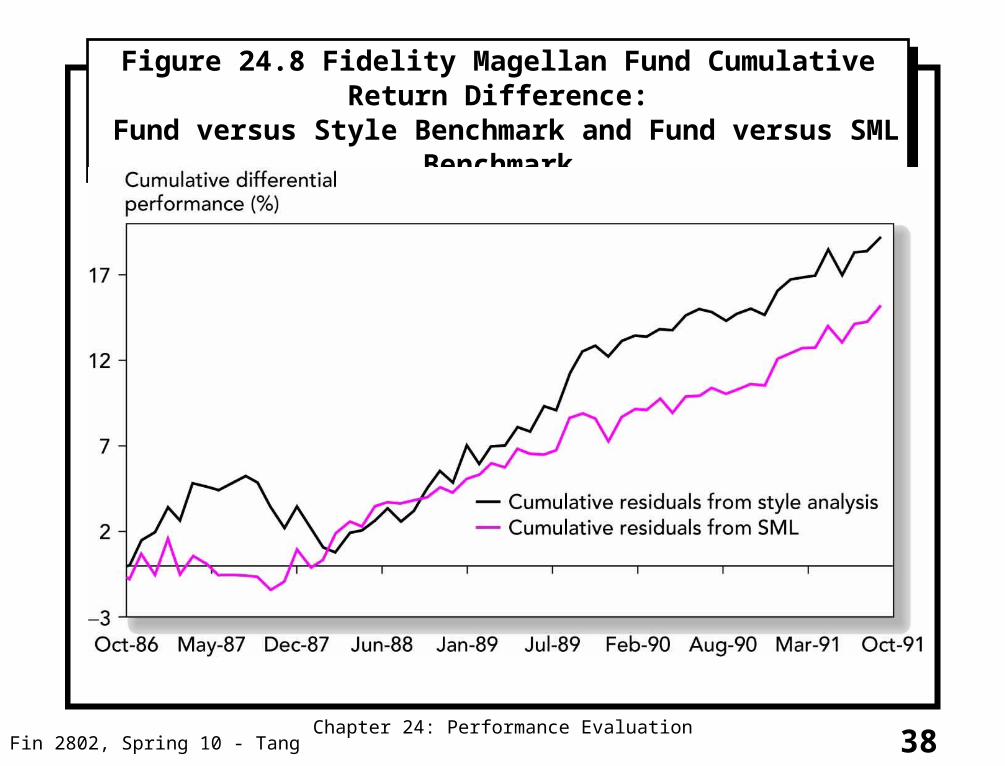
Figure 24.8 Fidelity Magellan Fund Cumulative Return Difference: Fund versus Style Benchmark and Fund versus SML Benchmark
Figure 24.8 Fidelity Magellan Fund Cumulative Return Difference: Fund versus Style Benchmark and Fund versus SML Benchmark
Fin 2802, Spring 10 - TangChapter 24: Performance Evaluation
39
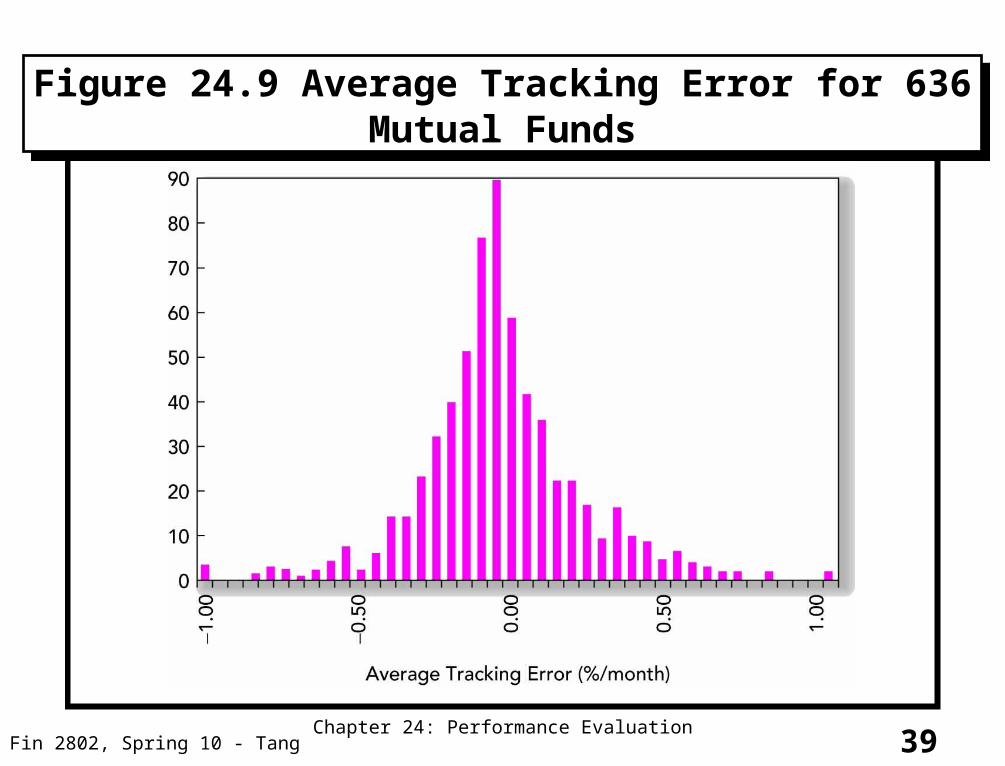
Figure 24.9 Average Tracking Error for 636 Mutual FundsFigure 24.9 Average Tracking Error for 636 Mutual Funds
Fin 2802, Spring 10 - TangChapter 24: Performance Evaluation

40Fin 2802, Spring 10 - TangChapter 24: Performance Evaluation
SummarySummary
• Measures of portfolio performanceSharpe measure; Treynor measure; Jensen measure
• Shifting mean and variance of actively managed portfolios creates problems with performance measures
• Performance attribution procedures allow evaluator to judge performance based on asset allocation, industry (sector) allocation and security selection
• Market timing as a call option
• Value of imperfect forecasting• April 22: Project Presentation
10 minutes per group: 8 minute presentation, 2 minutes Q&ASend your presentation to TA before presentation day!