Embed Size (px)
Citation preview
1
Faculty Advisors:
RDML Richard Williams (RET) Professor Eugene Paulo
December 1, 2006
Systems Engineering and Analysis Cohort 10:
LT Andrew Bucher, SWO, Team LeaderLCDR James Beaver, NFOLCDR Pedro Mercado, NFOLT Richard Byers, SWOLT Jennifer Free, SWO LT Tristan Oliveria, SWO
SEA-10 RIVERINE 2010Integrated Project

Agenda
0800 Introduction
0815 Systems Engineering Design Process
0830 Modeling & Analysis
0845 Data Outputs, Process, Assumptions & Limitations
0900 Cost Estimation & System Reliability
0915 Data Analysis
0930 Conclusions & Recommendations
0945 Questions
BULLARD HALL 100B
1000 Breakout Session & Model Demonstration

3
Primitive Need
“…our Navy is missing a great opportunity to influence events by not having a riverine force.”
- Admiral Mike Mullen, Chief of Naval Operations, speech to the Naval War College in August 2005
“…I want the biggest bang for the buck.”- RADM Donald Bullard, Commander NECC, meeting with SEA-10
“The biggest tactical limitation inherent in operating on the water is not being able to see very far beyond the banks. ”
- Mr. Joshua Iverson, Staff Sergeant, USMC (RET), assigned to Small Craft Company in Iraq, Meeting with SEA-10 at Special Mission Training Center

4
RIVGRU ONE Feedback
• VTC 30 November 2006– Value of single sensor versus networked sensors– UAV cost numbers too high– Further use of SEA-10 MANA model– USV dwell time and automation– Verified and validated reliability numbers– Perceived USV reliability low, UAV plug and play
reliability better– Further study of sustainment/logistics

5
Riverine Operations
• Riverine Area Control/Protect Critical Infrastructure
• Interdiction of Riverine Lines of communication• Fire Support• Insertion / extraction of conventional ground
forces• Theater Security Cooperation
6
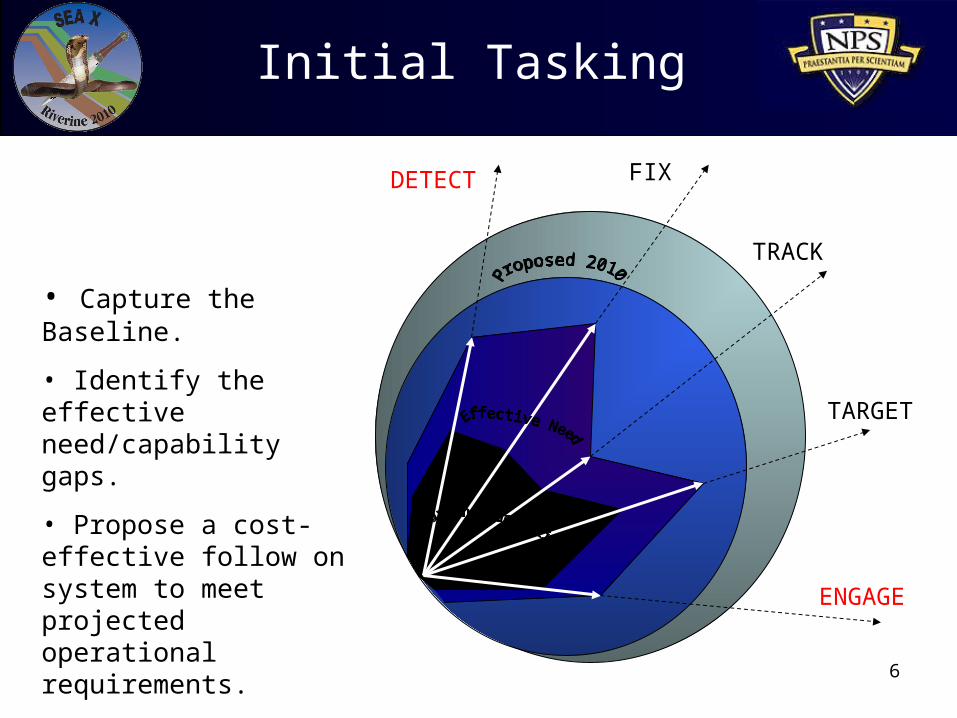
Initial Tasking
ENGAGE
DETECT
TARGET
TRACK
FIX
• Capture the Baseline.
• Identify the effective need/capability gaps.
• Propose a cost-effective follow on system to meet projected operational requirements.

7
Research Focus
• “Most bang for the buck”• Alternatives• Unmanned systems• Organic indirect fires• Ground combat element • Dedicated helicopter support
8
Modeled Alternatives
OR
OR
OR
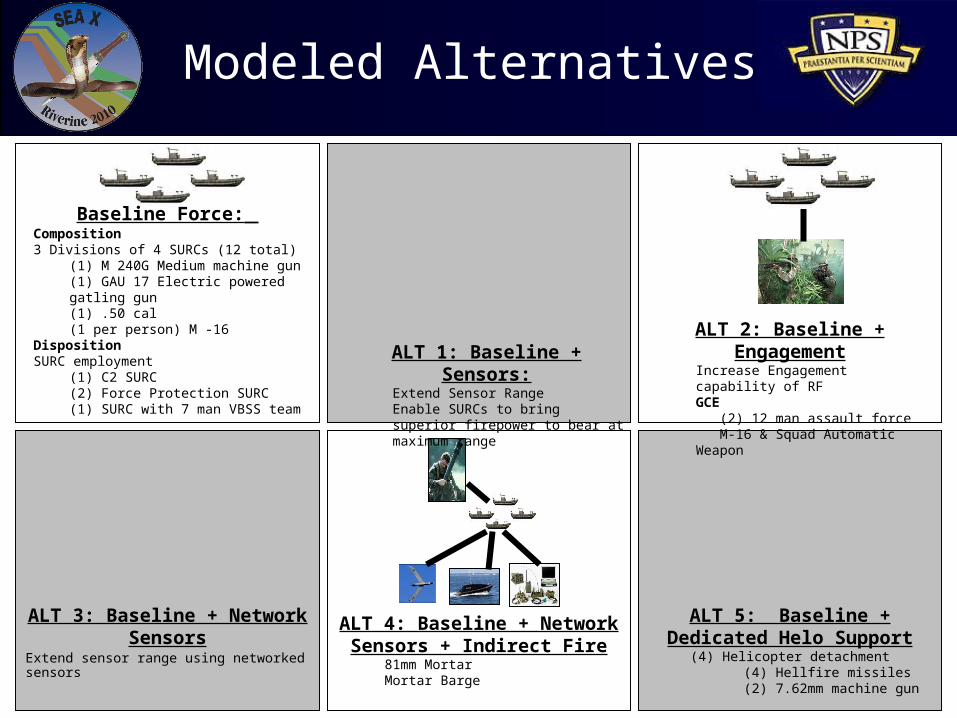
Baseline Force: Composition3 Divisions of 4 SURCs (12 total)
(1) M 240G Medium machine gun (1) GAU 17 Electric powered gatling gun (1) .50 cal(1 per person) M -16
DispositionSURC employment
(1) C2 SURC(2) Force Protection SURC(1) SURC with 7 man VBSS team
ALT 1: Baseline + Sensors:Extend Sensor RangeEnable SURCs to bring superior firepower to bear at maximum range
ALT 2: Baseline + EngagementIncrease Engagement capability of RFGCE (2) 12 man assault force M-16 & Squad Automatic Weapon
ALT 3: Baseline + Network Sensors
Extend sensor range using networked sensors
ALT 4: Baseline + Network Sensors + Indirect Fire81mm MortarMortar Barge
ALT 5: Baseline + Dedicated Helo Support
(4) Helicopter detachment(4) Hellfire missiles(2) 7.62mm machine gun

9
EFFICIENCY FRONTIER ACROSS SCENARIOS
MORTAR TM
Baseline
UAV
USV
UGS
NET
GCE
HH60
MORTAR BARGE
NW MORTAR TM
NW MORTAR BARGE
0
25
50
75
$250 $270 $290 $310 $330 $350 $370 $390 $410 $430 $450
TOTAL 10 YEAR OPERATING COST FY06M$
TO
TA
L U
TIL
ITY
SC
OR
E
Bang for the Buck
10
Research Insights
• The Unmanned Surface Vehicle provided the greatest overall improvement system performance for the cost
• Dedicated helicopter support generated the best performance, but was the most costly alternative
11
Research Insights
• Improved sensor capability had the greatest effect on overall system performance for the associated cost
• A single unmanned sensor enhanced baseline force performance and the networked sensor alternatives
12
Research Insights
• The ground combat element performance was scenario dependent
• All modeled alternatives improved battle space awareness and/or situational responsiveness over the baseline force.
• All alternatives are fractional cost increases to the baseline
13
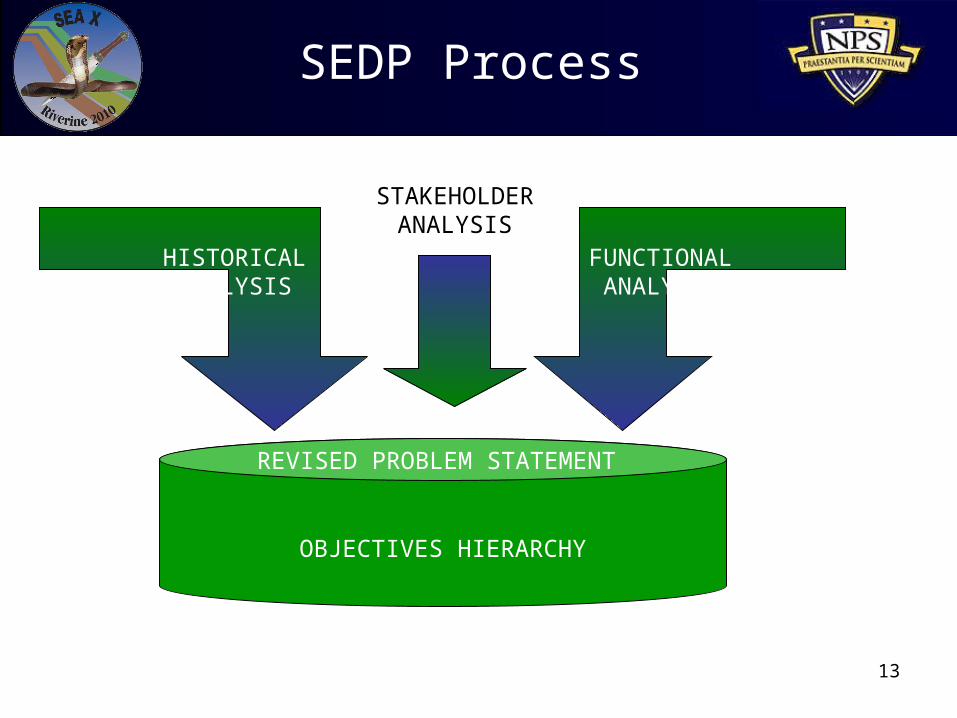
SEDP Process
HISTORICALANALYSIS
FUNCTIONALANALYSIS
OBJECTIVES HIERARCHY
STAKEHOLDERANALYSIS
REVISED PROBLEM STATEMENT
14
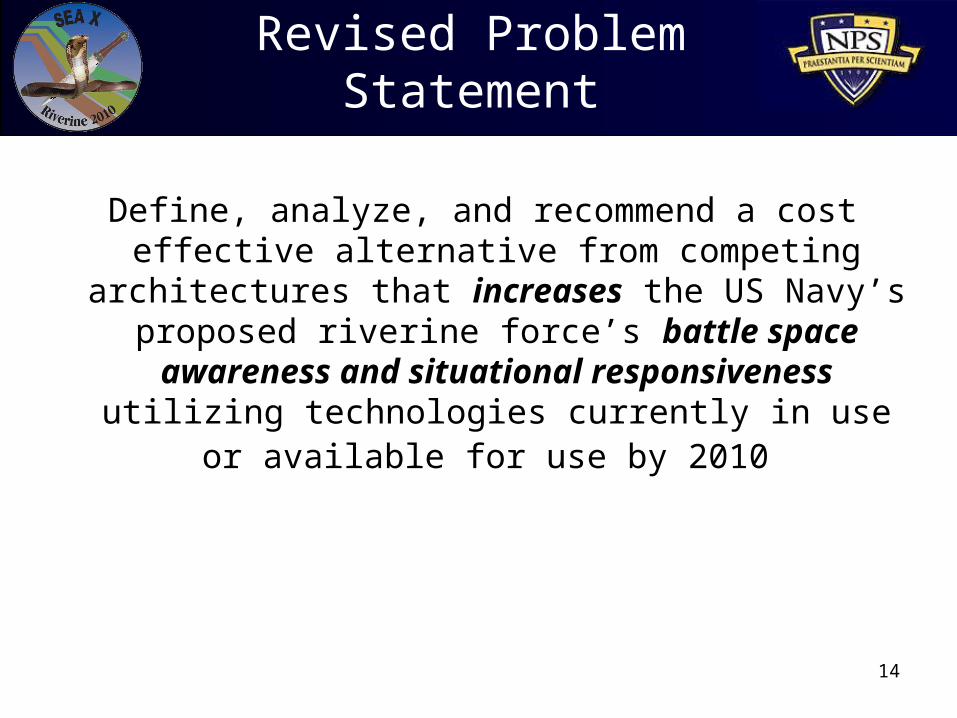
Revised Problem Statement
Define, analyze, and recommend a cost effective alternative from competing architectures that
increases the US Navy’s proposed riverine force’s battle space awareness and situational
responsiveness utilizing technologies currently in use or available for use by 2010
15
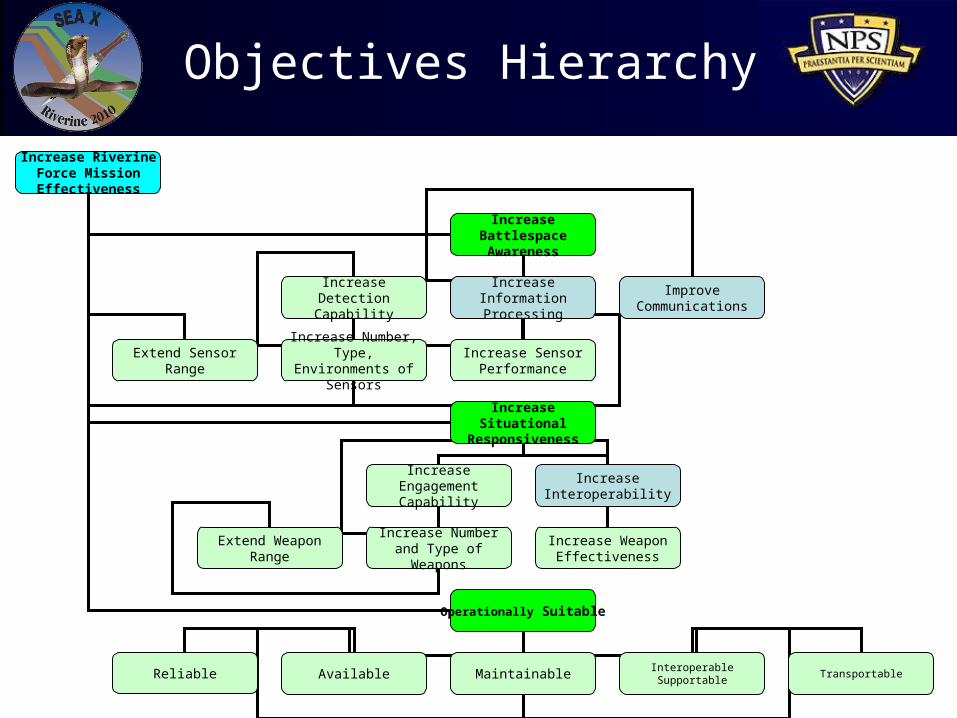
Objectives Hierarchy
Increase Riverine Force Mission Effectiveness
Increase Detection Capability
Increase Engagement Capability
Extend Sensor RangeIncrease Number,
Type, Environments of Sensors
Increase Sensor Performance
Extend Weapon RangeIncrease Number and
Type of Weapons
Increase Interoperability
Increase Battlespace Awareness
Increase Situational Responsiveness
Increase Information Processing
Improve Communications
Increase Weapon Effectiveness
Operationally Suitable
Reliable Available MaintainableInteroperableSupportable
Transportable
16
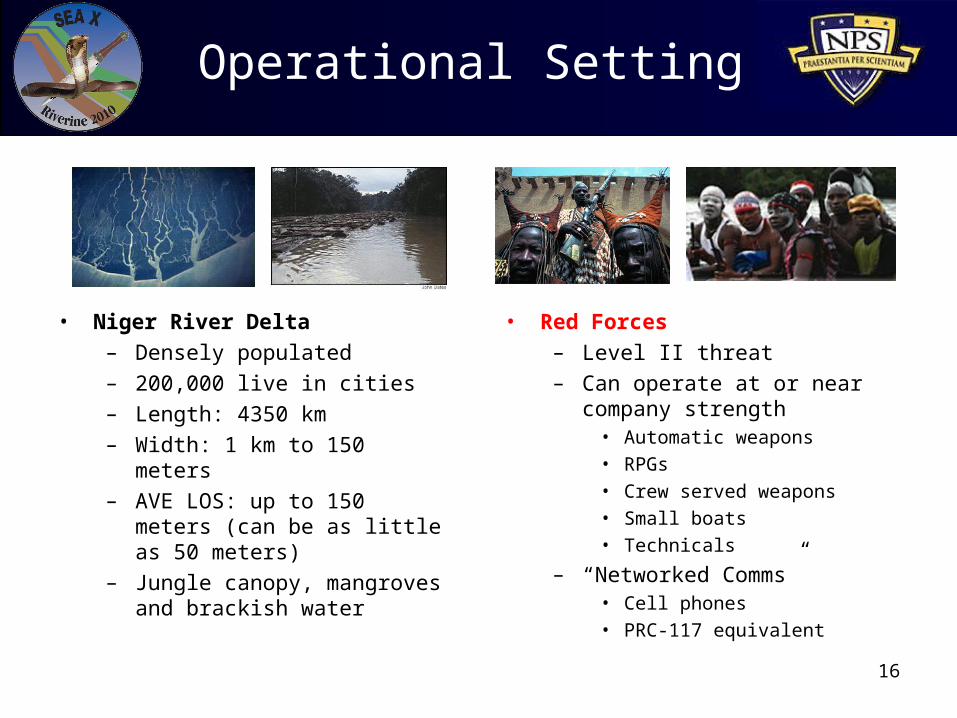
Operational Setting
• Niger River Delta– Densely populated– 200,000 live in cities– Length: 4350 km– Width: 1 km to 150 meters– AVE LOS: up to 150 meters (can
be as little as 50 meters)– Jungle canopy, mangroves and
brackish water
• Red Forces– Level II threat– Can operate at or near
company strength• Automatic weapons
• RPGs
• Crew served weapons
• Small boats
• Technicals
– “Networked Comms” • Cell phones
• PRC-117 equivalent
17
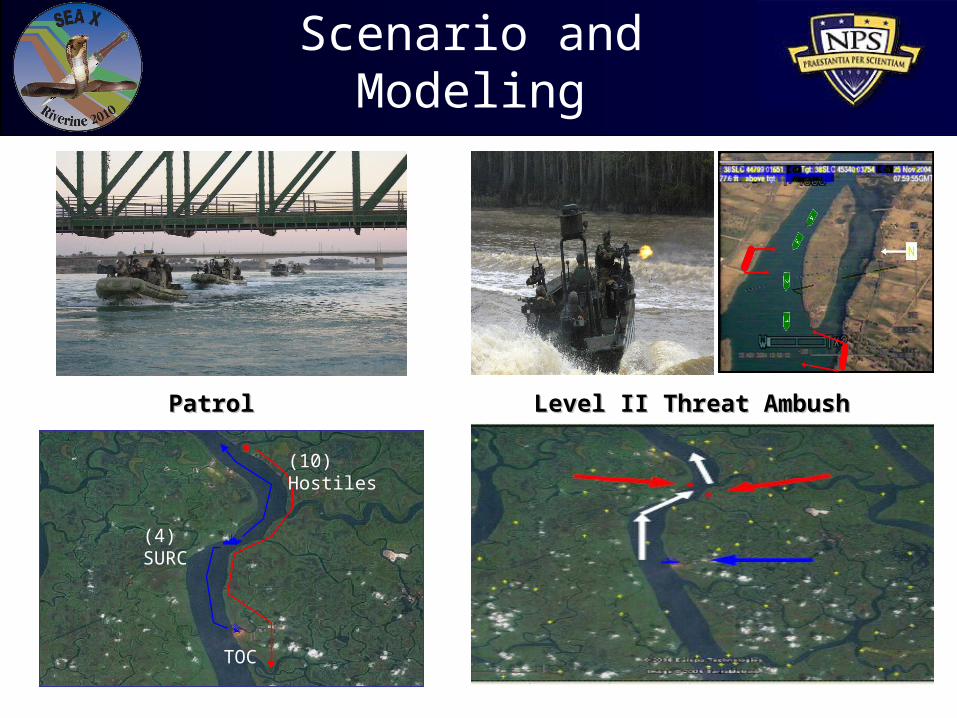
Scenario and Modeling
Level II Threat AmbushLevel II Threat AmbushPatrolPatrol
TOC
(4) SURC
(10) Hostiles
18
LT Rich Byers
SEA-10 Modeling
19
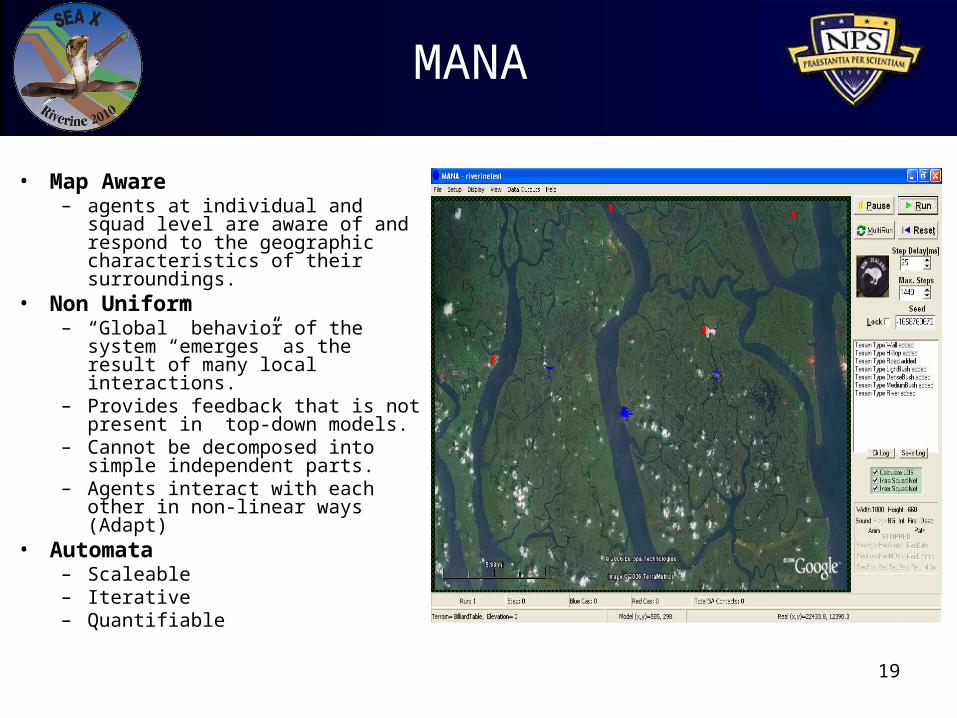
MANA
• Map Aware– agents at individual and squad
level are aware of and respond to the geographic characteristics of their surroundings.
• Non Uniform– “Global” behavior of the system
“emerges” as the result of many local interactions.
– Provides feedback that is not present in top-down models.
– Cannot be decomposed into simple independent parts.
– Agents interact with each other in non-linear ways (Adapt)
• Automata– Scaleable– Iterative– Quantifiable

20
Battlefield
• Specifications– Real World– 24 x 15 mile– 38m/grid x 36 m/grid– Conversion to 8 bit
palletized version
21
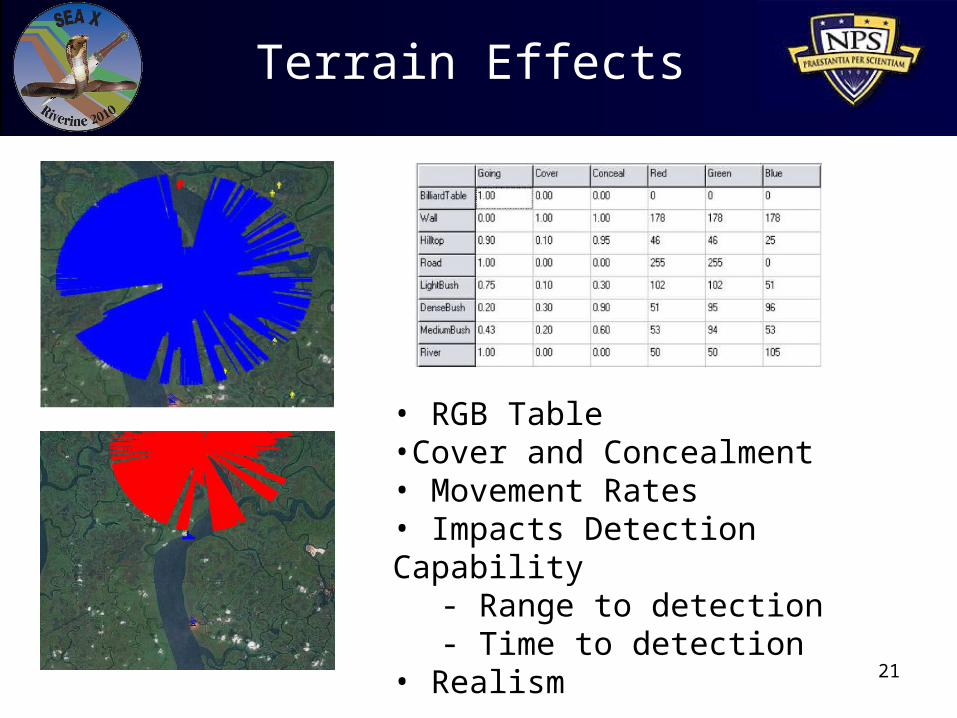
Terrain Effects
• RGB Table •Cover and Concealment• Movement Rates• Impacts Detection Capability
- Range to detection- Time to detection
• Realism
22
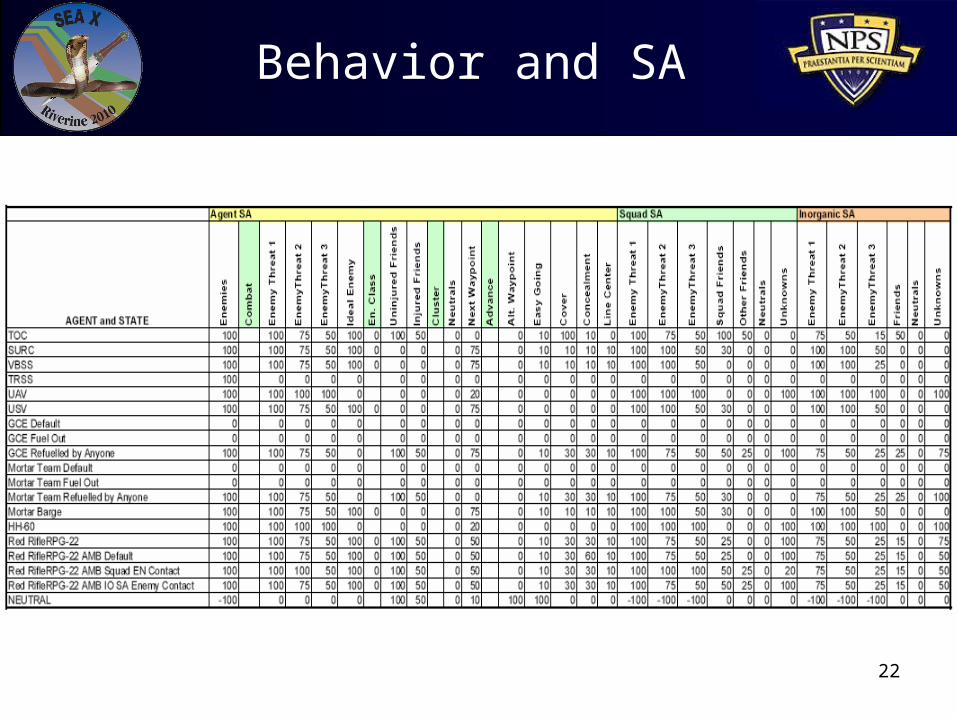
Behavior and SA

23
Weapons
24
Process
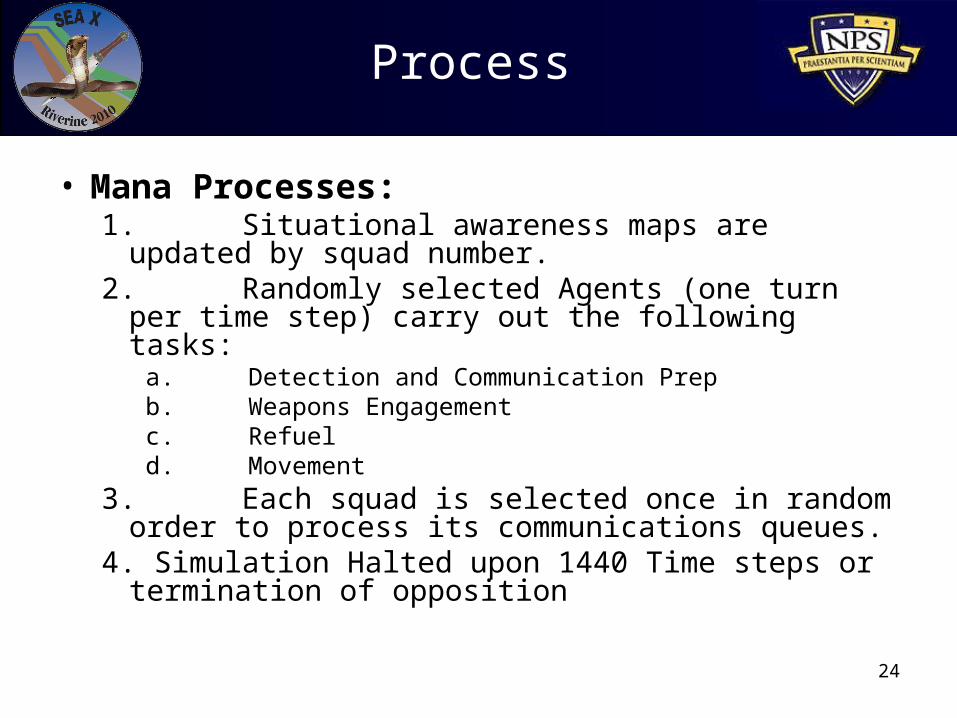
• Mana Processes:1. Situational awareness maps are updated by
squad number.2. Randomly selected Agents (one turn per time
step) carry out the following tasks:a. Detection and Communication Prepb. Weapons Engagementc. Refueld. Movement
3. Each squad is selected once in random order to process its communications queues.
4. Simulation Halted upon 1440 Time steps or termination of opposition

25
• Movement– MANA limits velocity ratio to 1000 grids per
100 time steps• Modern vehicles exceed this by a factor of 100• Limits all vehicles to 22 kph
• Disembarking Forces– Transportation load/unload unavailable– Simulated via prestaging and refueling
Limitations
26
Limitations
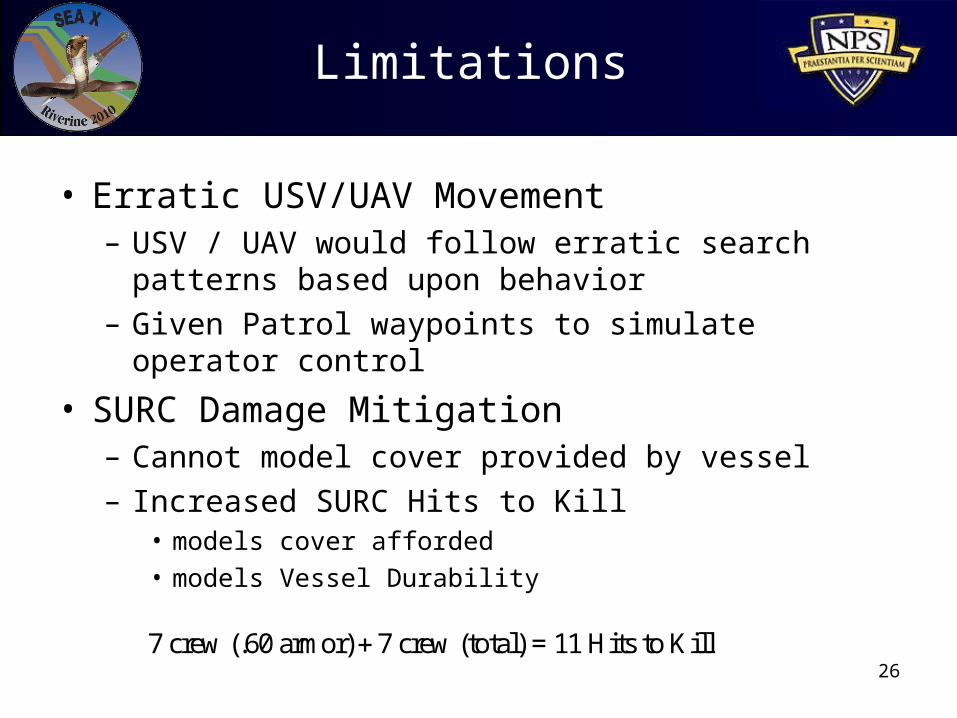
• Erratic USV/UAV Movement– USV / UAV would follow erratic search patterns based
upon behavior– Given Patrol waypoints to simulate operator control
• SURC Damage Mitigation– Cannot model cover provided by vessel– Increased SURC Hits to Kill
• models cover afforded• models Vessel Durability
7 crew (.60 armor) 7 crew (total) = 11 Hits to Kill
27
Limitations
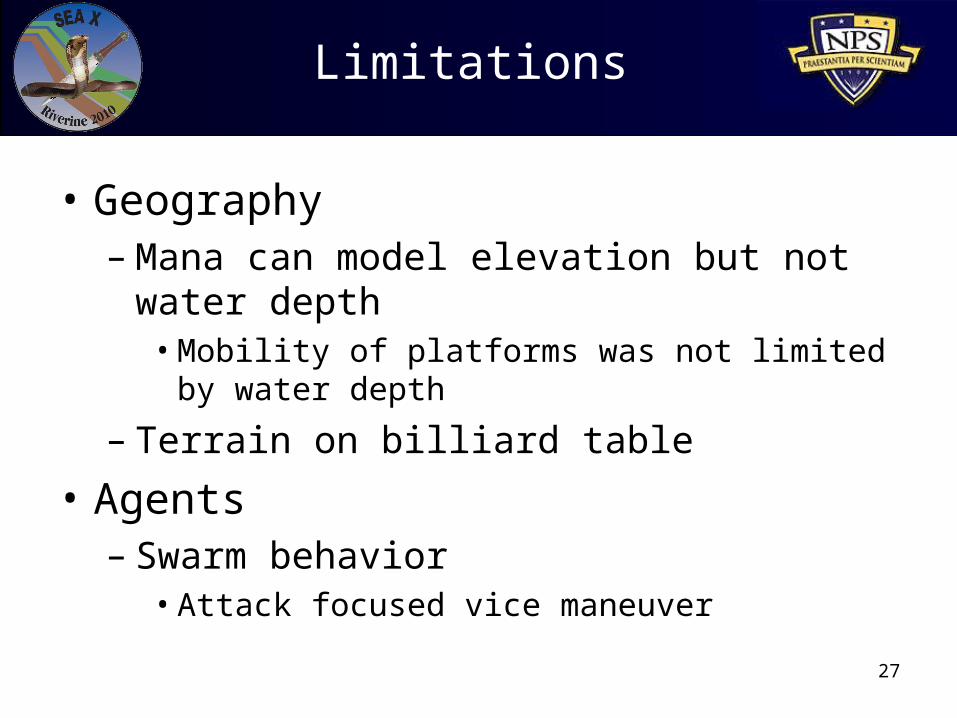
• Geography– Mana can model elevation but not water depth
• Mobility of platforms was not limited by water depth
– Terrain on billiard table
• Agents– Swarm behavior
• Attack focused vice maneuver
28
Clutter
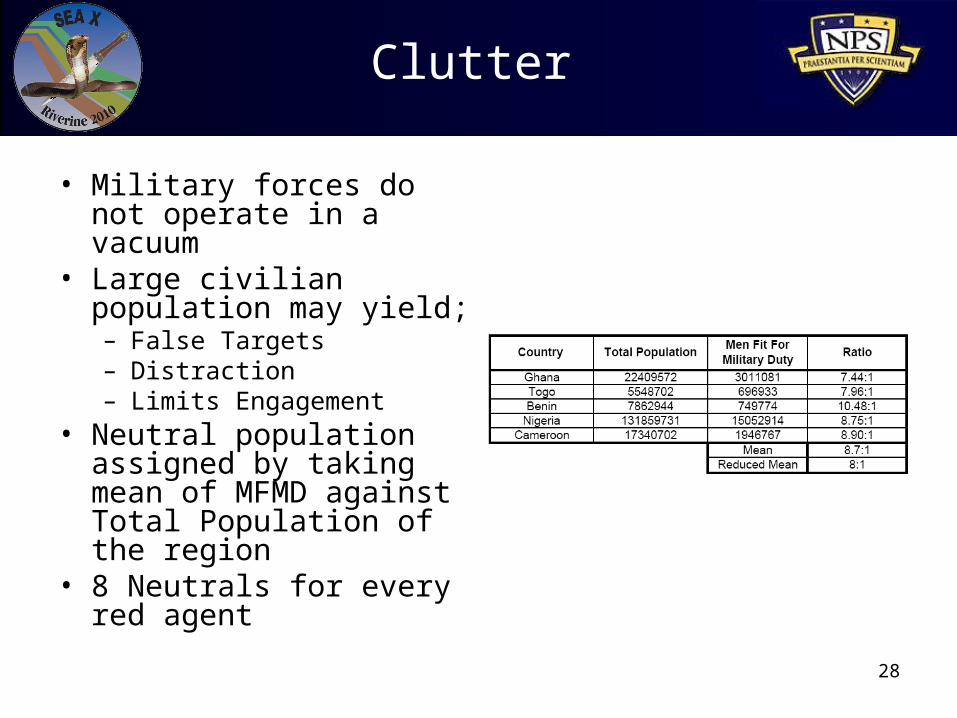
• Military forces do not operate in a vacuum
• Large civilian population may yield;– False Targets– Distraction– Limits Engagement
• Neutral population assigned by taking mean of MFMD against Total Population of the region
• 8 Neutrals for every red agent

29
Modeled Alternatives
OR
OR
OR
Baseline Force: Composition3 Divisions of 4 SURCs (12 total)
(1) M 240G Medium machine gun (1) GAU 17 Electric powered gatling gun (1) .50 cal(1 per person) M -16
DispositionSURC employment
(1) C2 SURC(2) Force Protection SURC(1) SURC with 7 man VBSS team
ALT 1: Baseline + Sensors:Extend Sensor RangeEnable SURCs to bring superior firepower to bear at maximum range
ALT 2: Baseline + EngagementIncrease Engagement capability of RFGCE (2) 12 man assault force M-16 & Squad Automatic Weapon
ALT 3: Baseline + Network Sensors
Extend sensor range using networked sensors
ALT 4: Baseline + Network Sensors + Indirect Fire81mm MortarMortar Barge
ALT 5: Baseline + Dedicated Helo Support
(4) Helicopter detachment(4) Hellfire missiles(2) 7.62mm machine gun

30
LT Jen Free
Cost Estimation

31
Cost Estimation Caveats
• All cost data obtained from open source
• All costs in FY06$
• Cost estimation data is provided for comparison of alternatives
• Determining military significance is the goal
32
Procurement Cost Summary
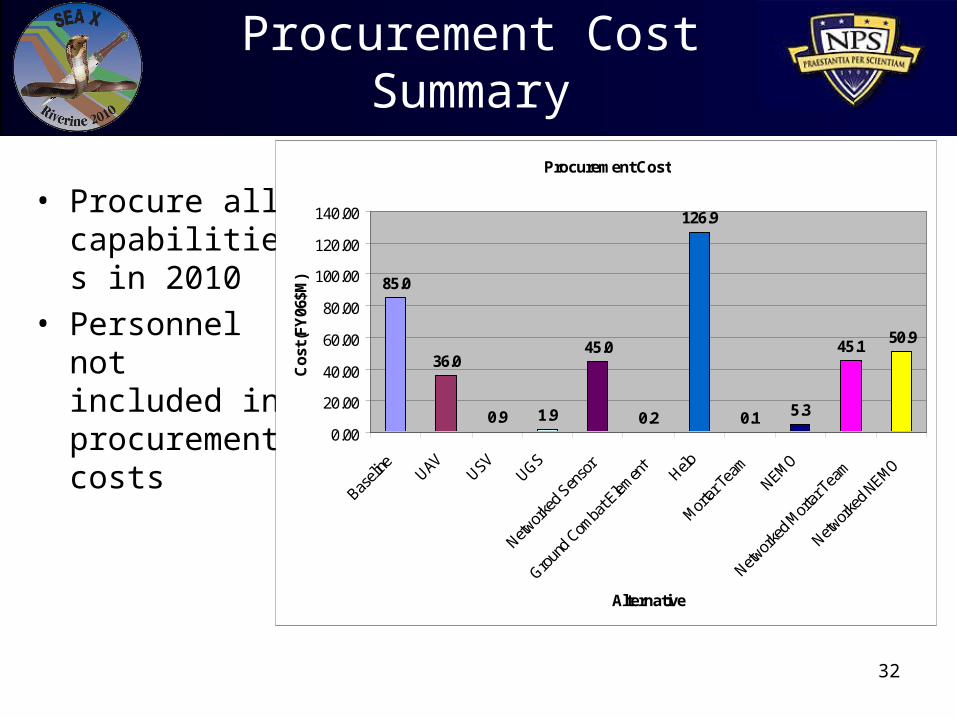
• Procure all capabilities in 2010
• Personnel not included in procurement costs
Procurement Cost
85.0
36.0
0.9 1.9
45.0
0.2
126.9
0.1 5.3
45.150.9
0.00
20.00
40.00
60.00
80.00
100.00
120.00
140.00
Baseli
ne UAV USV UGS
Networ
ked S
enso
r
Groun
d Com
bat E
lemen
tHelo
Mortar
Team
NEMO
Networ
ked M
ortar
Team
Networ
ked N
EMO
Alternative
Co
st (F
Y06
$M)

33
Total 10 Year Cost
• Includes procurement and O&S cost
• All alternatives are marginal to baseline
Total 10 Year Cost
263.5
78.3
3.8 8.0
90.8
8.0
169.7
42.8
1.217.3
92.1108.2
0.00
50.00
100.00
150.00
200.00
250.00
300.00
Alternative
Cos
t (FY
06$M
)
34
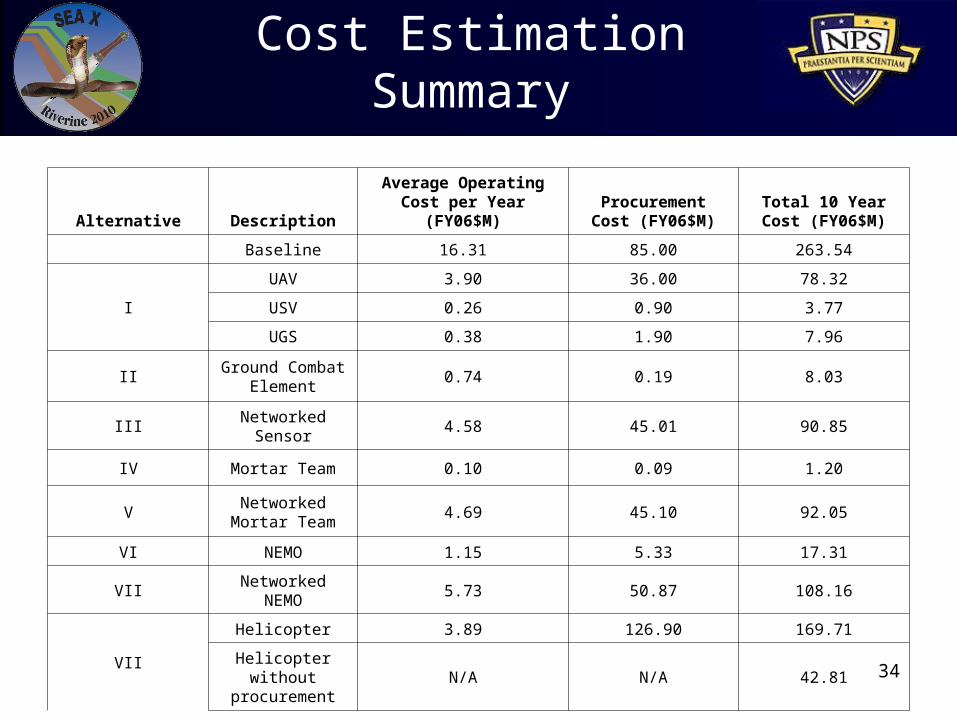
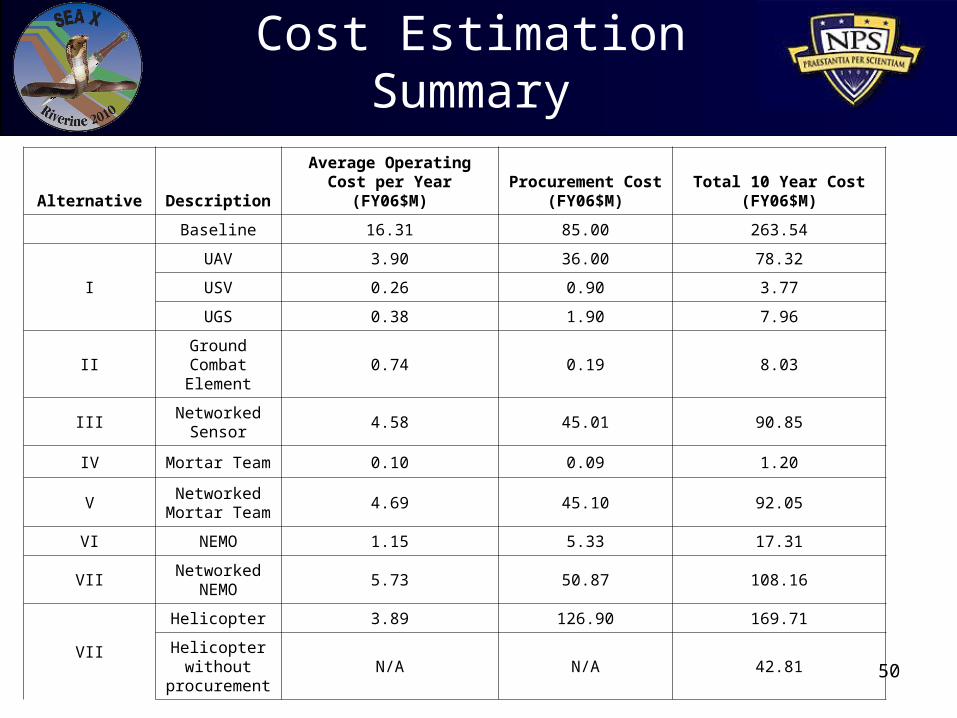
Cost Estimation Summary
Alternative DescriptionAverage Operating Cost
per Year (FY06$M)Procurement Cost
(FY06$M)Total 10 Year Cost
(FY06$M)
Baseline 16.31 85.00 263.54
I
UAV 3.90 36.00 78.32
USV 0.26 0.90 3.77
UGS 0.38 1.90 7.96
IIGround Combat
Element0.74 0.19 8.03
IIINetworked
Sensor4.58 45.01 90.85
IV Mortar Team 0.10 0.09 1.20
VNetworked Mortar
Team4.69 45.10 92.05
VI NEMO 1.15 5.33 17.31
VII Networked NEMO 5.73 50.87 108.16
VII
Helicopter 3.89 126.90 169.71
Helicopter without procurement
N/A N/A 42.81
35
LCDR Jim Beaver
Reliability
36
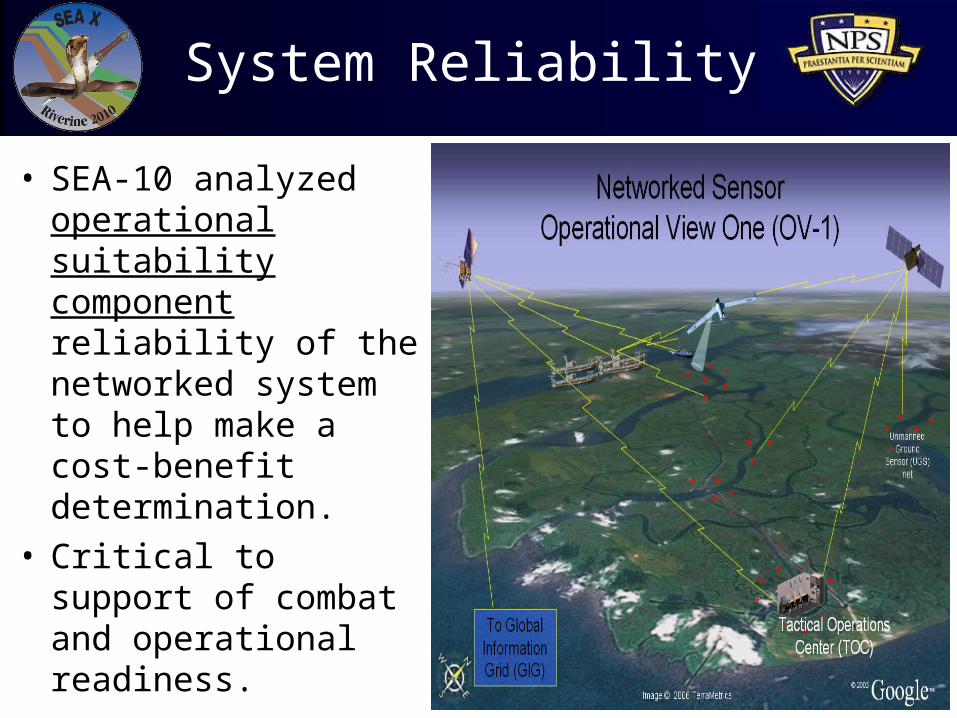
System Reliability
• SEA-10 analyzed operational suitability component reliability of the networked system to help make a cost-benefit determination.
• Critical to support of combat and operational readiness.

37
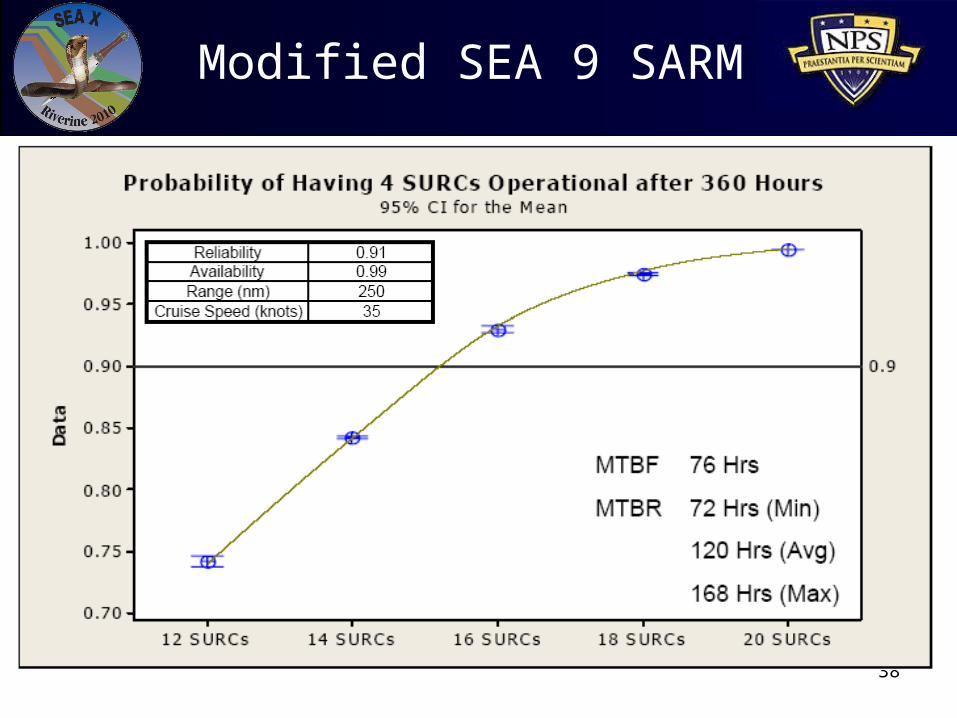
Availability and Readiness
• To demonstrate the connection between availability and readiness consider the following:– Assume SURC
availability is 0.85 or 85%.
– 4 SURCs are required to begin a mission.
• As the number of SURCs in a squadron is increased, the probability of having 4 or more SURCs available for the mission is increased.
38
Modified SEA 9 SARM

39
Reliability Conclusions and Limitations
• Unmanned systems MUST have redundancy to augment any low individual component reliability.
• Models for SURC reliability/availability show platform highly reliable, but more hulls needed for extended operations.

40
LCDR Pedro Mercado
Data Analysis
41
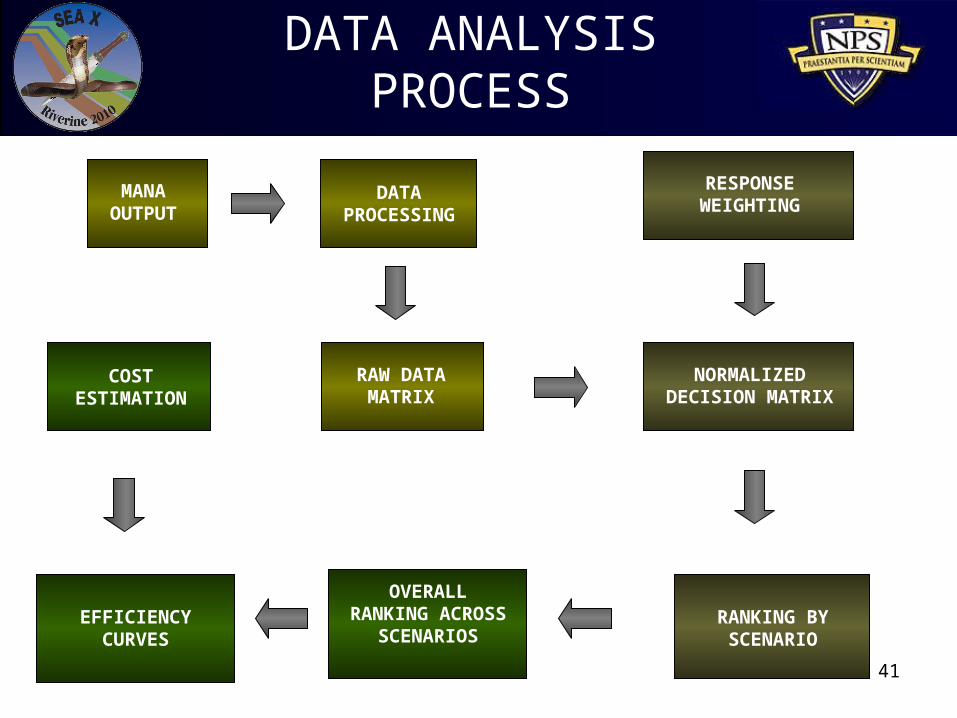
MANA OUTPUT
OVERALL RANKING ACROSS
SCENARIOS
RANKING BY SCENARIO
NORMALIZED DECISION MATRIX
RAW DATA MATRIX
DATA PROCESSING
DATA ANALYSIS PROCESS
RESPONSE WEIGHTING
EFFICIENCY CURVES
COST ESTIMATION
42
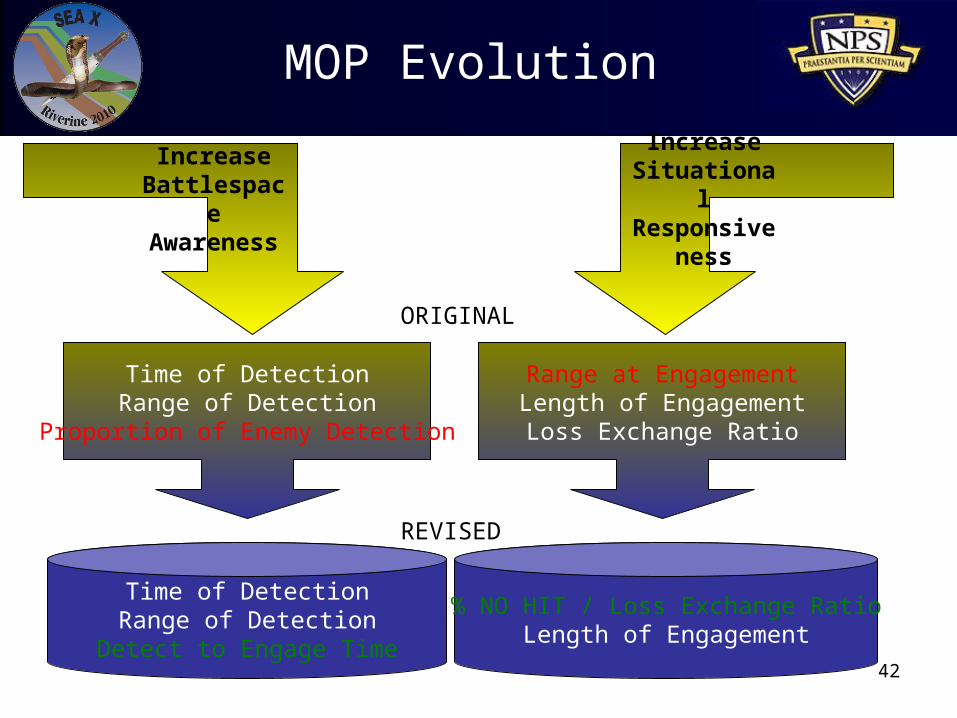
MOP Evolution
Increase Battlespace Awareness
Increase Situational Responsive
ness
Time of DetectionRange of Detection
Detect to Engage Time
% NO HIT / Loss Exchange RatioLength of Engagement
Time of DetectionRange of Detection
Proportion of Enemy Detection
Range at EngagementLength of EngagementLoss Exchange Ratio
ORIGINAL
REVISED

43
MOP Limitations
• Detect to engage time did not fairly represent the battle space awareness gained by the helicopter and networked mortar barge alternatives
• Length of engagement was affected by scenario and modeling limitations
• Detection Range was not a valid indicator of sensor performance and could not be used as a measure of performance

44
Raw Data Matrix
MOP Alternative
PERCENT OF NO HIT RUNS
LOSS EXCHANGE
RATIO (RED/BLUE)
LENGTH OF ENGAGEMENT
(IN MIN)
MAX CLASSIFICATION RANGE (GRIDS)
EARLIEST DETECTION
TIME (IN MIN)
TIME OF FIRST DETECTION TO FIRST
ENGAGEMENT (IN MIN)
Baseline 3% 8.9 3.5 19.6 56.8 0.0UAV 0% 12.1 21.5 17.9 26.0 20.0USV 3% 9.6 22.2 126.3 23.8 18.4UGS 0% 9.9 16.1 17.9 25.3 24.4UAV+USV+UGS 0% 11.1 10.6 125.7 21.5 23.9GCE 13% 10.7 4.3 19.9 50.6 0.0HH60 97% 7.7 9.2 154.8 21.1 0.0MORTAR TM 3% 8.4 2.2 19.3 41.1 0.0
MORTAR BARGE 7% 8.9 3.5 19.4 56.2 -0.2
NW MORTAR TM 3% 11.4 30.1 123.3 15.5 26.7
NW MORTAR BARGE 87% 11.8 12.7 123.1 23.6 1.9
PATROL
45
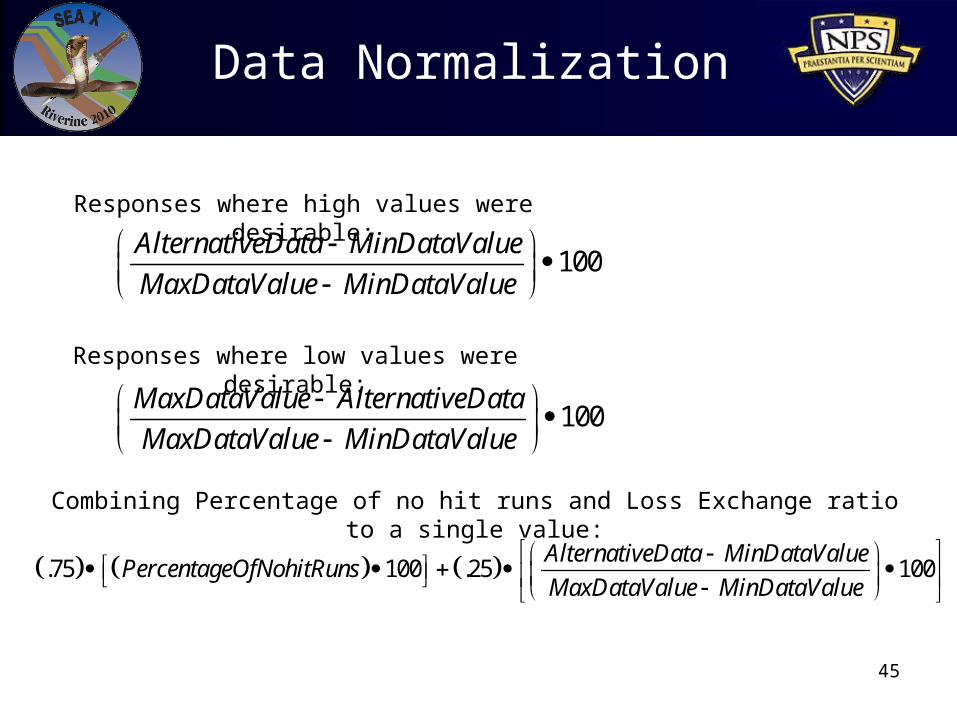
100AlternativeData MinDataValue
MaxDataValue MinDataValue
100MaxDataValue AlternativeData
MaxDataValue MinDataValue
.75 100 .25 100AlternativeData MinDataValue
PercentageOfNohitRunsMaxDataValue MinDataValue
Data Normalization
Responses where high values were desirable:
Responses where low values were desirable:
Combining Percentage of no hit runs and Loss Exchange ratio to a single value:
46
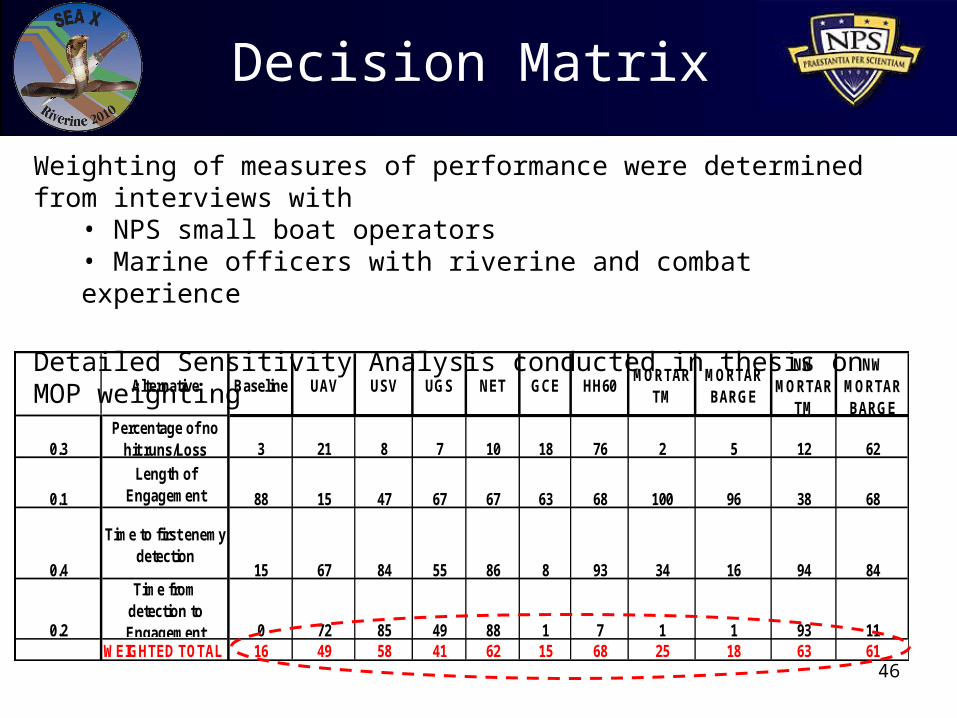
Decision Matrix
Alternative Baseline UAV USV UGS NET GCE HH60MORTAR
TMMORTAR BARGE
NW MORTAR
TM
NW MORTAR BARGE
0.3Percentage of no
hit runs/Loss 3 21 8 7 10 18 76 2 5 12 62
0.1
Length of Engagement 88 15 47 67 67 63 68 100 96 38 68
0.4
Time to first enemy detection
15 67 84 55 86 8 93 34 16 94 84
0.2
Time from detection to Engagement 0 72 85 49 88 1 7 1 1 93 11
WEIGHTED TOTAL 16 49 58 41 62 15 68 25 18 63 61
Weighting of measures of performance were determined from interviews with
• NPS small boat operators• Marine officers with riverine and combat experience
Detailed Sensitivity Analysis conducted in thesis on MOP weighting

47
Architecture Ranking Patrol
PATROL ARCHITECTURE RANKING
11
5552
57
65
23
63
26
13
67 66
0
10
20
30
40
50
60
70
80
UTIL
ITY
SCO
RE
48
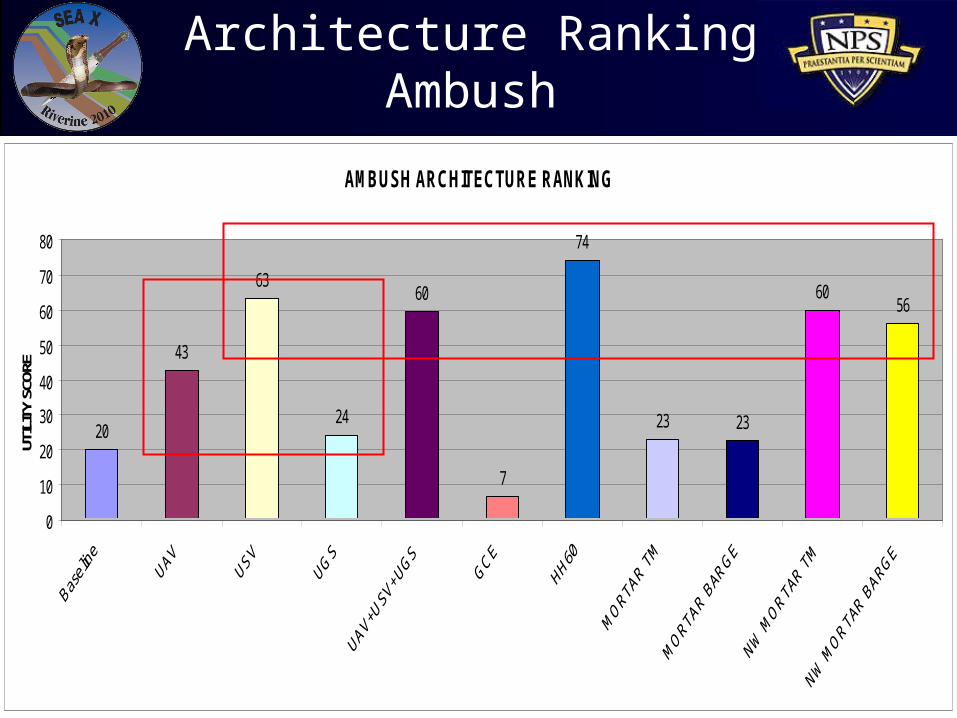
Architecture RankingAmbush
AMBUSH ARCHITECTURE RANKING
20
43
63
24
60
7
74
23 23
6056
0
10
20
30
40
50
60
70
80
UTIL
ITY
SCOR
E
49
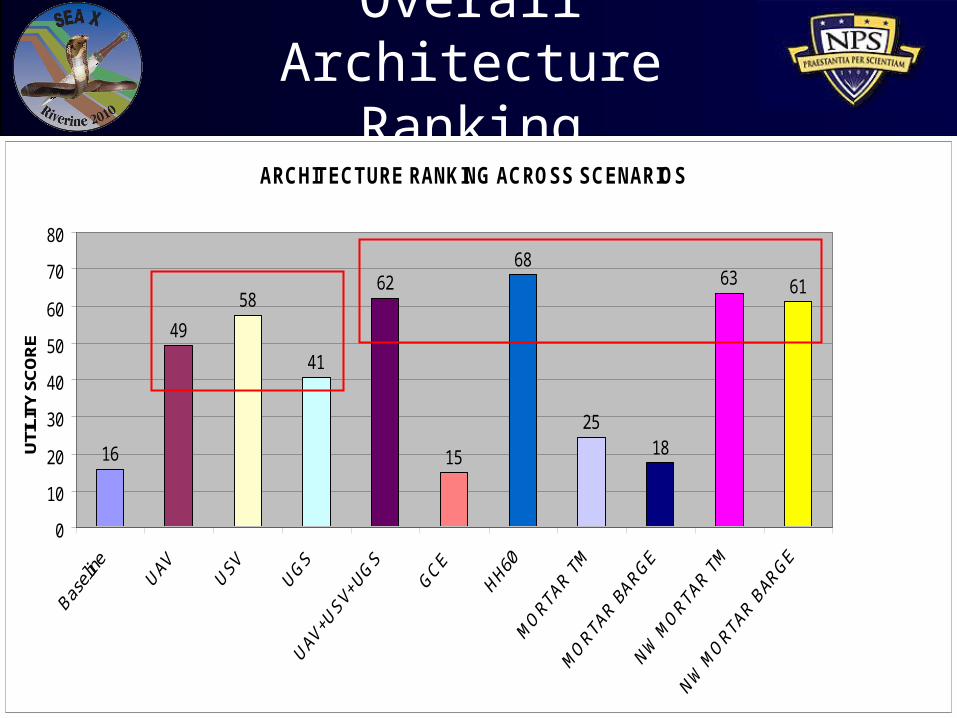
Overall Architecture Ranking
ARCHITECTURE RANKING ACROSS SCENARIOS
16
49
58
41
62
15
68
2518
63 61
0
10
20
30
40
50
60
70
80
UTI
LITY
SC
OR
E
50
Cost Estimation Summary
Alternative DescriptionAverage Operating Cost
per Year (FY06$M)Procurement Cost
(FY06$M)Total 10 Year Cost
(FY06$M)
Baseline 16.31 85.00 263.54
I
UAV 3.90 36.00 78.32
USV 0.26 0.90 3.77
UGS 0.38 1.90 7.96
IIGround Combat Element
0.74 0.19 8.03
IIINetworked
Sensor4.58 45.01 90.85
IV Mortar Team 0.10 0.09 1.20
VNetworked
Mortar Team4.69 45.10 92.05
VI NEMO 1.15 5.33 17.31
VIINetworked
NEMO5.73 50.87 108.16
VII
Helicopter 3.89 126.90 169.71
Helicopter without
procurementN/A N/A 42.81

51
PATROL EFFICIENCY CURVE
UAVUSV
GCE
HH60
MORTAR TM
MORTAR BARGE
NW MORTAR BARGE
Baseline
UGS NET
NW MORTAR TM
0
10
20
30
40
50
60
70
80
$250 $270 $290 $310 $330 $350 $370 $390 $410 $430 $450
10 YEAR TOTAL OPERATING COST FY06M$
TOTA
L U
TILI
TY S
CO
RE
Baseline UAV USV UGS NET GCE HH60 MORTAR TM MORTAR BARGE NW MORTAR TM NW MORTAR BARGE
Patrol Efficiency Curve
52
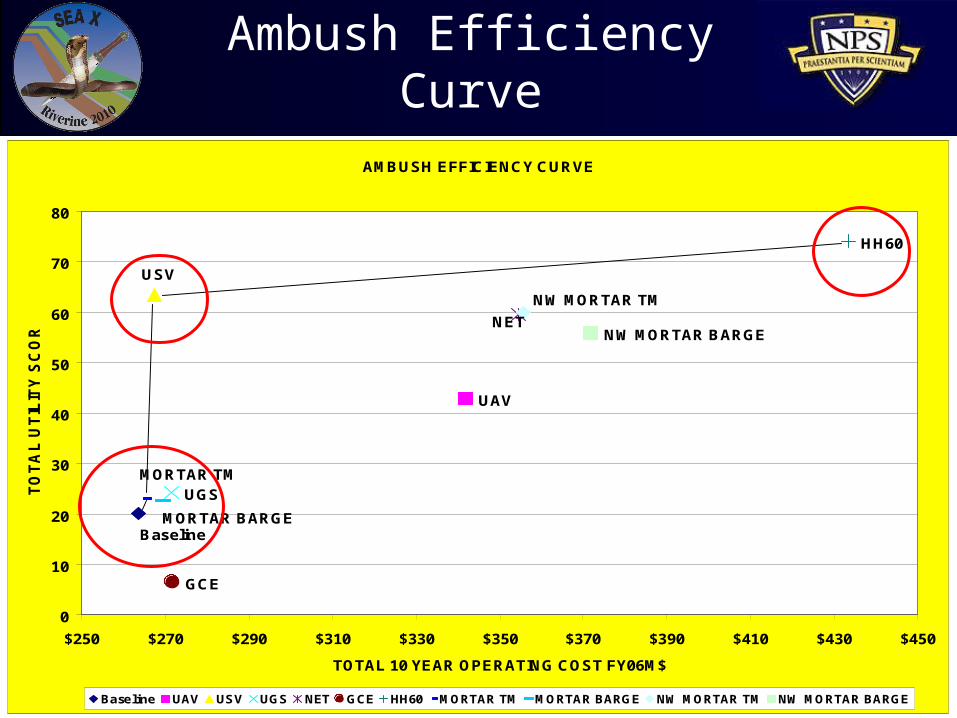
AMBUSH EFFICIENCY CURVE
UAV
UGS
GCE
HH60
NW MORTAR BARGE
Baseline
USV
NET
MORTAR TM
MORTAR BARGE
NW MORTAR TM
0
10
20
30
40
50
60
70
80
$250 $270 $290 $310 $330 $350 $370 $390 $410 $430 $450
TOTAL 10 YEAR OPERATING COST FY06M$
TO
TA
L U
TIL
ITY
SC
OR
E
Baseline UAV USV UGS NET GCE HH60 MORTAR TM MORTAR BARGE NW MORTAR TM NW MORTAR BARGE
Ambush Efficiency Curve
53
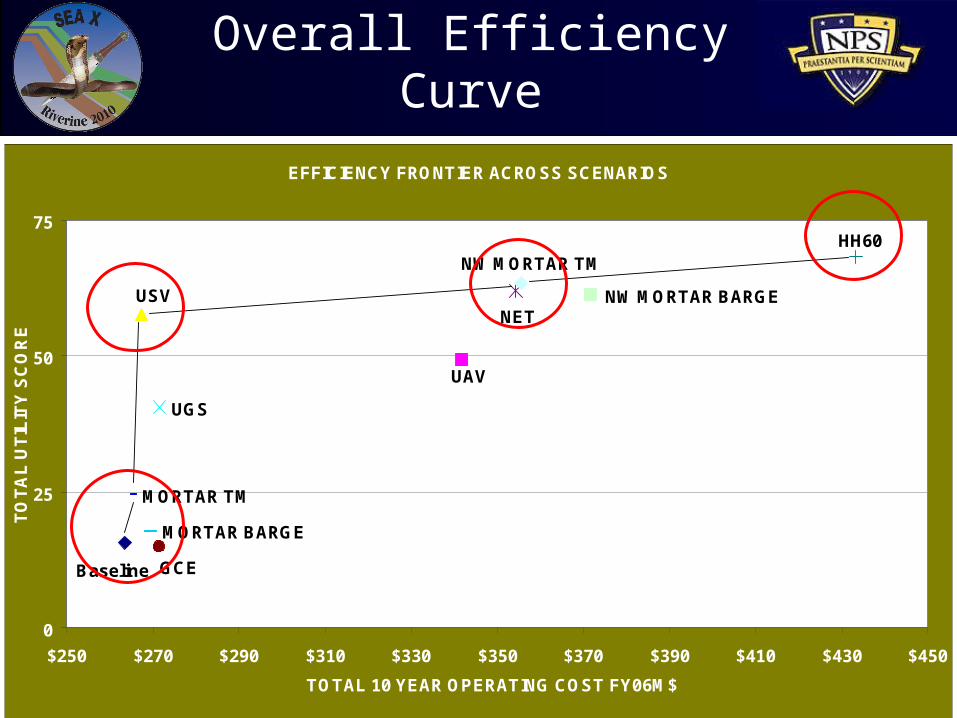
EFFICIENCY FRONTIER ACROSS SCENARIOS
MORTAR TM
Baseline
UAV
USV
UGS
NET
GCE
HH60
MORTAR BARGE
NW MORTAR TM
NW MORTAR BARGE
0
25
50
75
$250 $270 $290 $310 $330 $350 $370 $390 $410 $430 $450
TOTAL 10 YEAR OPERATING COST FY06M$
TO
TA
L U
TIL
ITY
SC
OR
E
Overall Efficiency Curve

54
Results
• “Most bang for the buck”– USV
• Alternatives– HH-60 and Networked NEMO best overall
• Unmanned systems– Single is as good as networked
• Organic indirect fires– Effective only when paired with sensors
• Ground combat element – Scenario dependent performance
• Dedicated helicopter support– Best performance/highest cost
55
Other Findings
• The baseline force occasionally achieves parity in performance with upgraded alternatives depending on the response and scenario.
• A single sensor gives the baseline force almost all the benefits of networked sensors.
• In the ambush scenario, upgraded weapons have a significant effect in reducing the length of engagement.
• The combined indirect fire and sensor pairing of the networked mortar barge and the helicopter option dominated all other options across all responses except detect to engage time (only because of model dynamics described previously).
56
Results
• Consider Unmanned Surface Vehicle as a system that shows potential to improve RF battle space awareness
• Invest in paired sensor and weapon augmentations for the greatest increase in performance
• A helicopter or networked sensor plus indirect fire option consistently outperforms other alternatives
57
Areas for Further Study
• Sustainment/Logistics• Communications• Modeling and Simulation• Energy• Movement• Force Protection• Mine Countermeasure• Policy
58
Softballs for SEA-11
• Sustainment/logistics
• Columbia riverine science symposium– MIT infrared study– China Lake infrared working group
• USV automation
• Unmanned system reliability analysis

59
Key Source Documents
• Buede, D.M. The Engineering Design of Systems: Models and Methods, John Wiley & Sons, Inc., 2000.
• Naval Expeditionary Combat Command, Concept of Operations - US Navy Riverine Force (DRAFT), 30 August 2006, Naval Amphibious Base, Little Creek, VA.
• US Marine Corps Center for Lessons Learned: Small Craft Company’s Deployment in Support of Operation Iraqi Freedom II (OIF II) by Colonel M.E. Dunard, 4 April 2006.
• Others.
60
61
BACKUP