Embed Size (px)
Citation preview

1
Estimating Key Parametersfor the Retail Plug-Load Portfolio (RPP) Program:
Recommended Methodological Approaches
EM&V, Residential Programs, Products and Channel Teams
October 23, 2014
Residential PLA Program
2
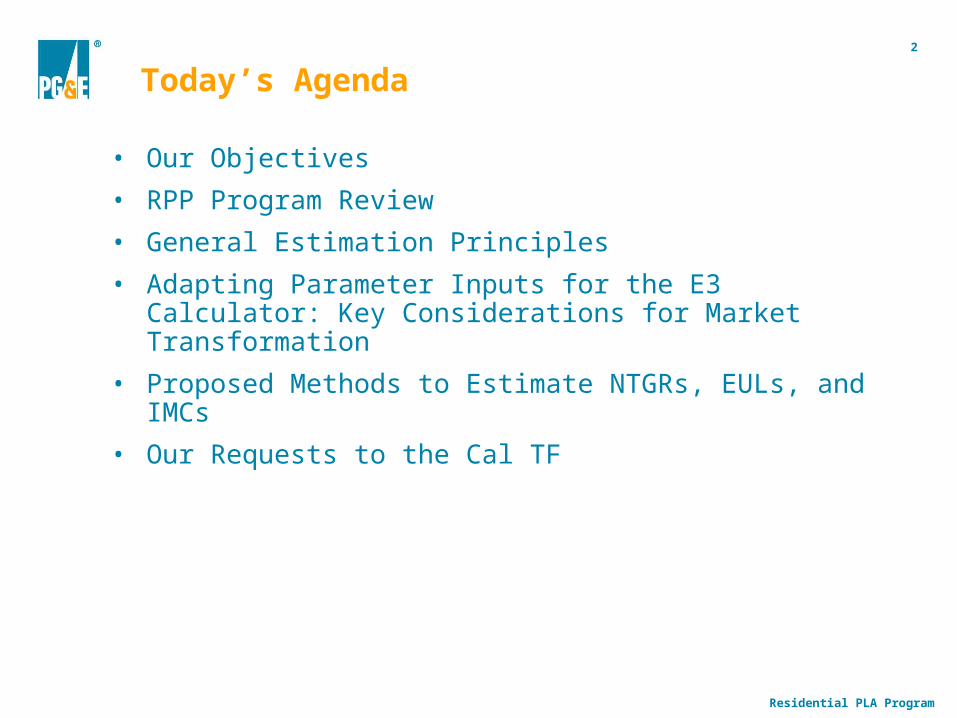
Today’s Agenda
• Our Objectives
• RPP Program Review
• General Estimation Principles
• Adapting Parameter Inputs for the E3 Calculator: Key Considerations for Market Transformation
• Proposed Methods to Estimate NTGRs, EULs, and IMCs
• Our Requests to the Cal TF
Residential PLA Program
3
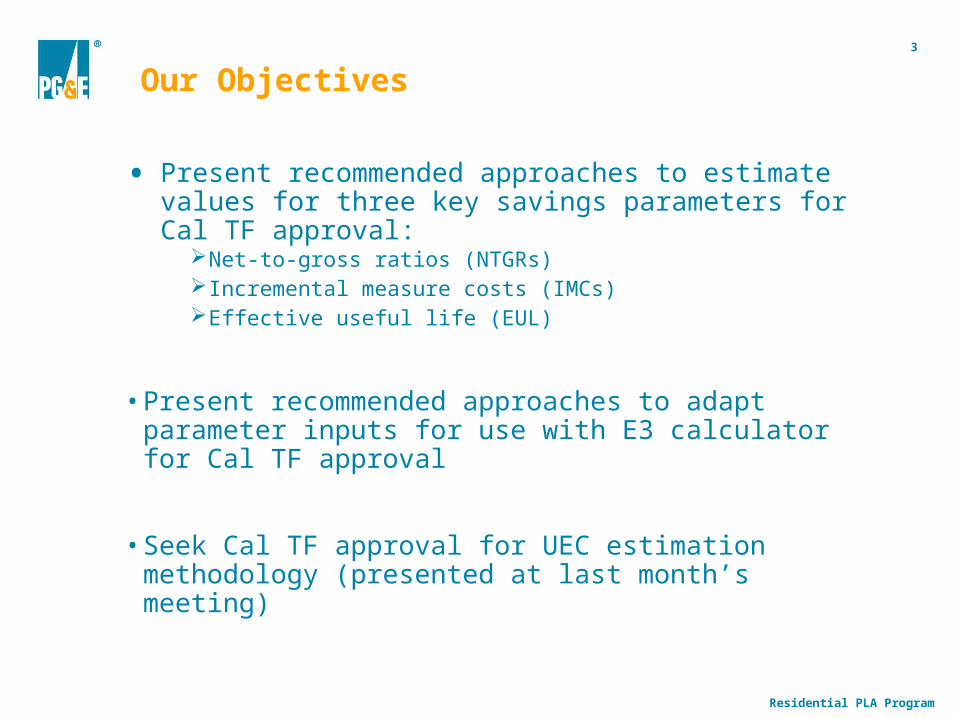
Our Objectives
• Present recommended approaches to estimate values for three key savings parameters for Cal TF approval:
Net-to-gross ratios (NTGRs)Incremental measure costs (IMCs)Effective useful life (EUL)
• Present recommended approaches to adapt parameter inputs for use with E3 calculator for Cal TF approval
• Seek Cal TF approval for UEC estimation methodology (presented at last month’s meeting)
Residential PLA Program
4
RPP Program Review
• Program Approach:• Utilize retailer engagement to increase the demand and supply of more
energy efficient appliance and consumer electronic products
• Measures: • RPP offers a portfolio of consumer energy efficiency measures that are
delivered through the retail channel partners
• Incentive Structure:• Incentives are paid to participating retailers for each program-qualified
product sold.
• Evaluation Framework:• While this mid-stream program is primarily a market transformation
program, it contains elements of a resource acquisition program.

Residential PLA Program
5
RPP Logic Model
Activities
Outputs
Short-Term Outcomes
Mid-Term Outcomes
Long-Term Outcomes
External Influences: Broad economic conditions, m
arket events, cost of energy, federal standards, Energy Star, perceived need for conservation, etc. Factors can influence program
at all levels and time fram
es.
F. PG&E and partner utilities approve retailer plans to reduce energy profile
F. PG&E and partner utilities approve retailer plans to reduce energy profile
G. Retailers implement plan employing various strategies, e.g., changes in product assortment, increase promotion, sales force education, reduce price and update as necessary.
A. PG&E contacts utility partners regarding collaboration in Program delivery
D. PG&E, utility partners and identified retailers target product categories with energy savings potential.
D. PG&E, utility partners and identified retailers target product categories with energy savings potential.
H. Reduction in customer market
barriers
B. Utility partners recruited
T. PG&E and utility partners provide data and stakeholder support regarding targeted product categories to the Energy Star and Code and Standards Programs
R. Permanent change in the availability of more energy efficient products among participating and nonparticipating retailers
R. Permanent change in the availability of more energy efficient products among participating and nonparticipating retailers
P. Increased demand experienced by manufacturers for more efficient products
P. Increased demand experienced by manufacturers for more efficient products
J. Energy and demand savings in PG&E and partner utility service territories
V. More stringent mandatory and voluntary standardsV. More stringent mandatory and voluntary standards
27
20
I. Customers purchase more energy efficient products
M. Reduction in the SWUEC for target product categories among participating retailers in PG&E and utility partner service territories.
M. Reduction in the SWUEC for target product categories among participating retailers in PG&E and utility partner service territories.
W. Long-term energy and demand savings
W. Long-term energy and demand savings
18
25
Q. Manufacturers increase production of the efficient models
Q. Manufacturers increase production of the efficient models
21
N. Reduction in the SWUEC for target product categories among nonparticipating stores
N. Reduction in the SWUEC for target product categories among nonparticipating stores
19
16
10
9
15
K. Environmental and other non-energy benefits
12
U. PG&E and utility partners participate in C&S and Energy Star meetings to support more stringent mandatory and voluntary standards
26
X. Long-term environmental and non-energy benefits
X. Long-term environmental and non-energy benefits
28
C. PG&E and utility partners determine which retailers to recruit
C. PG&E and utility partners determine which retailers to recruit
8
1
3
42
6
S. Decrease in SWUEC and increase in market share of EE measures & Environmental & Other Non-Energy Benefits
S. Decrease in SWUEC and increase in market share of EE measures & Environmental & Other Non-Energy Benefits
22 23
L. Retailers receive incentives from PG&E and utility partners
L. Retailers receive incentives from PG&E and utility partners
1124
13
E. Utilities, partner utilities and selected retailers negotiate incentive levels for reducing the energy profile for target product categories and sign contracts
E. Utilities, partner utilities and selected retailers negotiate incentive levels for reducing the energy profile for target product categories and sign contracts
5
7
14
O. Increased retailer engagement
17

Residential PLA Program
6
General Estimation Principles
For products in DEER:• Use EUL and IMC values found in DEER
For products NOT in DEER:• Use best available data for EUL and IMC estimates.
NTGRs for resource acquisition programs:• DEER values reflect 3-5 year timeframes, and are applicable to
downstream resource acquisition programs.
NTGRs for market transformation programs:• DEER values are not applicable, NTGRs must be derived through other
methods that involve long-term forecasting.
Residential PLA Program
7Adapting Inputs for the E3 Calculator: Market Transformation Considerations
• Gross Savings:• The total of the stream of savings for all of the measures adoption
forecasted over the projected initiative term times each measure’s EUL.
• TRC costs:• Input the stream of administrative and incremental measure costs that
match the time frame of the savings impacts.
• NTG Inputs:• Use the ratio of forecast total market change minus the forecast of the
baseline changes divided by the total market change for the same time period used for both the costs and savings.

Residential PLA Program
8
Net-to-Gross Ratios (NTGRs)
• NTGRs represent net program load impacts divided by gross program load impacts.
• NTGR is sometimes used to convert gross measure costs to net measure costs.
• The relationship between program-driven and naturally-occurring adoptions evolves over the life of the program.
• This dynamic must be captured and entered into the B/C calculator.
-
0.10
0.20
0.30
0.40
0.50
0.60
0.70
0.80
0.90
1 2 3 4 5 6 7 8 9 10 11 12 13 14 15 16 17 18 19 20 21 22
RPP
Sha
re
Years
Without
With
Hypothetical example
Residential PLA Program
9
NTGRs: Our Recommendation
• Preferred: Estimate NTGRs over time using an analogic diffusion model
For each product category, long-term forecasts over the life of the RPP Program can be used
Scenarios (using the Bass diffusion model) with and without the RPP Program can be forecasted over the life of the program
The resulting differences in these two scenarios represent the expected net impacts of the RPP
The net impacts divided by the gross impacts yield the NTGRs
• Alternative: Use a Delphi panel
• Ideal but costly: Combine the two

Residential PLA Program
10
Incremental Measure Cost (IMC)
• Incremental measure cost is defined as the difference in the cost of an efficient measure and a baseline measure attributable to the difference in efficiency.
• Methods must be developed to capture the fact that IMCs decline over the life of the program
• Historical trends of IMCs—traditionally observed to decline over time—will be reviewed for measures with characteristics similar to those in the RPP suite (e.g., CFLs, DVD-Rs, transistor radios, desktop PCs, laptop PCs, lower-volume laser printers, and multi-function devices).
• Declining IMCs must be entered into the B/C calculator over the life of the program.
Residential PLA Program
11
Using Webcrawlers to obtain IMC information
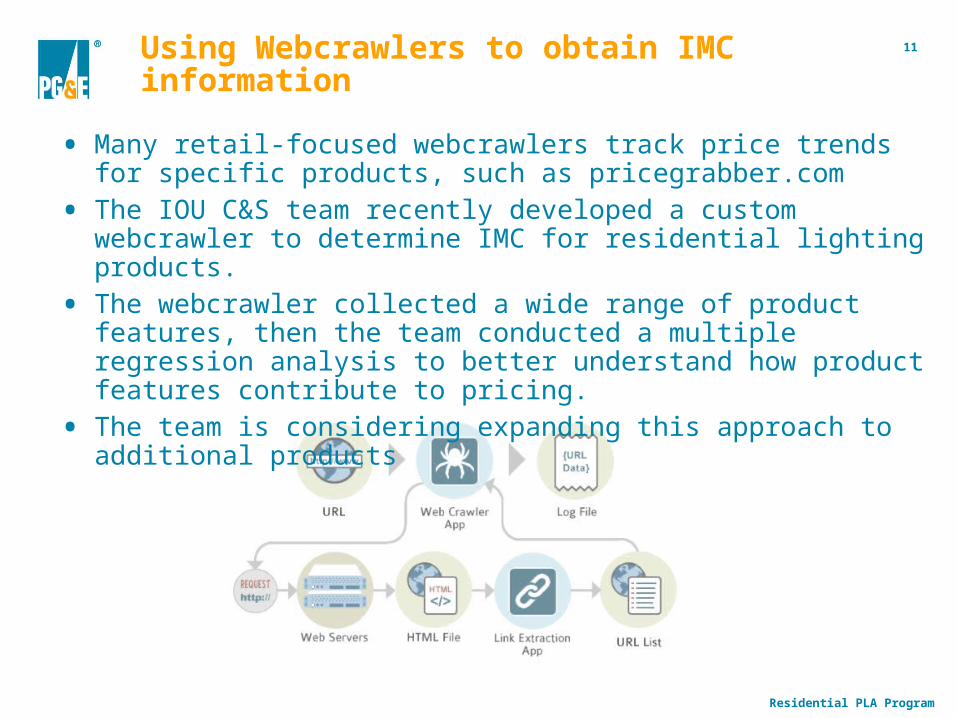
• Many retail-focused webcrawlers track price trends for specific products, such as pricegrabber.com
• The IOU C&S team recently developed a custom webcrawler to determine IMC for residential lighting products.
• The webcrawler collected a wide range of product features, then the team conducted a multiple regression analysis to better understand how product features contribute to pricing.
• The team is considering expanding this approach to additional products

Residential PLA Program
12
IMCs: Our Recommendation
• We recommend using webcrawlers to estimate IMC. For each product, we would identify key product features, including retail
price and Energy Star qualification status. Using these data, we could then develop a regression analysis to estimate
the incremental cost of an energy efficient product (hedonic price models) Data collection can be easily replicated to identify changes over time.
• Retailer price data also holds promise. Price data provided by retailers for each model sold along with key product
characteristics could be used to estimate the IMC using hedonic price models
• Targeted in-store shelf surveys While they have very limited value, given that the RPP is based on a
dynamic product mix that is expected to change over time, they can be used to selectively calibrate webcrawler results.
Residential PLA Program
13
Effective Useful Life (EUL)
• The effective useful life is an estimate of the median number of years that a measure installed under a program is still in place and operable.
• While EULs could conceivably change over the over the life of the program, such changes might be difficult and costly to track reliably.
• Consistent with retention and persistence studies, the focus of RPP EUL estimates is to estimate the effective useful life for installed equipment, since this is what is producing program-generated savings.
Residential PLA Program
14
EULs: Our Recommendation
• First choice: Use available research data For products that are federally-regulated, EUL should be based on
research data used in the standards proceeding. Where this is not a federal standard, we will use best available research
(e.g., EPA, manufacturers or other research).
• Delphi panel Use a formal consensus approach for generating EUL estimates from a
group of experts.
• Ideal but more costly: Combine available research data and Delphi panel.
Residential PLA Program
15
Our Requests to the Cal TF
• Do you agree with our recommended approaches to estimating these three parameters?
• Would you like any additional information about the proposed estimation approaches?
• Do you have any changes you would recommend to our proposed methods?
• Are there any additional approaches that you could recommend?
• Do you have suggestions about how to input parameter estimates into the E3 calculator?

Residential PLA Program
16
Next Steps
• Approval of the UEC methodology
• Approval of methodologies for estimating key parameters
• RPP work paper draft review
• Review of parameter estimates
• RPP work paper approval

17
Questions?