Embed Size (px)
Citation preview

1
Environmental Boundaries
"Climate change" is one of several environmental processes with the potential to critically impact our way of life.
There are some environmental boundaries that shouldn’t be crossed. Whether we have or don’t know if we have, we still need to choose a course to steer.

2
Environmental Boundaries
STAKEHOLDER INFLUENCE
REGULATORY FRAMEWORK
COMPANY POLICIES
What’s out here?

Strategic Vision for 2020: Operating within Environmental Boundaries
4
Environmental Boundaries

5
Environmental Boundaries
New millenium arrives
Anthropocene Age begins

6
Environmental Boundaries
Climate Change?....
Sounds bad. But, what does it mean to me?
7
Environmental Boundaries
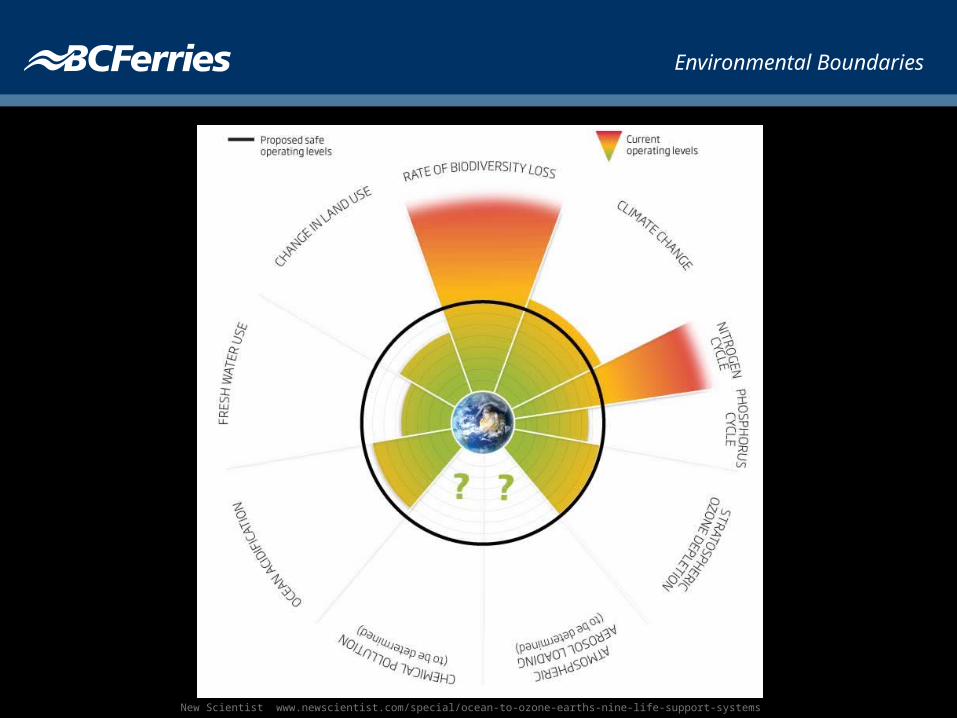
New Scientist www.newscientist.com/special/ocean-to-ozone-earths-nine-life-support-systems

8
Environmental Boundaries
Ozone Depletion
Aerosol Loading
Climate Change
Chemical Dispersion
Biodiversity Loss
Land Use
Fresh Water Use
Nitrogen/Phosphorus
Ocean Acidification
283
Boundary
< 276 Dobson units
TBD
387 > 350 CO2 ppm
TBD
>100 10 species pmper year
11.7 15 per cent cropland
2,600 4,000 km3/year
Nitrogen 133 39 M tonnes/year
Phosphorus 10 12 M tonnes/year
< 2.75 Ω units 2.90
Scientific American Magazine March 19, 2010

9
Environmental Boundaries
Ozone Depletion
Aerosol Loading
Climate Change
Chemical Dispersion
Biodiversity Loss
Land Use
Fresh Water Use
Nitrogen/Phosphorus
Ocean Acidification
REGULATORY FRAMEWORK
COMPANY POLICIES
10
Environmental Boundaries
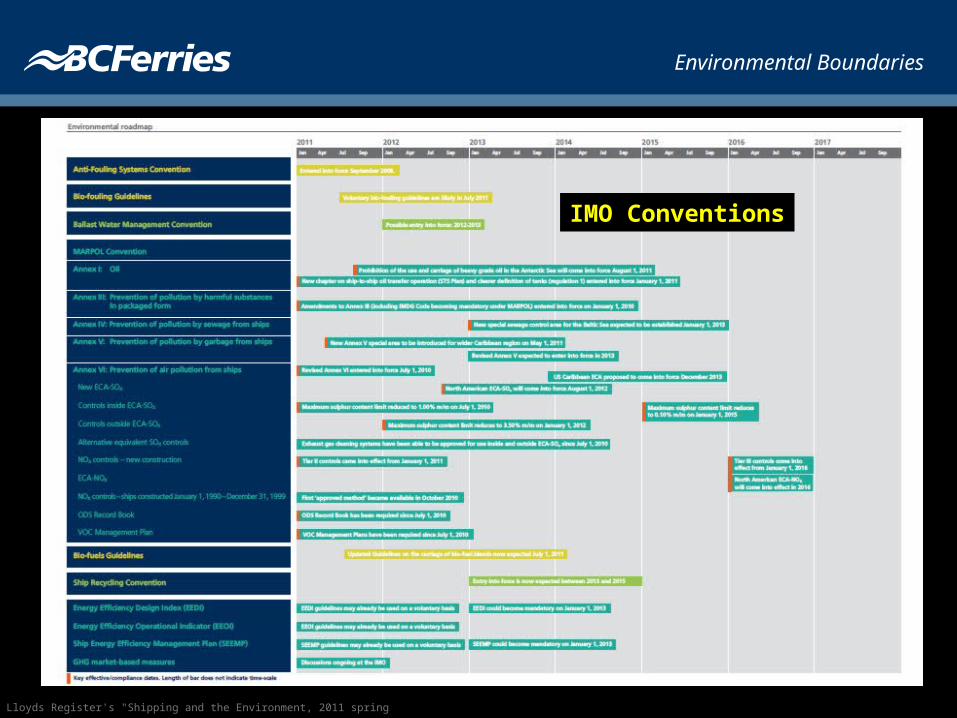
IMO Conventions
Lloyds Register's "Shipping and the Environment, 2011 spring

11
Environmental Boundaries
Are we doomed?....
What can we do?
100,000 years
10 -15 years strategic planning

12
Environmental Boundaries
Ozone Depletion
Aerosol Loading
Climate Change
Chemical Dispersion
Biodiversity Loss
Land/Water Use
Fresh Water Use
Nitrogen/Phosphorus
Ocean Acidification
STAKEHOLDER INITIATIVES
COMPANY POLICIES
ASSESSENGAGEMONITOR

13
Environmental Boundaries
Going to the chalk board…

14
Environmental Boundaries
THE PROCESSCAUSE (our contribution) EFFECTS
In what way might our operations be contributing to the problem?
Glo
bal
What changes are expected on a planetary scale?
Regio
nal
What impact might we see in our operating region?
Ranking: LOW, MODERATE, HIGH What priority does this process need to be given in our business planning?

15
Environmental Boundaries
About cause and effect relationships…
INPUTS OUTPUTSPROCESS
Causes Effects
INPUTS OUTPUTSPROCESS
Causes Effects
Actions or Conditions
Land Use
Biodiversity
Climate ChangeOcean AcidificationChemical Dispersion
A
B

16
Environmental Boundaries
One bite at a time…

17
Environmental Boundaries
BIODIVERSITY
CAUSE (our contribution) EFFECTS
damage to habitats (not necessarily destruction but the intrusions that disrupt species comfort) introduction of invasive species without local predators
Glo
bal
loss of species threat to food chains loss of food and pharmaceutical sources
Regio
nal
loss of species important to the ecology, industry, and tourism pest infestations (expansion of less favourable species)
Ranking: LOW - substantial regulatory regimes already in place regionally; only a modest impact on the established business

18
Environmental Boundaries
#1 - Even a child can understand it…

19
Environmental Boundaries
OZONE DEPLETION
CAUSE (our contribution) EFFECTS
Release of CFCs, HCFCs from refrigerated equipment, fire suppression, solvents
Glo
bal
increase in UV-B radiation skin cancer damage to crops damage to marine phytoplankton ozone hole over Antarctica largest in 2006 40% reduction over the Arctic this year
Regio
nal
Ranking: MODERATE - potential for regulatory agenda to be advanced

20
Environmental Boundaries
2. Public health costs…

21
Environmental Boundaries
LAND USE ~ MARINE HABITAT USE
CAUSE (our contribution) EFFECTS
food consumption (harvesting of food sources requiring large land or marine habitats for production) food waste (inefficient and over consumption) development to accommodate transportation needs of growing populations
Glo
bal
forests, wetlands and other vegetation types are converted primarily to agricultural land negative impact on biodiversity shifting vapour flows (hydrological cycle)
Regio
nal
potential use conflicts over land and marine habitats potential boundary conflicts over the encroachment of food production into previously open operating areas.
Ranking: MODERATE - large operational footprint; service expansion over 50 years into some locations with high potential for industrial food production (marine habitat)

22
Environmental Boundaries
3. Local solutions

23
Environmental Boundaries
FRESHWATER USE (and Hydrological Cycle)
CAUSE (our contribution) EFFECTS
domestic/hotel service consumption industrial consumption
Glo
bal
global-scale river flow change large human populations suffering health stress from insufficient water impact on biodiversity
Regio
nal
water shortage (specific concerns in Gulf Islands) increased cost of water resource increased cost of drinking water higher risk of drinking water contamination when sources are drawn down (e.g., arsenic, salt/brackish water)
Ranking: HIGH - freshwater consumption is not currently managed ashore or on vessels

24
Environmental Boundaries
4. Resilience (toughness) over sustainability
25
Environmental Boundaries
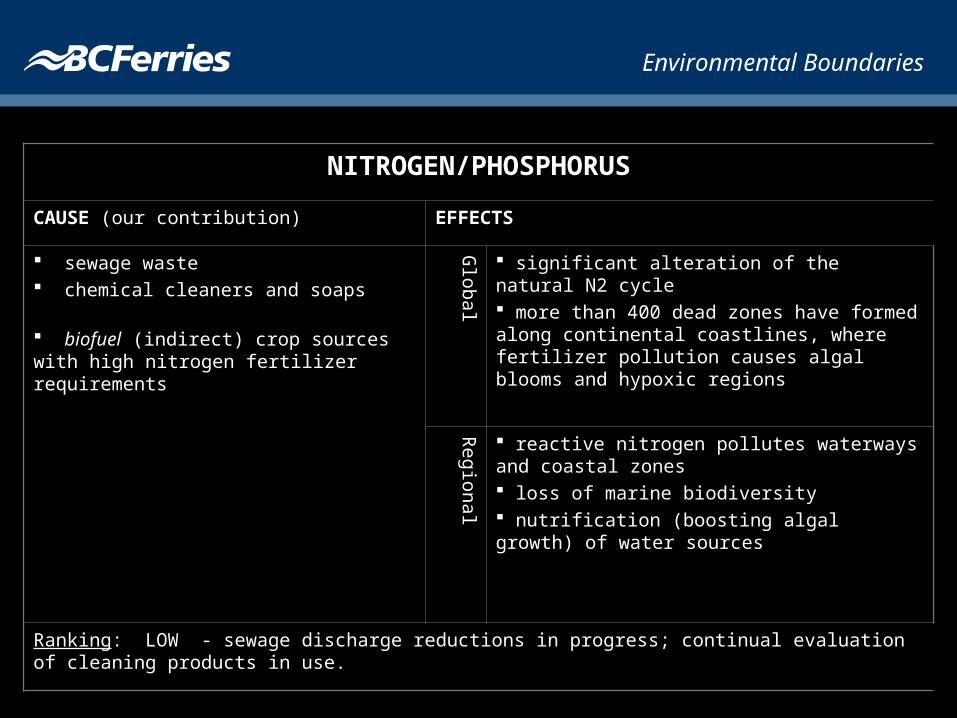
NITROGEN/PHOSPHORUS
CAUSE (our contribution) EFFECTS
sewage waste chemical cleaners and soaps
biofuel (indirect) crop sources with high nitrogen fertilizer requirements
Glo
bal
significant alteration of the natural N2 cycle more than 400 dead zones have formed along continental coastlines, where fertilizer pollution causes algal blooms and hypoxic regions
Regio
nal
reactive nitrogen pollutes waterways and coastal zones loss of marine biodiversity nutrification (boosting algal growth) of water sources
Ranking: LOW - sewage discharge reductions in progress; continual evaluation of cleaning products in use.

26
Environmental Boundaries
OCEAN ACIDIFICATION
CAUSE (our contribution) EFFECTS
CO2 emissions into atmosphere dissolve into the ocean creating carbonic acid:
fossil fuel combustion use of energy derived from a carbon emitting process decomposition in land fills
Glo
bal
damages shell and skeleton formation in organisms such as corals, and some shellfish and plankton species change ocean ecology and potentially lead to drastic reductions in fish stocks
Regio
nal
potential for very large change in marine ecosystems potential loss of species important to food industry, and tourism
Ranking: MODERATE - significant contributer with only limited regulation; North American “Emissions Control Area” pending (2012).

27
Environmental Boundaries
CLIMATE CHANGE
CAUSE (our contribution) EFFECTS
Greenhouse gas (carbon) emissions into the atmosphere:
fossil fuel combustion use of energy derived from a carbon emitting process decomposition in land fills
Glo
bal
increase in average global temperatures loss of fresh water from polar and glacial ice masses increase in sea level
Regio
nal
change in weather patterns (e.g., persistent fog in operating region) potentially greater extremes in weather potential shoreline erosion that can undermine terminal infrastructure
association with human health issues related to air quality
Ranking: HIGH - significant contributer with only limited regulation; regional effects can have direct impact on the continuity of operations; changes required to infrastructure

28
Environmental Boundaries
AEROSOL LOADING
CAUSE (our contribution) EFFECTS
Particulate emissions
engine emissions (vessels and vehicles)
Glo
bal
impact on global climate systems (e.g., monsoon circulation systems) global warming and “dimming”
Note: having no particulates in the atmosphere is also bad – acts as a protective shield and enables cloud formation.
Regio
nal
human health impact in the local airshed potential effect on local weather from global climate systems
Ranking: MODERATE - stop/go, idling and manoevering are unavoidable for our vessels and for our vehicular traffic; limited regulation; high concern to local populations

29
Environmental Boundaries
CHEMICAL POLLUTION
CAUSE (our contribution) EFFECTS
loss of chemical containment toxic compounds such as metals various organic compounds industrial processes (e.g., ship repair) material disposal vessel disposal
Glo
bal
organism uptake and accumulation to sub-lethal levels increasingly cause a dramatic reduction of marine mammal and bird populations reduced fertility potential of permanent genetic damage
Regio
nal
impact on local biodiversity
Ranking: HIGH - most of the high contribution sources are beyond direct control but can be attributed to our business; potential high costs; boundaries remain undefined

30
Environmental Boundaries

31
Environmental Boundaries
What do we do? Where do we take it from here?
OPERATING within the BOUNDARIES

32
Environmental Boundaries
SUSTAINABILITYRESILIENCE
Now Future
STRATEGY DEVELOPMENT

33
Environmental Strategies
BOUNDARY RANK STRATEGY
Climate Change High A. Stakeholder – permanent engagement with leading NGO’s (review and TBD)
B. Regulatory – continuous monitoring of developments in local and foreign jurisdictions
C. Managementi) metrics development for business activities (direct and indirect)ii) energy management plans (ship and shore)iii) waste management plans
D. Preparednessi) infrastructure risk assessments where current construction standards are not applicable;ii) alternative energy planning
Chemical Pollution High A. Regulatory - continuous monitoring of developments in local and foreign jurisdictions
B. Management – inventory high risk substances

34
Environmental Strategies
BOUNDARY RANK STRATEGY
Freshwater Use High A. Stakeholder – regular contact with water control authorities and utilities planning
B. Management i) metrics development for business activities (direct and indirect)ii) water use policy implementationiii) water recycling
Habitat Use(Land & Marine)
Moderate A. Stakeholder – PNCIMA; review other influential regional NGO’s
B. Management i) develop an in-house educational tool for operational personnelii) research impact reduction options for operations in potential conflict areas

35
Environmental Strategies
BOUNDARY RANK STRATEGY
Ozone Depletion Moderate A. Regulatory - periodic monitoring of developments in local and foreign jurisdictions
B. Management i) inventory high risk substancesii) renewal plan for ODS equipment
Ocean Acidification
Moderatesame as Climate Change
Aerosol Loading Moderate A. Stakeholder – engagement with leading NGO’s (review and TBD); engagement with regional government authorities (BC Marine Vessel Air Quality Working Group)
B. Regulatory – continuous monitoring of developments in local and foreign jurisdictions
C. Management - in-house educational tools
36
Environmental Strategies
BOUNDARY RANK STRATEGY
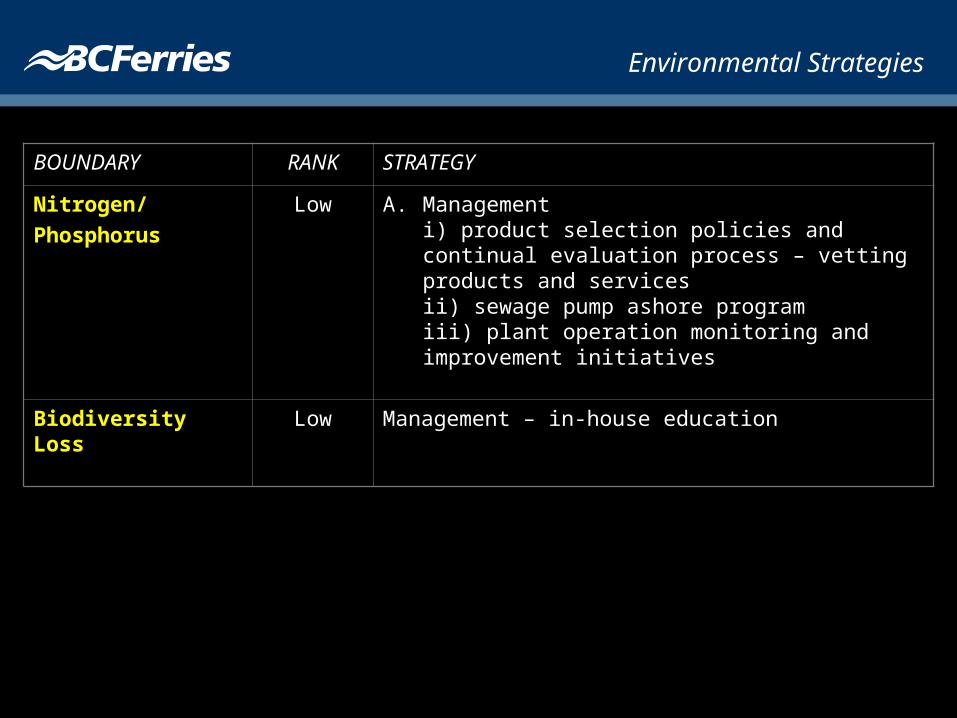
Nitrogen/Phosphorus
Low A. Management i) product selection policies and continual evaluation process – vetting products and servicesii) sewage pump ashore programiii) plant operation monitoring and improvement initiatives
Biodiversity Loss Low Management – in-house education
37
Environmental Boundaries
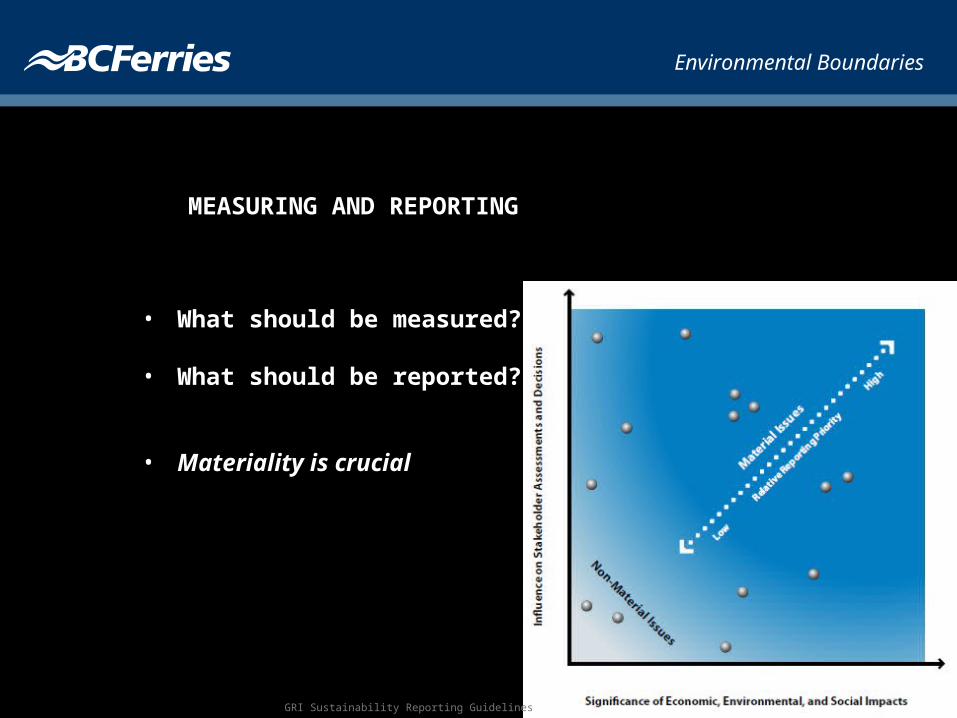
• What should be measured?
• What should be reported?
• Materiality is crucial
MEASURING AND REPORTING
GRI Sustainability Reporting Guidelines

38
Environmental Boundaries
• Marine industry: CMAC, CFOA, Chamber of Shipping, IOAC
• United Nations: Environmental Programme, Global Compact, Global Reporting Initiatives
• NGOs: Rainforest Alliance, International Chamber of Commerce, WRI
STAKEHOLDER ENGAGEMENT

39
Environmental Boundaries
1. Is the threat easily understood
2. Public health threats
3. Local will take precedence over global
4. Resilience before sustainable

40
Environmental Boundaries
• Establish the industrial and regulatory capacity to deliver solutions for the here and now (resilience based)
• Operators be prepared to deal with technical and administrative complexity in the near term.
• Work in the longer term towards simplicity and sustainability.
CANADIAN MARINE INDUSTRY

41
Environmental Boundaries
Questions?
What it means to be human in our generation: What it means to be human in our generation: ""The human is but one life form among many, and what The human is but one life form among many, and what distinguishes us from the larger community of life is not distinguishes us from the larger community of life is not our power to subdue but our responsibility to protectour power to subdue but our responsibility to protect ." ."
Tom ReganTom Regan
42
<header>
Contact Information:
Greg PetersonDirector, Fleet Performance & EnvironmentBCF Richmond604-204-2330