Embed Size (px)
Citation preview
1
Energy in Networks & Data Center Networks
Department of EECSUniversity of Tennessee, Knoxville
Yanjun Yao
2
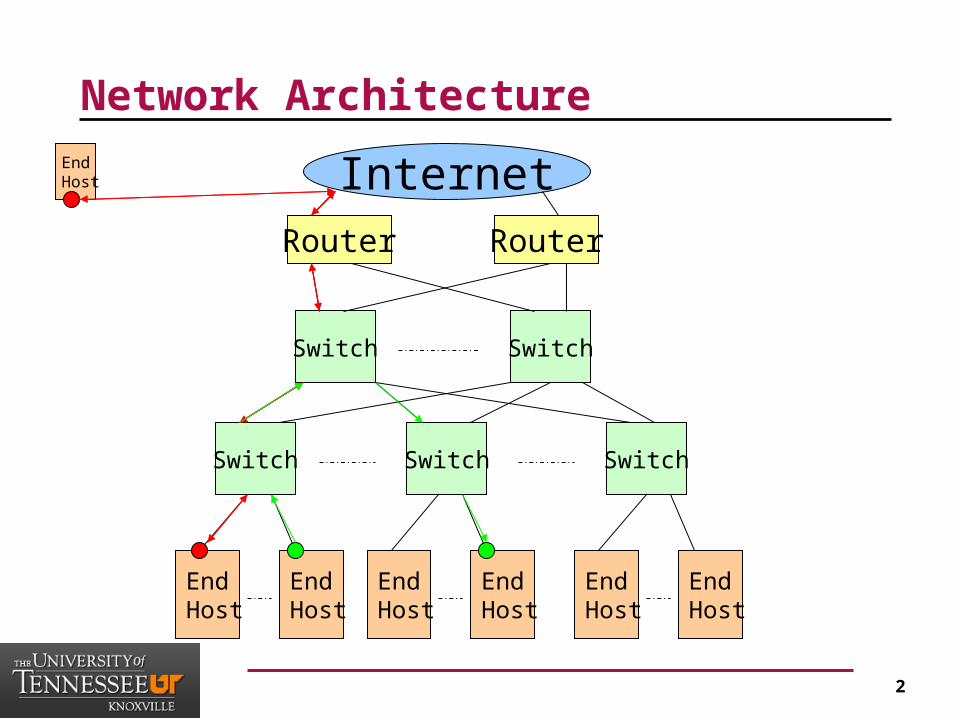
Network Architecture
InternetRouter Router
Switch Switch
SwitchSwitch Switch
End Host
End Host
End Host
End Host
End Host
End Host
End Host
3
A Feasibility Study for Power Management in LAN Switches
Computer Science DepartmentPortland State University
Maruti Gupta, Satyajit Grover and Suresh Singh
4
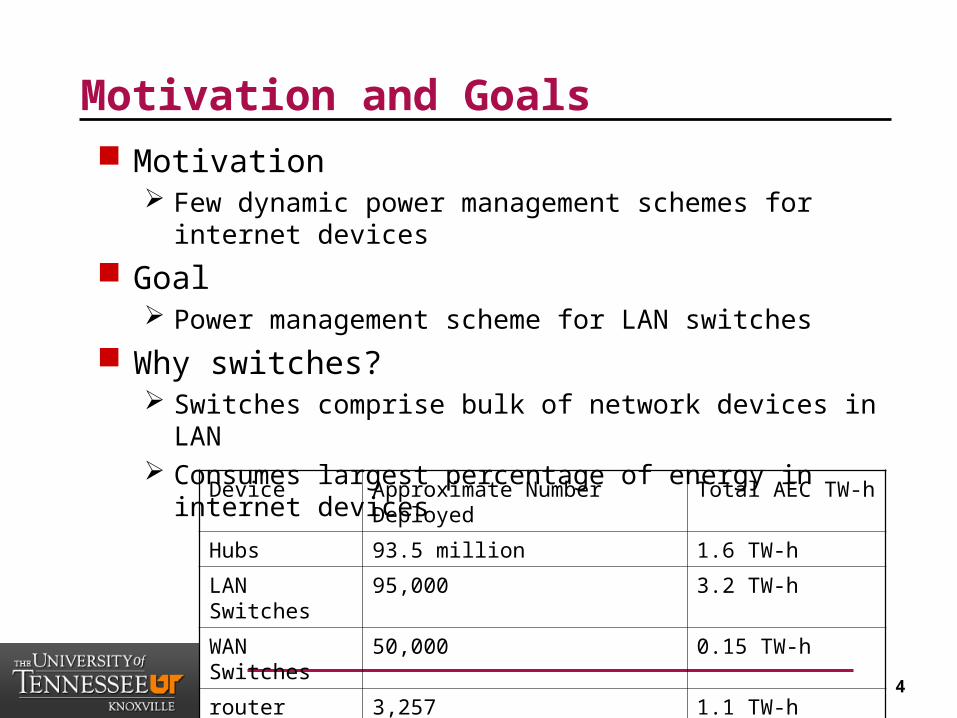
Motivation and Goals Motivation
Few dynamic power management schemes for internet devices
Goal Power management scheme for LAN switches
Why switches? Switches comprise bulk of network devices in LAN Consumes largest percentage of energy in internet devices
Device Approximate Number Deployed Total AEC TW-h
Hubs 93.5 million 1.6 TW-h
LAN Switches 95,000 3.2 TW-h
WAN Switches 50,000 0.15 TW-h
router 3,257 1.1 TW-h
5
Related Works Estimate power consumption in switch fabrics:
Developing statistical traffic models [Wassal et al. 2001] Various analytical models [G. Essakimuthu et al. 2002, D.
Langen et al. 2000, C. Patel et al. 1997, Hang et al. 2002, Ye et al. 2002]
Power management schemes for interconnection network fabrics: Using DVS with links [Li et al. 2003] Using on/off links [L. Peh et al. 2003] Router power throttling [Li et al. 2003]
6
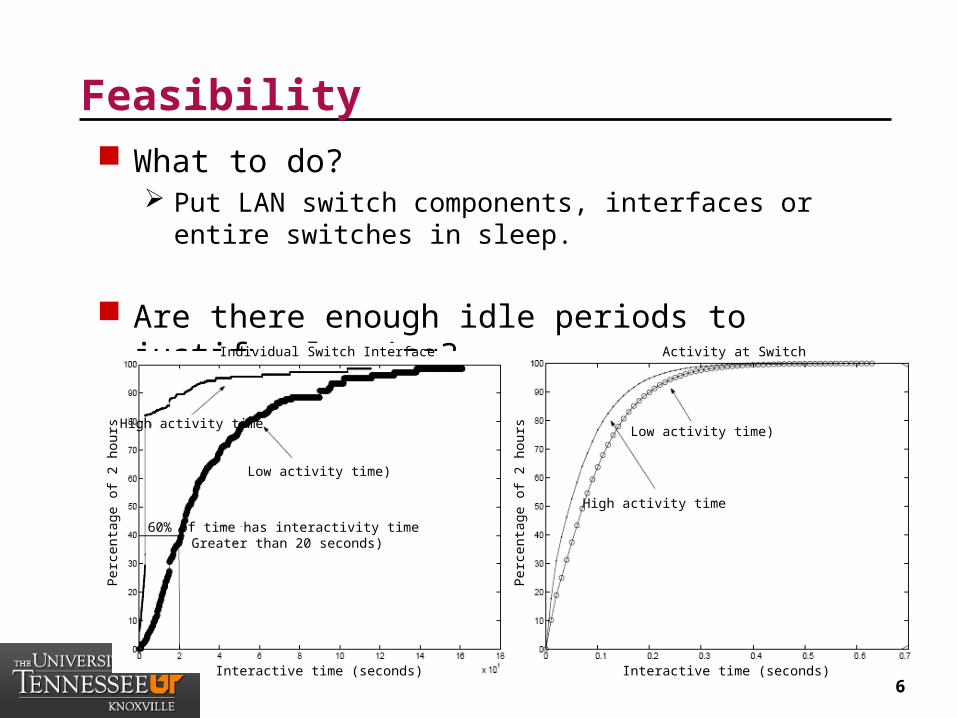
Feasibility What to do?
Put LAN switch components, interfaces or entire switches in sleep.
Are there enough idle periods to justify sleeping?Individual Switch Interface
Interactive time (seconds)
60% of time has interactivity time Greater than 20 seconds)
Low activity time)
High activity time
Per
cent
age
of 2
hou
rs
Per
cent
age
of 2
hou
rs
Low activity time)
High activity time
Activity at Switch
Interactive time (seconds)
7
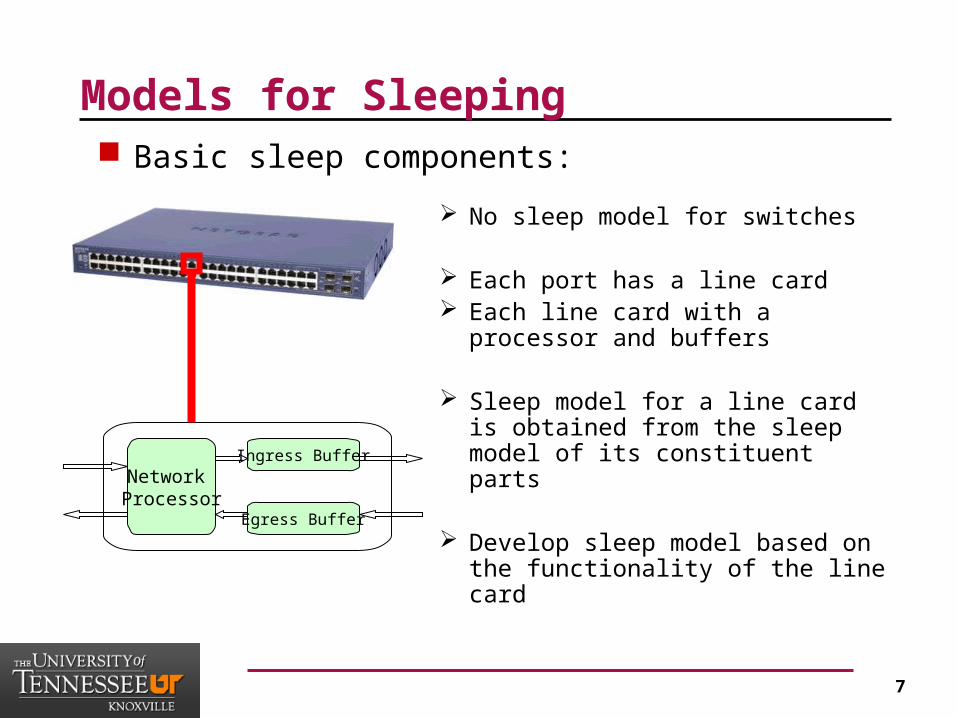
Models for Sleeping Basic sleep components:
No sleep model for switches
Each port has a line card Each line card with a processor and
buffers
Sleep model for a line card is obtained from the sleep model of its constituent parts
Develop sleep model based on the functionality of the line card
Network Processor
Ingress Buffer
Egress Buffer
8
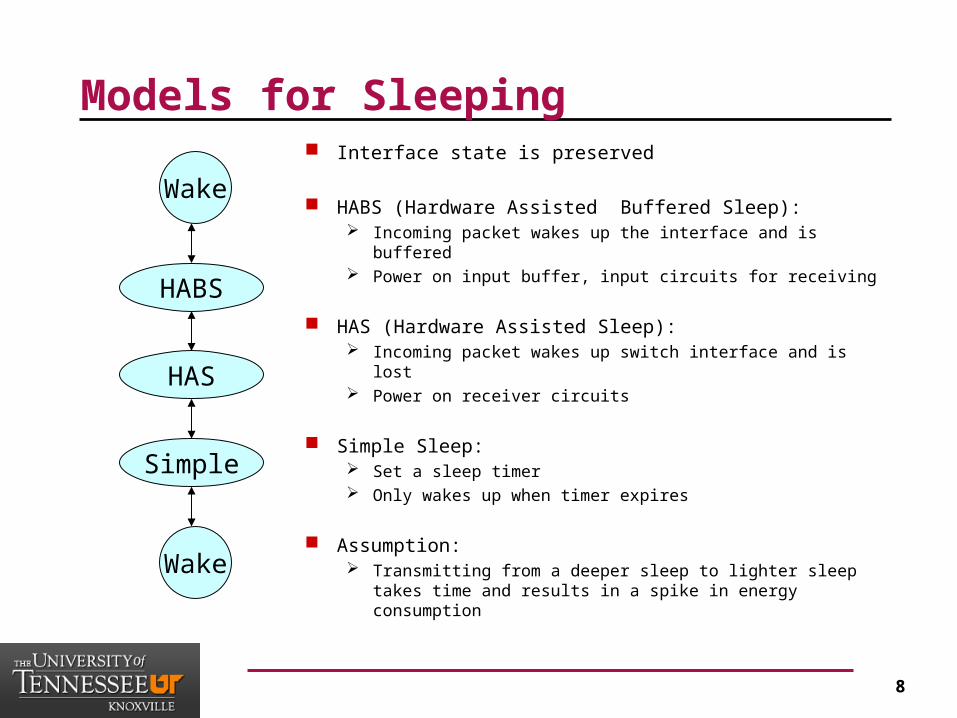
Models for Sleeping Interface state is preserved
HABS (Hardware Assisted Buffered Sleep): Incoming packet wakes up the interface and is buffered Power on input buffer, input circuits for receiving
HAS (Hardware Assisted Sleep): Incoming packet wakes up switch interface and is lost Power on receiver circuits
Simple Sleep: Set a sleep timer Only wakes up when timer expires
Assumption: Transmitting from a deeper sleep to lighter sleep takes time
and results in a spike in energy consumption
Wake
Wake
HABS
HAS
Simple
9
Implication of Sleeping Simple Sleep:
All packets are lost Poor throughput, energy saving will be offset by
retransmission To use this state, we need:
Interface connected to end host: ACPI (Advanced Configuration and Power Interface) to inform the switch that it is going to sleep
Interface connecting switches: guarantee no packets will be sent to a sleeping interface
HAS: The packets wake up the interface get lost To use it, we need:
Send a dummy packet ahead of the packets to be sent to the sleeping interface
10
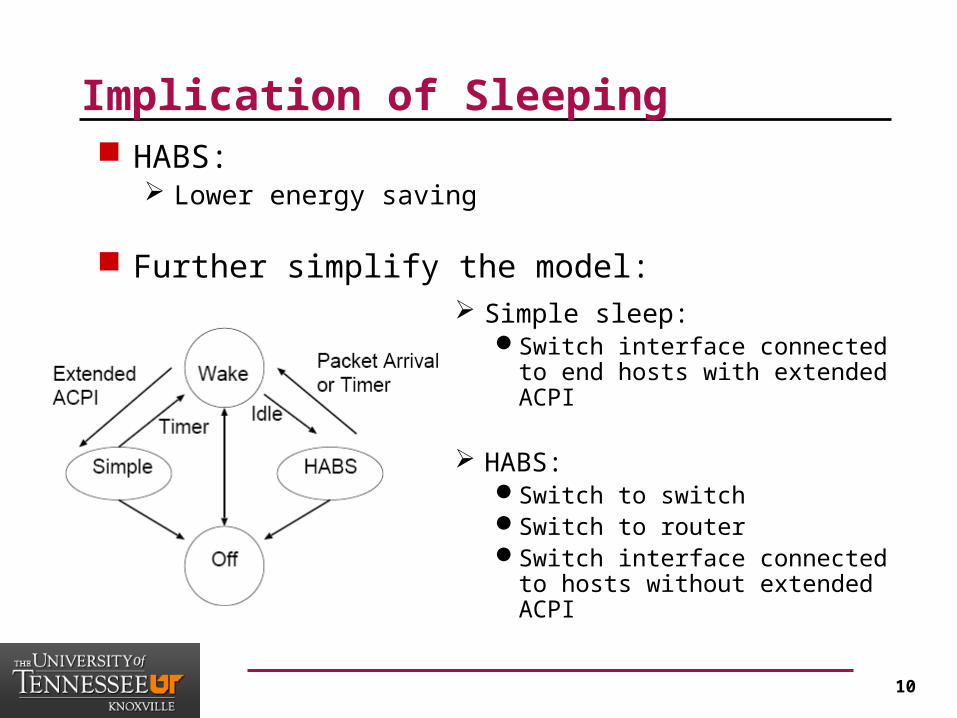
Implication of Sleeping HABS:
Lower energy saving
Further simplify the model: Simple sleep:
Switch interface connected to end hosts with extended ACPI
HABS:Switch to switchSwitch to routerSwitch interface connected to
hosts without extended ACPI
11
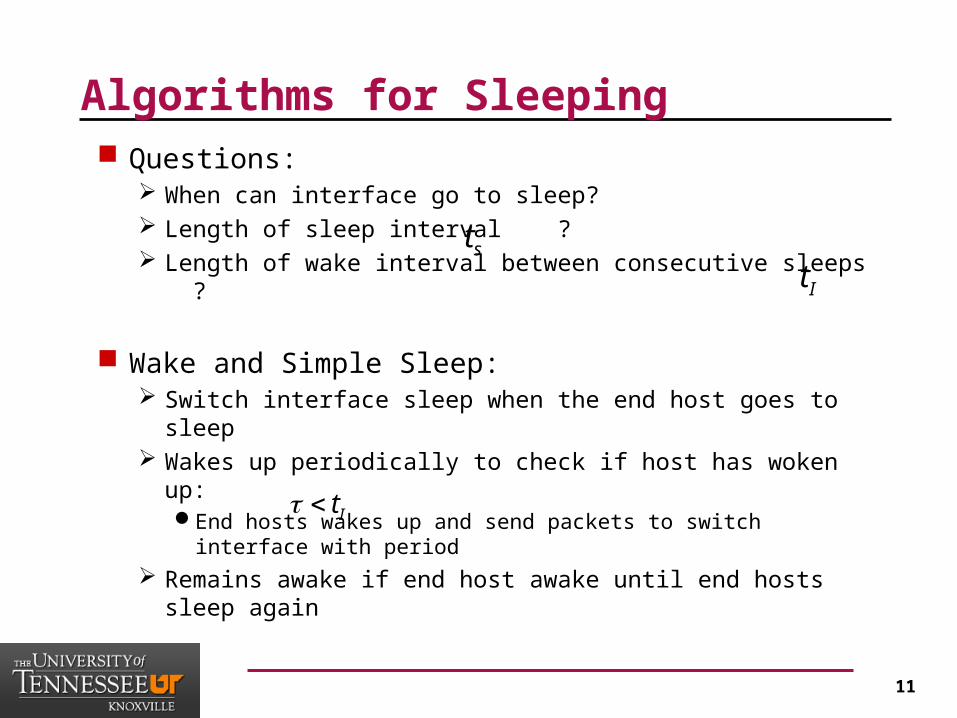
Algorithms for Sleeping Questions:
When can interface go to sleep? Length of sleep interval ? Length of wake interval between consecutive sleeps ?
Wake and Simple Sleep: Switch interface sleep when the end host goes to sleep Wakes up periodically to check if host has woken up:
End hosts wakes up and send packets to switch interface with period
Remains awake if end host awake until end hosts sleep again
st
It
It
12
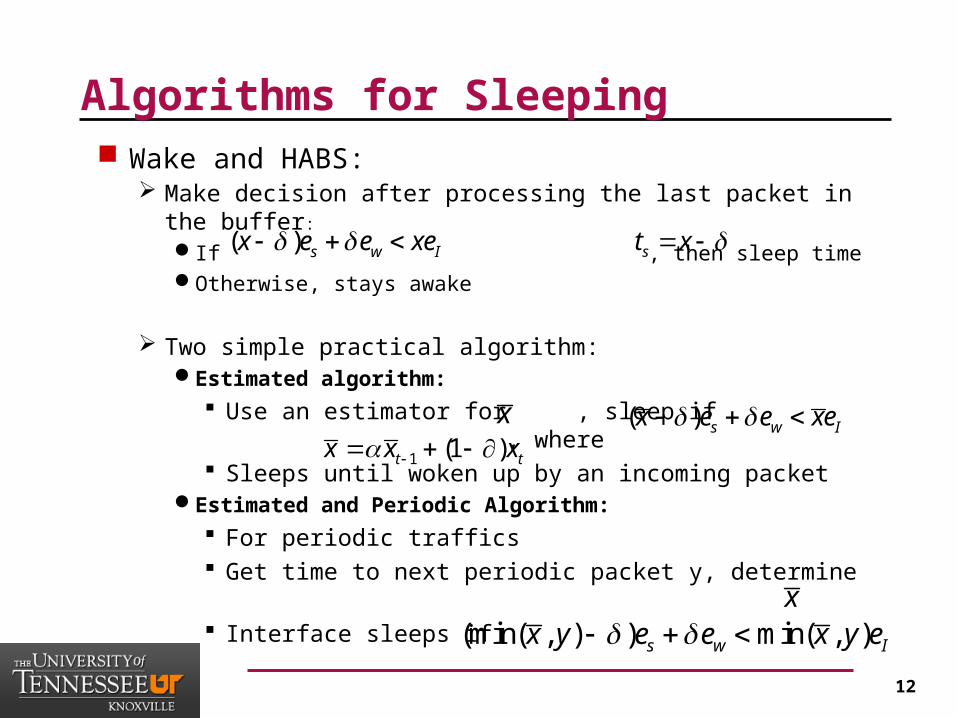
Algorithms for Sleeping Wake and HABS:
Make decision after processing the last packet in the buffer:
If , then sleep time Otherwise, stays awake
Two simple practical algorithm:Estimated algorithm:
Use an estimator for , sleep if , where
Sleeps until woken up by an incoming packetEstimated and Periodic Algorithm:
For periodic traffics Get time to next periodic packet y, determine Interface sleeps if
( ) s w Ix e e xe st x
x ( ) s w Ix e e xe 1 (1 )t tx x x
x(min( , ) ) min( , )s w Ix y e e x y e
13
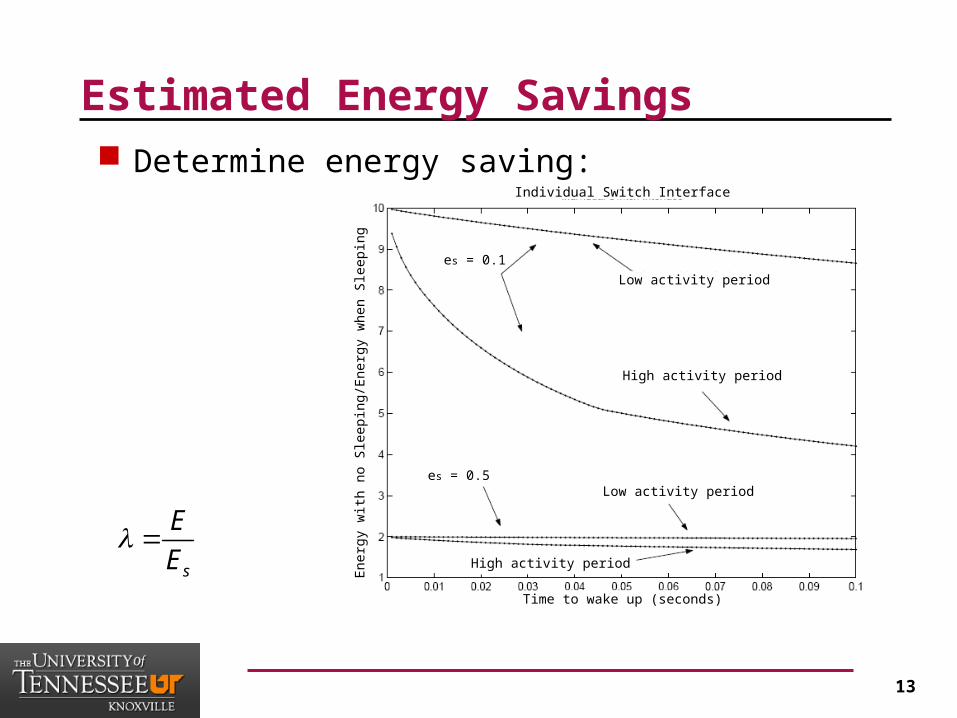
Estimated Energy Savings Determine energy saving:
s
E
E
Individual Switch Interface
Time to wake up (seconds)
High activity period
High activity period
Low activity period
Low activity period
es = 0.1
es = 0.5
Ene
rgy
with
no
Sle
epin
g/E
nerg
y w
hen
Sle
epin
g
14
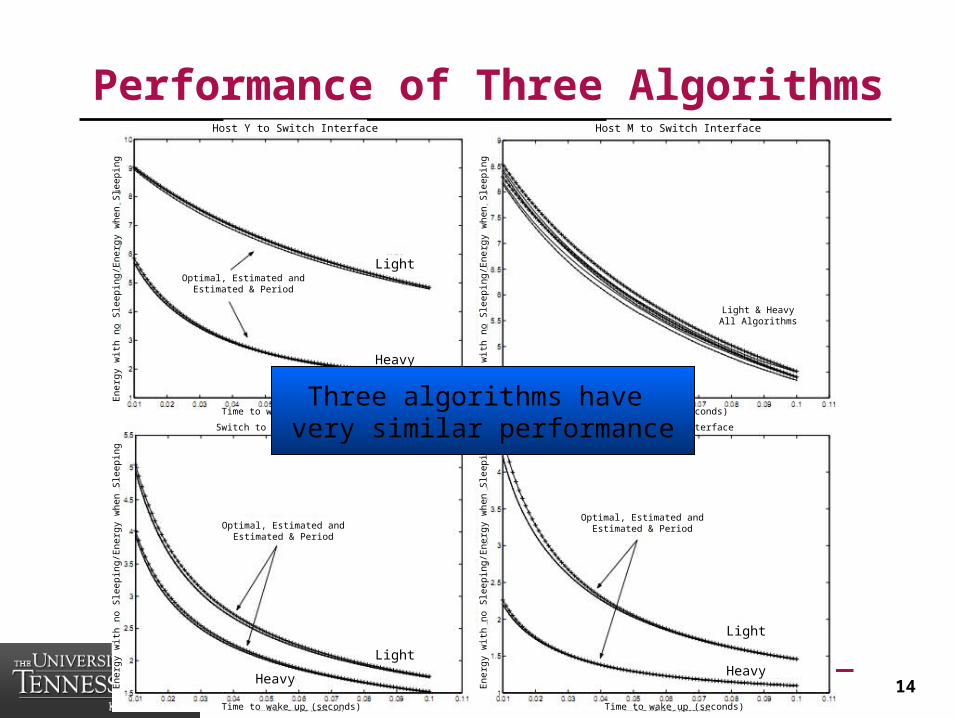
Performance of Three Algorithms
Light
Light
HeavyHeavy
Host Y to Switch Interface Host M to Switch Interface
Heavy
Light
HeavyHeavy
Light
Light
Time to wake up (seconds) Time to wake up (seconds)
Time to wake up (seconds) Time to wake up (seconds)
Switch to Switch Interface Switch to Switch Interface
Optimal, Estimated andEstimated & Period
Optimal, Estimated andEstimated & Period
Optimal, Estimated andEstimated & Period
Light & HeavyAll Algorithms
Ene
rgy
with
no
Sle
epin
g/E
nerg
y w
hen
Sle
epin
gE
nerg
y w
ith n
o S
leep
ing/
Ene
rgy
whe
n S
leep
ing
Ene
rgy
with
no
Sle
epin
g/E
nerg
y w
hen
Sle
epin
gE
nerg
y w
ith n
o S
leep
ing/
Ene
rgy
whe
n S
leep
ing
Three algorithms have very similar performance
15
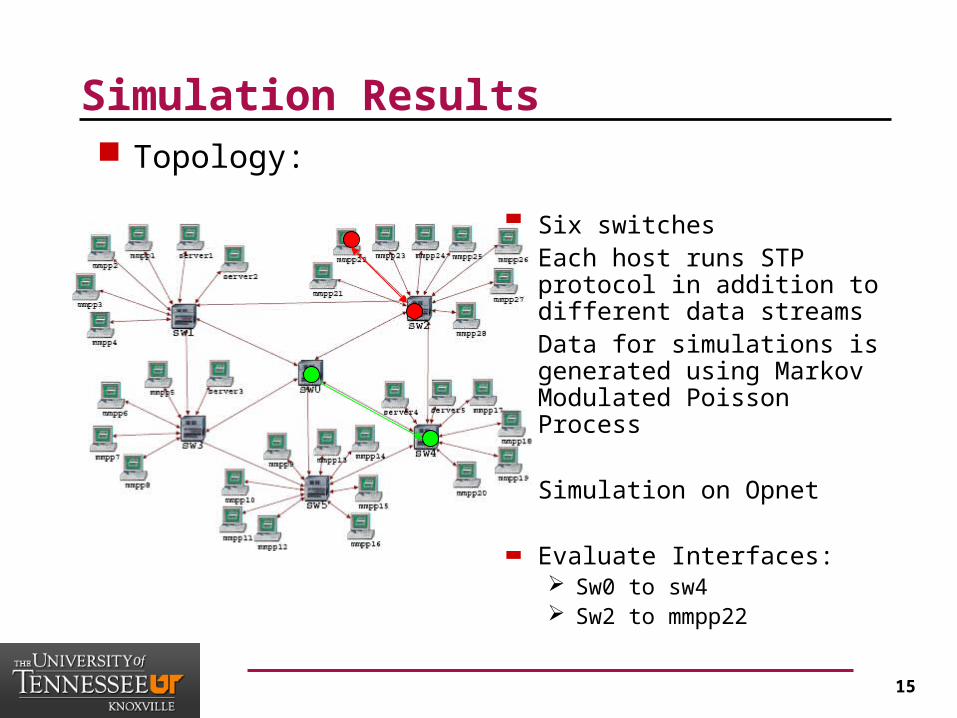
Simulation Results Topology:
Six switches Each host runs STP protocol
in addition to different data streams
Data for simulations is generated using Markov Modulated Poisson Process
Simulation on Opnet
Evaluate Interfaces: Sw0 to sw4 Sw2 to mmpp22
16
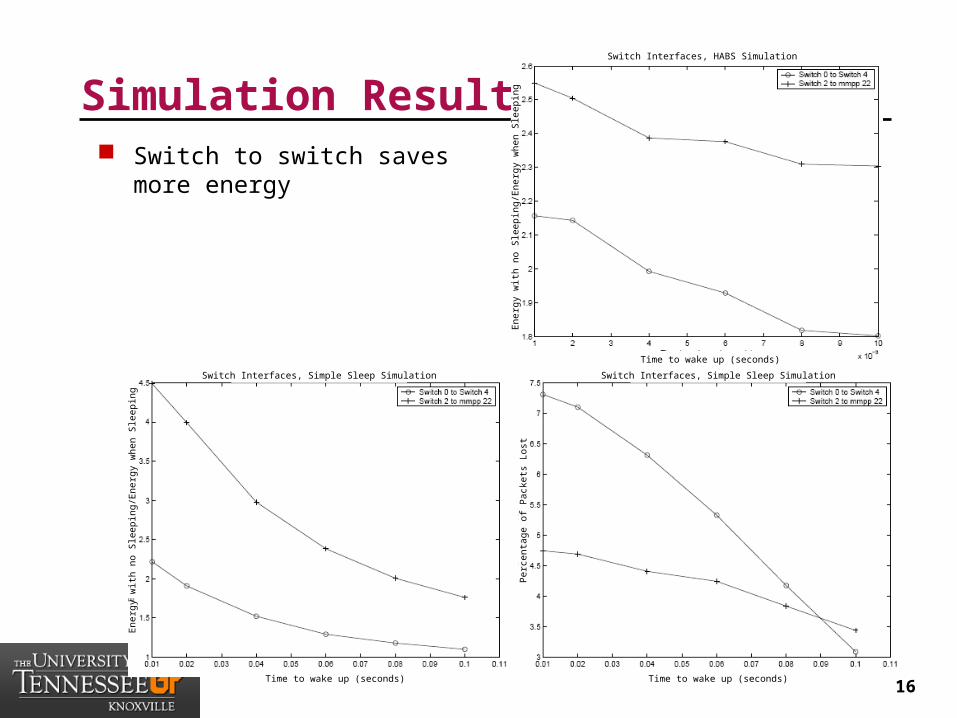
Simulation Result Switch to switch saves more
energy
Ene
rgy
with
no
Sle
epin
g/E
nerg
y w
hen
Sle
epin
g
Ene
rgy
with
no
Sle
epin
g/E
nerg
y w
hen
Sle
epin
g
Per
cent
age
of P
acke
ts L
ost
Switch Interfaces, HABS Simulation
Switch Interfaces, Simple Sleep Simulation Switch Interfaces, Simple Sleep Simulation
Time to wake up (seconds) Time to wake up (seconds)
Time to wake up (seconds)
17
Impact of Sleeping On protocols and Topology Design
Simple Sleep’s impact on protocol design: For periodic messages, the sleep time must be fine tuned. Wake up all interfaces for broadcasting.
Impact of network topology and VLANs on sleeping: For redundant paths:
Aggregate traffic loads to some of the paths and put the rest to sleep.
However, the STP generated a spanning tree
18
Conclusion Sleeping in order to save energy is a feasible option
in the LAN.
Three sleeping models are proposed.
Two types of algorithms for transmitting from wake state and sleeping state are shown.
Simulations are done to evaluate the performance of HABS and Simple Sleep.
19
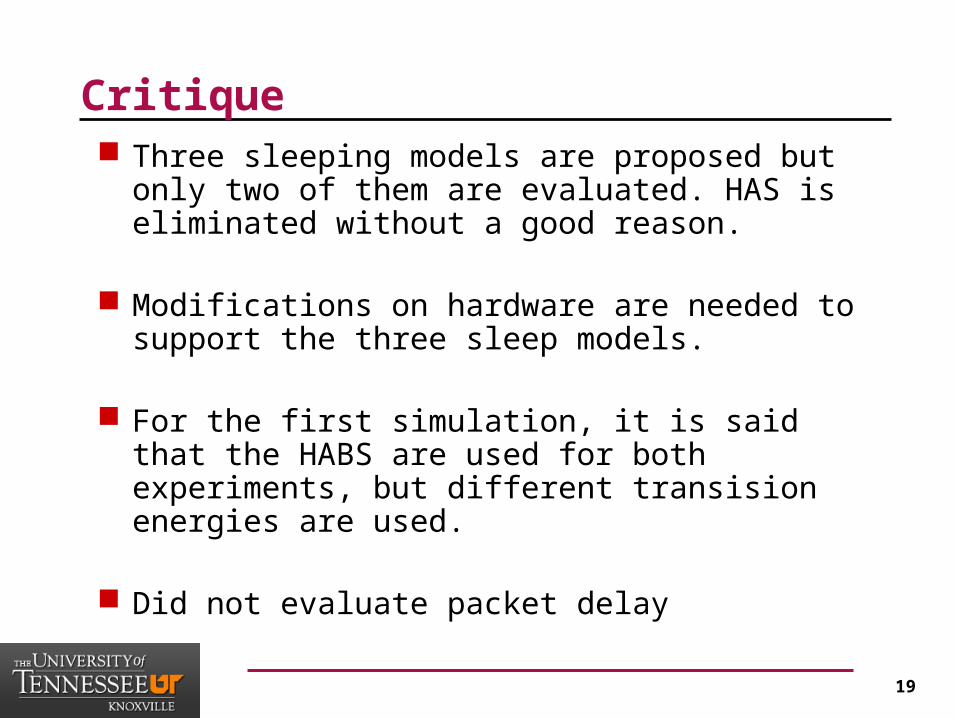
Critique Three sleeping models are proposed but only two of
them are evaluated. HAS is eliminated without a good reason.
Modifications on hardware are needed to support the three sleep models.
For the first simulation, it is said that the HABS are used for both experiments, but different transision energies are used.
Did not evaluate packet delay
20
VL2: A Scalable and Flexible Data Center Network
Microsoft Reseach
Albert Greenberg. James R. Hamilton. Navendu
Jain. Srikanth Kandula. Changhoon Kim, et al
21
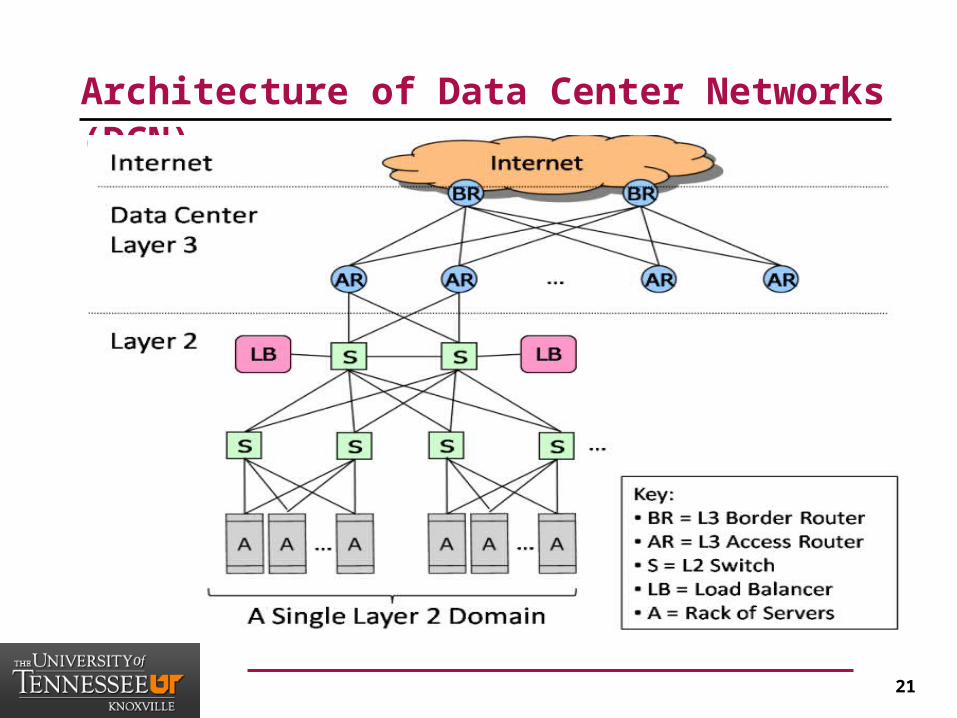
Architecture of Data Center Networks (DCN)
22
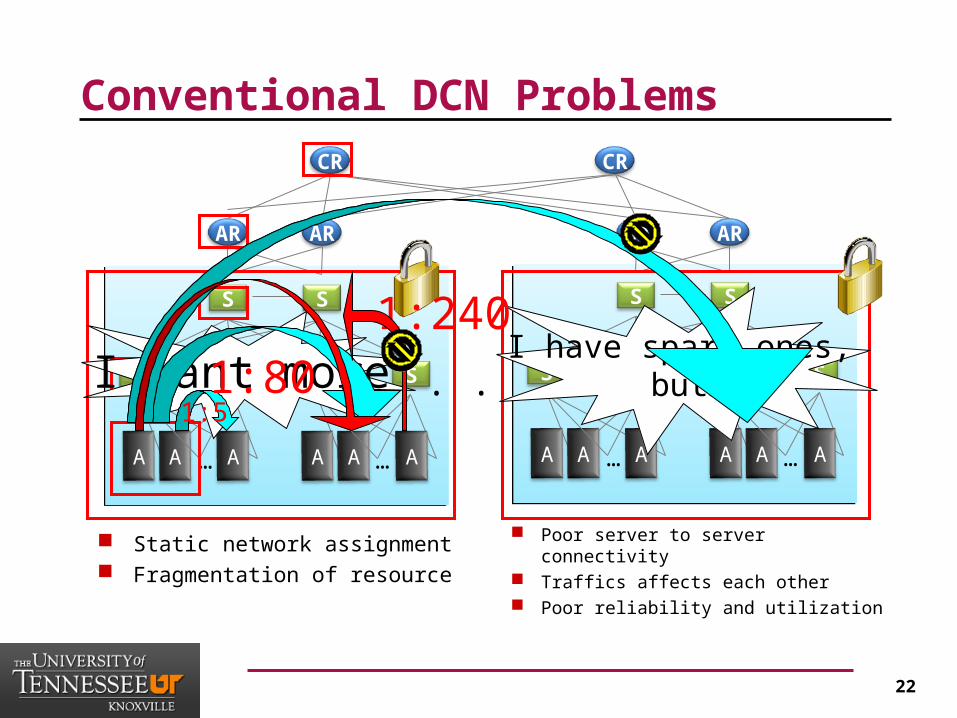
Conventional DCN Problems
Static network assignment Fragmentation of resource
Poor server to server connectivity Traffics affects each other Poor reliability and utilization
CR CR
AR AR AR AR
SS
SS
A AA …
SS
A AA …
. . .
SS
SS
A AA …
SS
A AA …
I want moreI have spare ones,
but…1:5
1:80
1:240
23
Objectives: Uniform high capacity:
Maximum rate of server to server traffic flow should be limited only by capacity on network cards
Assigning servers to service should be independent of network topology
Performance isolation: Traffic of one service should not be affected by traffic of other
services
Layer-2 semantics: Easily assign any server to any service Configure server with whatever IP address the service expects VM keeps the same IP address even after migration
24
Measurements and Implications of DCN Data-Center traffic analysis:
Traffic volume between servers to entering/leaving data center is 4:1
Demand for bandwidth between servers growing faster Network is the bottleneck of computation
Flow distribution analysis: Majority of flows are small, biggest flow size is 100MB The distribution of internal flows is simpler and more uniform 50% times of 10 concurrent flows, 5% greater than 80
concurrent flows
25
Measurements and Implications of DCN Traffic matrix analysis:
Poor summarizing of traffic patterns Instability of traffic patterns
Failure characteristics: Pattern of networking equipment failures: 95% < 1min, 98%
< 1hr, 99.6% < 1 day, 0.09% > 10 days No obvious way to eliminate all failures from the top of the
hierarchy
26
Virtual Layer Two Networking (VL2) Design principle:
Randomizing to cope with volatility:Using Valiant Load Balancing (VLB) to do destination
independent traffic spreading across multiple intermediate nodes
Building on proven networking technology:Using IP routing and forwarding technologies available in
commodity switches
Separating names from locators:Using directory system to maintain the mapping between names
and locations
Embracing end systems:A VL2 agent at each server
27
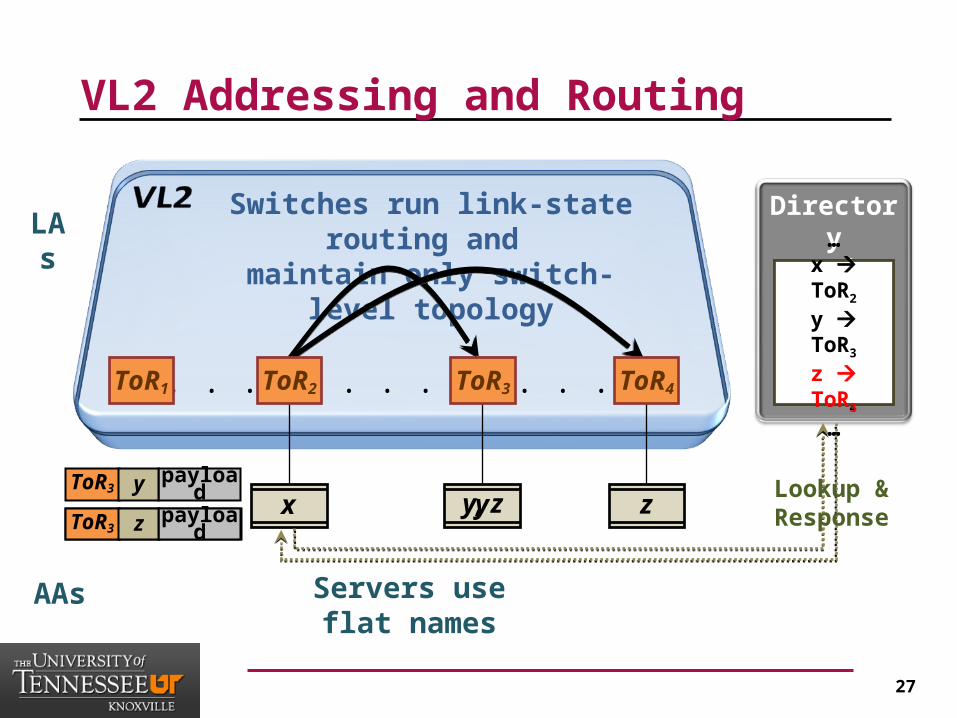
VL2 Addressing and Routing
payloadToR3
. . . . . .
yx
Servers use flat names
Switches run link-state routing and maintain only switch-level topology
y zpayloadToR4 z
ToR2 ToR4ToR1 ToR3
y, zpayloadToR3 z
. . .
DirectoryService
…x ToR2
y ToR3
z ToR4
…
Lookup &Response
…x ToR2
y ToR3
z ToR3
…
LAs
AAs
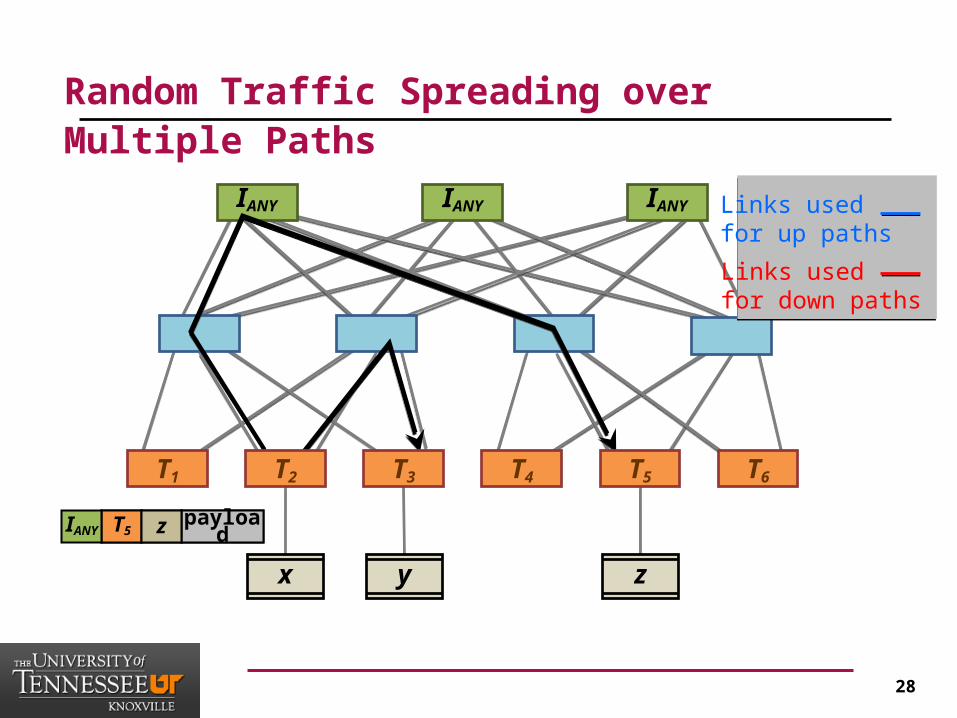
28
Random Traffic Spreading over Multiple Paths
x y
payloadT3 y
z
payloadT5 z
IANYIANYIANY
IANY
Links used for up paths
Links usedfor down paths
T1 T2 T3 T4 T5 T6
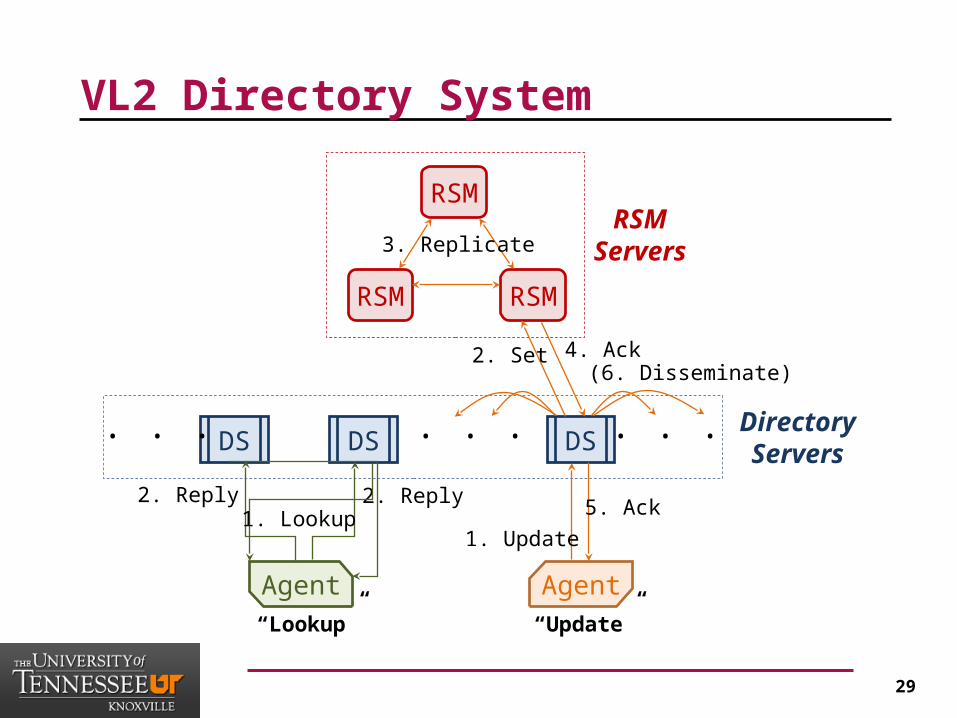
29
VL2 Directory System
RSM
DS
RSM
DS
RSM
DS
Agent
. . .
Agent
. . .. . . DirectoryServers
RSMServers
2. Reply2. Reply1. Lookup
“Lookup”
5. Ack
2. Set 4. Ack(6. Disseminate)
3. Replicate
1. Update
“Update”
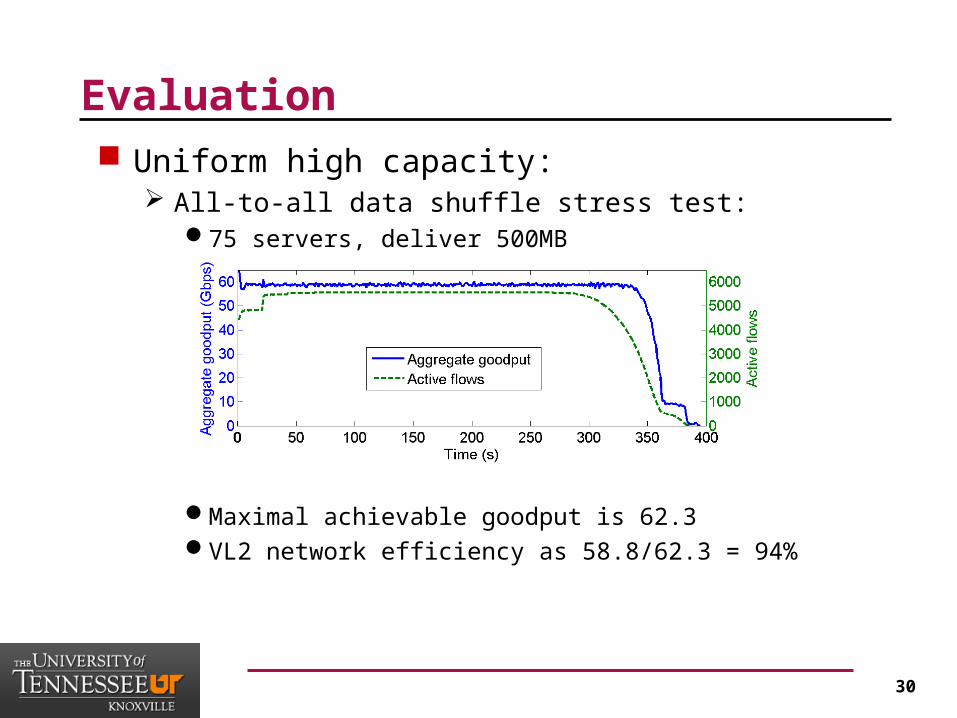
30
Evaluation Uniform high capacity:
All-to-all data shuffle stress test:75 servers, deliver 500MB
Maximal achievable goodput is 62.3VL2 network efficiency as 58.8/62.3 = 94%
31
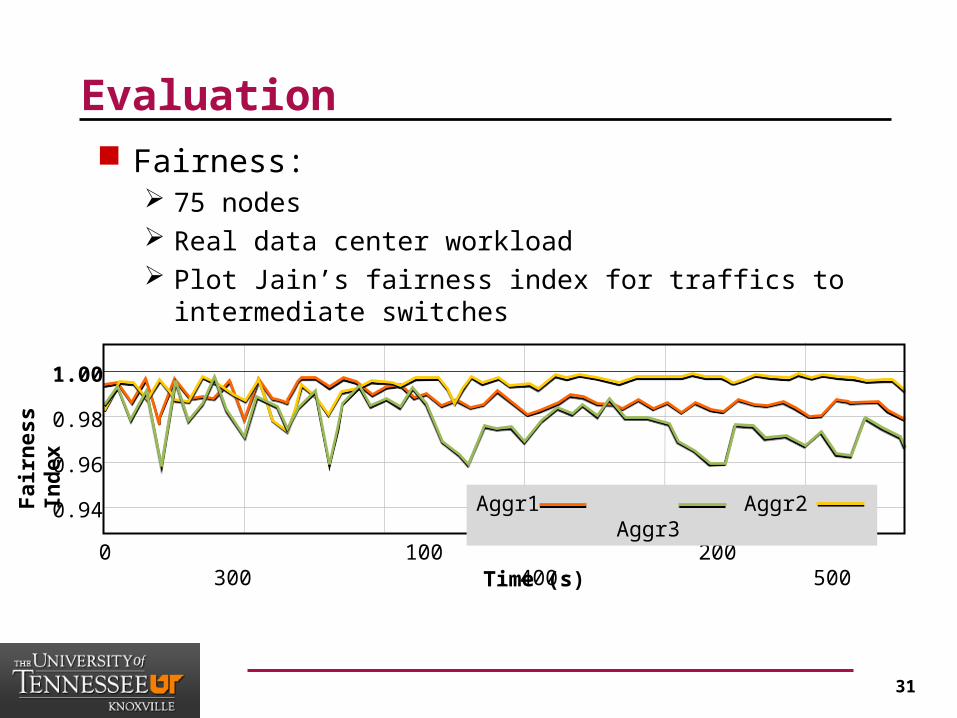
Evaluation Fairness:
75 nodes Real data center workload Plot Jain’s fairness index for traffics to intermediate switches
Time (s)0 100 200 300 400 500
1.00
0.98
0.96
0.94Fair
nes
s In
dex
Aggr1 Aggr2 Aggr3
32
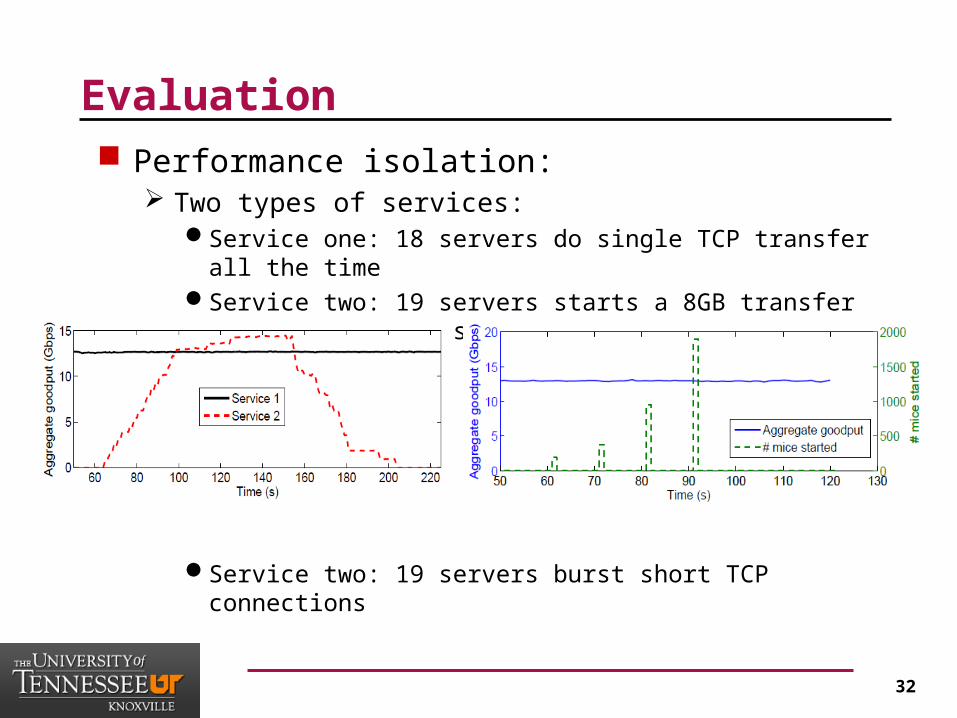
Evaluation Performance isolation:
Two types of services:Service one: 18 servers do single TCP transfer all the timeService two: 19 servers starts a 8GB transfer over TCP every 2
seconds
Service two: 19 servers burst short TCP connections
33
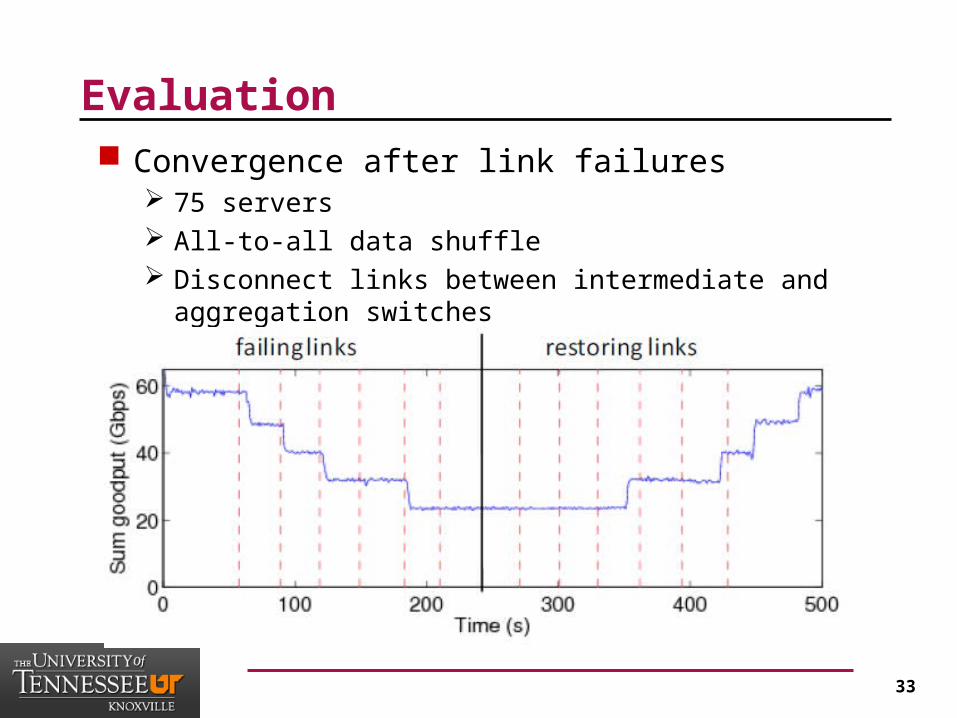
Evaluation Convergence after link failures
75 servers All-to-all data shuffle Disconnect links between intermediate and aggregation
switches
34
Conclusion Studied the traffic pattern in a production data center
and find the traffic patterns
Design, build and deploy every component of VL2 in an 80 server testbed
Apply VLB to randomly spreading traffics over multiple flows
Using flat address to split IP addresses and server names
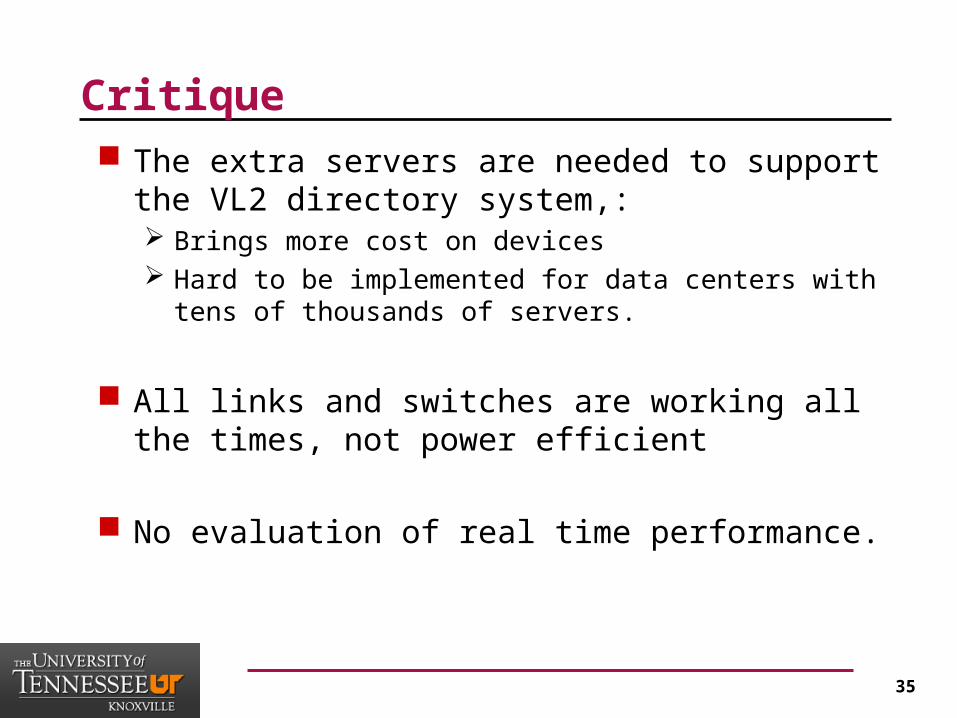
35
Critique The extra servers are needed to support the VL2
directory system,: Brings more cost on devices Hard to be implemented for data centers with tens of
thousands of servers.
All links and switches are working all the times, not power efficient
No evaluation of real time performance.
36
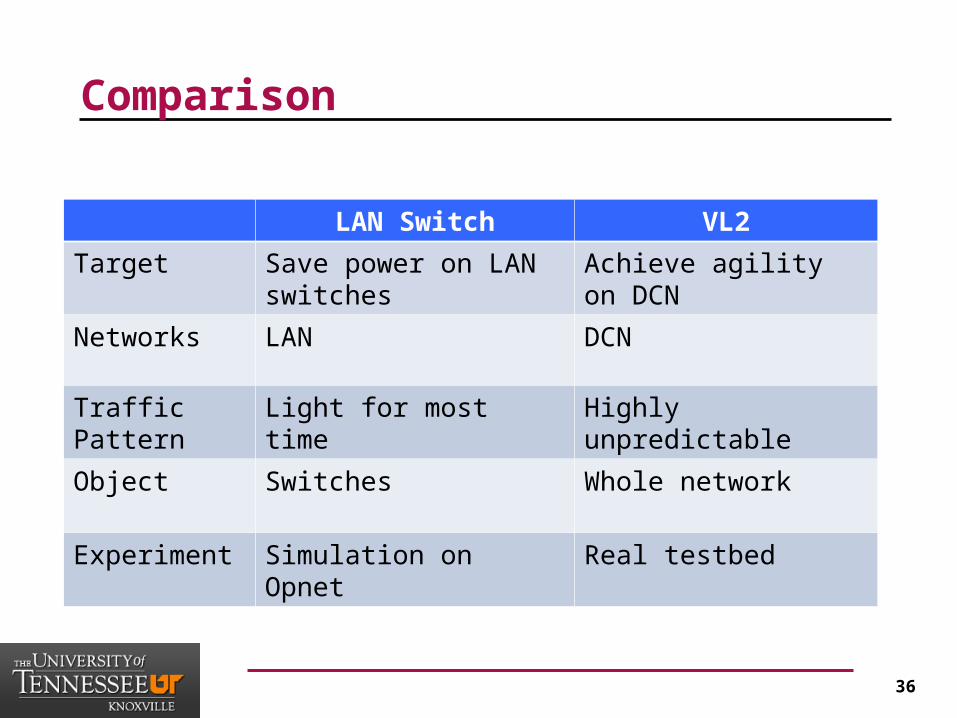
Comparison
LAN Switch VL2
Target Save power on LAN switches
Achieve agility on DCN
Networks LAN DCN
Traffic Pattern Light for most time Highly unpredictable
Object Switches Whole network
Experiment Simulation on Opnet Real testbed
37
Q&A