Embed Size (px)
Citation preview

1
Employer-Sponsored Health Insurance: Stable Pools and the
Quality of Coverage
Keith J. CrockerThe William Elliott Chaired Professor of Insurance and
Risk Management
Smeal College of Business
Pennsylvania State University
University Park, PA 16802

2
Employer-Sponsored Health InsuranceIn 2006, approximately 90% of privately- insured, nonelderly Americans received coverage through an employer-sponsored plan
2010: Patient Protection and Affordable Care Act “Obamacare” Beginning in 2014, prohibits pre-existing condition
exclusions in which will eliminate the individual and small-employer group market
Employers with >50 employees will have to offer health insurance or pay a fine
Most employers will pay the fine and drop coverage

3
Why Employer-Sponsored Health Care?
• Favorable tax treatment– Premiums deducted as a business
expense (pre-tax dollars!)• Economies of Scale in the purchase and
administration of group policies

4
The Big Question:
• Why is there virtually no market for individual insurance policies?– Contrast with the vibrant individual market
for life insurance which co-exists with the employer-sponsored life insurance benefit
– In 2003, for example, only ¼ of the 20% of Americans without access to an employer plan or public insurance were covered by an individual policy
5
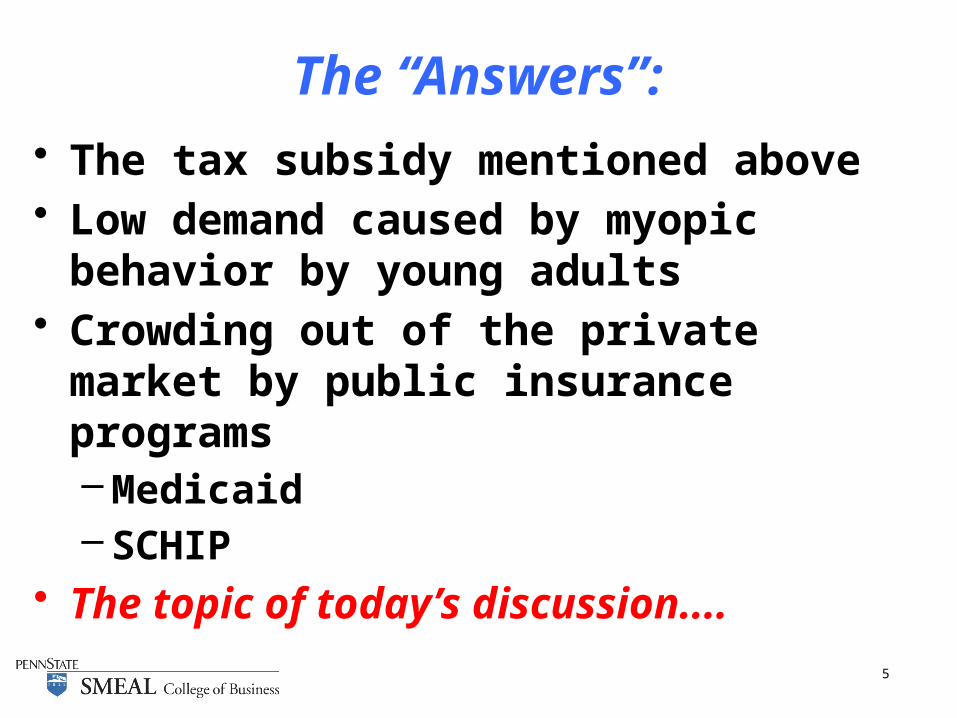
The “Answers”:• The tax subsidy mentioned above• Low demand caused by myopic behavior
by young adults• Crowding out of the private market by
public insurance programs– Medicaid– SCHIP
• The topic of today’s discussion....

6
My 2003 RAND Journal Article with John Moran:
“Contracting with Limited Commitment: Evidence from Employment-Based Health Insurance Contracts, RAND Journal of Economics, Winter 2003.

7
Classification Risk
All Consumers are Healthy
Consumers Purchase
Insurance at the “healthy” premium;Some claims paid
Over Time, Some Stay Healthy
While Others Develop“chronic” conditions
Depart the RiskPool to be Re-Underwritten
Stay in the Pool and Pay High
Premiums
“ClassificationRisk”

8
How Do We Keep the Healthy Individuals in the Risk Pool?
• Have consumers sign long-term contracts to remain with the insurer– Historically, non-enforceable
• Charge front-loaded premiums, as in whole life insurance– This is a lot more difficulty in health care
where future technologies and costs are uncertain

9
A Third Solution….
• Tie Health Insurance to Employment• If it is costly for employees to switch
jobs, then it is difficult to move to another employer for a better health insurance deal
• The Key Insight: Job market frictions create job attachment which translates into more stable insurance pools.

10
Job Attachment and Stable Insurance Pools
• The ability of the healthy to depart and be medically re-underwritten is constrained by their Job Attachment
• Healthy workers find it less onerous to be pooled with the unhealthy when there are coverage restrictions
• The Hypothesis: There should be a positive relationship between job attachment and the generosity of the health care plan
11
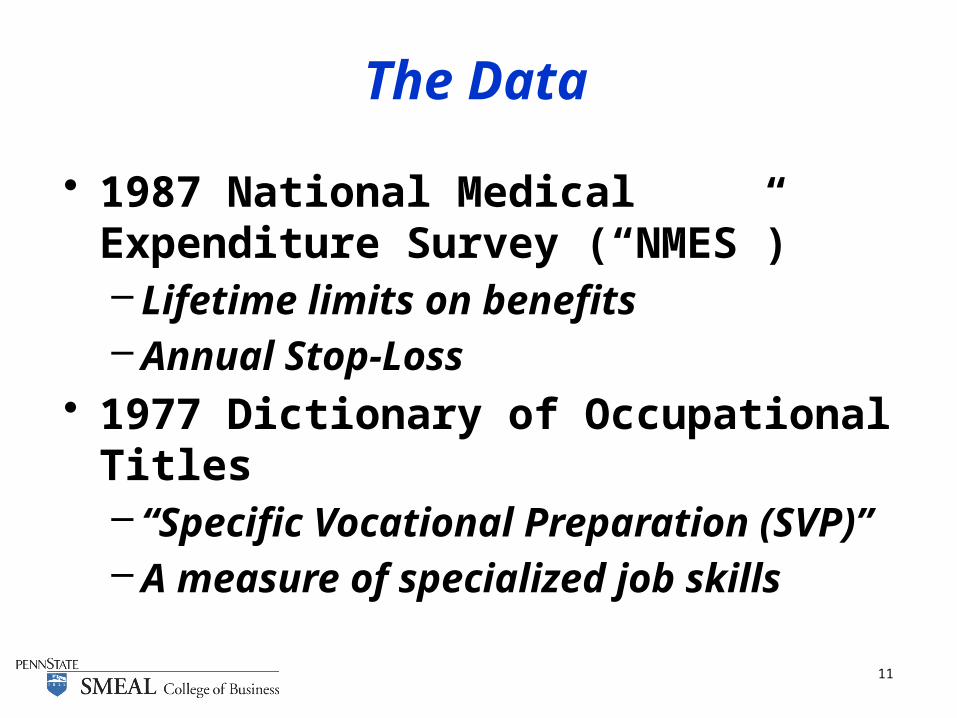
The Data
• 1987 National Medical Expenditure Survey (“NMES”)– Lifetime limits on benefits– Annual Stop-Loss
• 1977 Dictionary of Occupational Titles– “Specific Vocational Preparation (SVP)”– A measure of specialized job skills
12
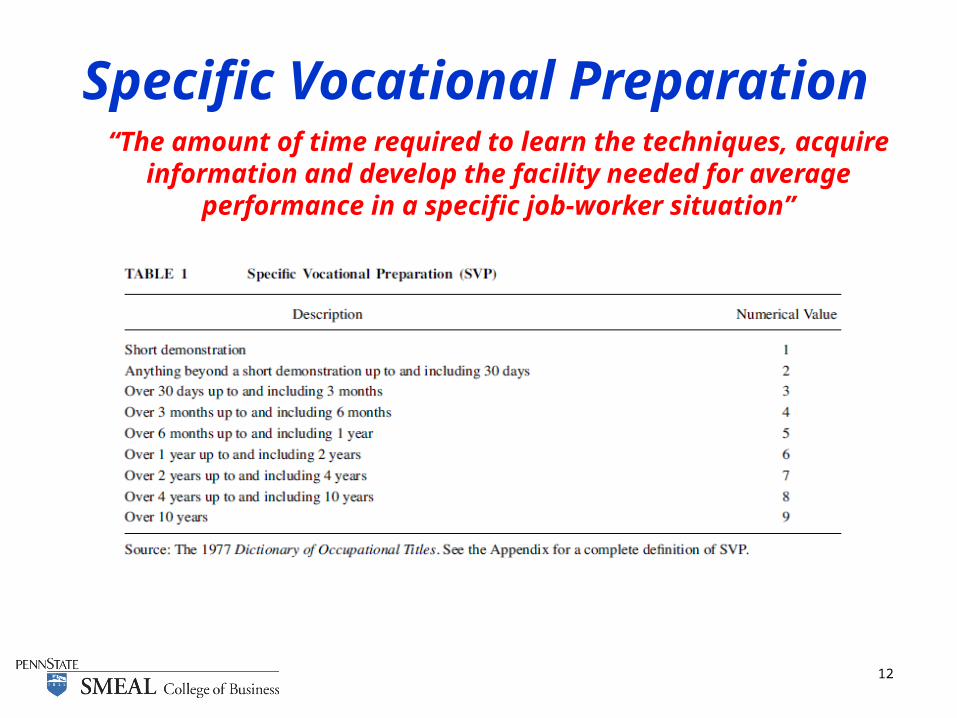
Specific Vocational Preparation“The amount of time required to learn the techniques, acquire
information and develop the facility needed for average performance in a specific job-worker situation”
13
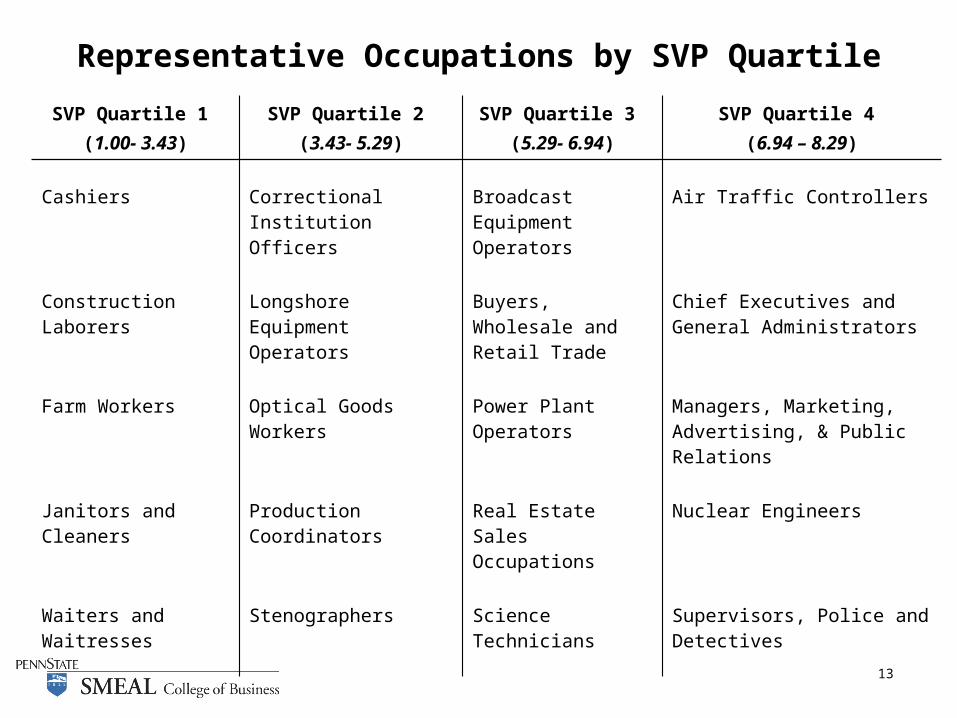
Representative Occupations by SVP Quartile
SVP Quartile 1 (1.00- 3.43)
SVP Quartile 2 (3.43- 5.29)
SVP Quartile 3 (5.29- 6.94)
SVP Quartile 4 (6.94 – 8.29)
Cashiers Correctional Institution Officers
Broadcast Equipment Operators
Air Traffic Controllers
Construction Laborers Longshore Equipment Operators
Buyers, Wholesale and Retail Trade
Chief Executives and General Administrators
Farm Workers Optical Goods Workers Power Plant Operators
Managers, Marketing, Advertising, & Public Relations
Janitors and Cleaners Production Coordinators Real Estate Sales Occupations
Nuclear Engineers
Waiters and Waitresses
Stenographers Science Technicians Supervisors, Police and Detectives

14

15
minimum (3.02)
25th pctile (4.34)
50th pctile (5.12)
75th pctile (5.55)
maximum (6.77)
$0
$200,000
$400,000
$600,000
$800,000
$1,000,000
$1,200,000
$1,400,000
$659,216
$809,694
$899,924$948,628
$1,087,458
Predicted Lifetime Benefit
Job Attachment
1987
do
llars

16
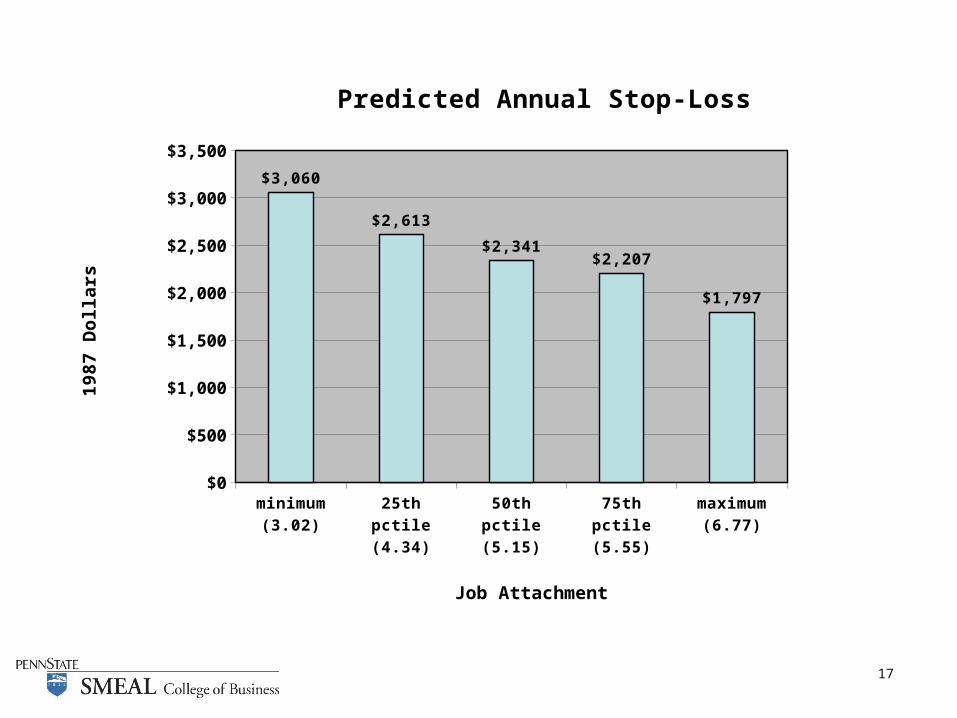
17
minimum (3.02)
25th pctile (4.34)
50th pctile (5.15)
75th pctile (5.55)
maximum (6.77)
$0
$500
$1,000
$1,500
$2,000
$2,500
$3,000
$3,500
$3,060
$2,613
$2,341$2,207
$1,797
Predicted Annual Stop-Loss
Job Attachment
1987
Do
llars

18
Conclusions
• There is a clear and strong relationship between the stability of the pool, as measured by job attachment, and the ability of insurers to offer more generous healthcare coverage
• Proposals to supplant employee group plans with individual market alternatives should be viewed with caution