Embed Size (px)
Citation preview

1
Economic Efficiency and the Role of Government 1 Hall & Lieberman Chapter 14
Defining Economic Efficiency
Pareto improvement Measuring Losses in Efficiency
Consumer Surplus
Producer Surplus

2
Economic Efficiency and the Role of Government
• Virtually every disagreement about the economy ultimately leads to government– Some disagreements start there as well
• All these disagreements tend to obscure a remarkable degree of agreement about the economy, and government’s role in it– Vast majority of goods and services that you buy in stores, over the
internet, or obtain in other ways • Are provided by private firms—and almost everyone agrees that’s how it should
be
• Widespread agreement that certain goods and services should be provided by government– Such as general police protection, the court system, and national defense
• Much of this agreement is based on ideas about economic efficiency

3
The Meaning of Efficiency
• Economists define efficiency in terms of the absence of waste:– Waste of an opportunity to make someone better off without
harming anyone else.– Economic efficiency is achieved when there is no way to rearrange
the production or allocation of goods in a way that makes one person better off without making anybody else worse off
• Notice that efficiency is very minimal requirement– An efficient economy is not necessarily a fair economy– Under this criteria, an efficient allocation of resources would
include having a single person own and control everything.• Economics can make a major contribution to our material
well being by– Helping us understand the preconditions for economic efficiency, – Teaching us how we can bring about those preconditions

4
Pareto Improvements
• A pareto improvement is a trade in which both parties are made better off, and no one is harmed– Pareto improvements provide the basic reason for trade– Named after Italian economists, Vifredo Pareto (1848-
1923)– First systematically explored the issue of economic
efficiency• Economic efficiency is achieved when every
possible Pareto improvement is exploited• Perfectly competitive markets tend to be
economically efficient, and – Well-functioning market economics tend to lie close to
the economically efficient end of the spectrum
5
Side Payments and Pareto Improvements
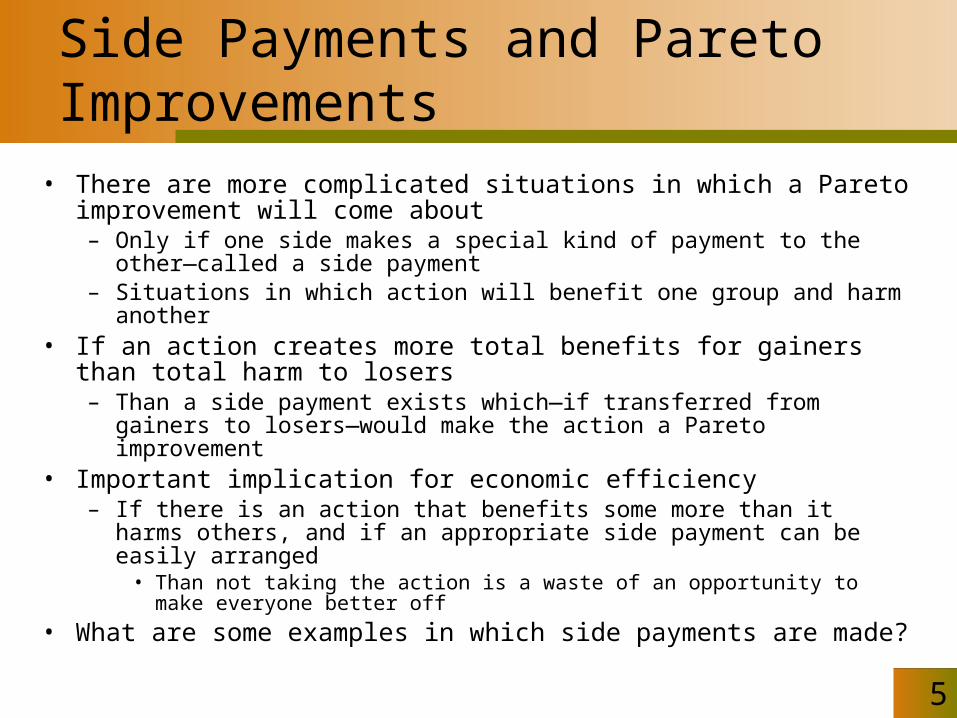
• There are more complicated situations in which a Pareto improvement will come about– Only if one side makes a special kind of payment to the other—called a
side payment– Situations in which action will benefit one group and harm another
• If an action creates more total benefits for gainers than total harm to losers– Than a side payment exists which—if transferred from gainers to losers—
would make the action a Pareto improvement• Important implication for economic efficiency
– If there is an action that benefits some more than it harms others, and if an appropriate side payment can be easily arranged
• Than not taking the action is a waste of an opportunity to make everyone better off
• What are some examples in which side payments are made?

6
Markets and Economic Efficiency
• In a market system, firms and consumers are largely free to produce and consume as they wish, without anyone orchestrating the process from above
• As long as trading takes place in perfectly competitive markets, we can expect economic efficiency to result– To demonstrate this, we’ll return to Demand
and supply curves• But we’ll look at them in a slightly different way

7
Reinterpreting the Demand Curve
• Figure 1 shows a market demand curve for guitar lessons– Quantity demanded per week at each price
• Also indicates who would be taking each lesson• Both the individual and market demand curves indicate the quantity of
a good that would be demanded at a given price• But we can also view the curve in a different way
– Maximum price someone would be willing to pay for each unit of good– Tells us how much that unit is worth to the person who buys it
• Each guitar lesson in the market has a different value– In part, this is because consumers differ in their incomes and tastes
• But also—for each individual—value of additional lessons declines as more lessons are taken– Height of market demand curve at any quantity shows us value—to
someone—of last unit of good consumed

8
Figure 1: The Marginal Benefit From Guitar Lessons
1 2 3 4 5
$25$23$21$19$17
Demand
Flo
Flo (again)Joe
BoZoe
Price
Number of Lessons per Week
While the first lesson is worth $25 to some consumer (Flo) . . .
and the third is worth $21.
the second lesson is worth only $23 . . .

9
Reinterpreting the Supply Curve
• Now let’s look at supply side of the market– Figure 2 shows supply curve for guitar lessons—quantity offered each
week at various prices– Indicates who would be supplying each lesson
• Supply curve also tells us the minimum price a seller must get in order to supply that lesson
• Height of market supply curve at any quantity shows additional cost—to some producer—of each unit of good supplied
• Why does it take higher prices to get more lessons?– As any one teacher devotes more and more time to giving lessons,
opportunity cost of his time will rise– Giving more lessons means less time left for other activities– As leftover time becomes scarcer, value of each remaining hour rises

10
Figure 2: The Marginal Costs of Guitar Lessons
The smallest cost for this first lesson is $13 . . .
and $17 for the third.
but it's $15 for the second . . .
1 2 3 4 5
$21$19$17$15$13
McCollum
Supply
Martin (again)Gibson
Martin (again)Martin
Price
Number of Lessons per Week
11
The Efficient Quantity of a Good
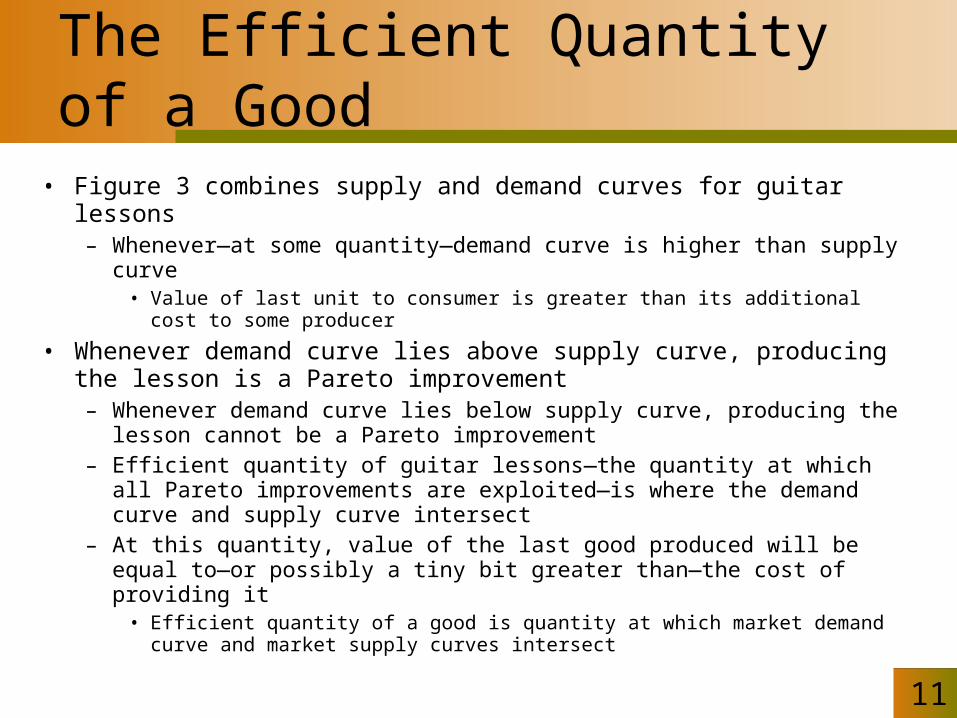
• Figure 3 combines supply and demand curves for guitar lessons– Whenever—at some quantity—demand curve is higher than supply curve
• Value of last unit to consumer is greater than its additional cost to some producer
• Whenever demand curve lies above supply curve, producing the lesson is a Pareto improvement– Whenever demand curve lies below supply curve, producing the lesson
cannot be a Pareto improvement– Efficient quantity of guitar lessons—the quantity at which all Pareto
improvements are exploited—is where the demand curve and supply curve intersect
– At this quantity, value of the last good produced will be equal to—or possibly a tiny bit greater than—the cost of providing it
• Efficient quantity of a good is quantity at which market demand curve and market supply curves intersect

12
Figure 3: Efficiency In The Market For Guitar Lessons
$25$23$21$19$17$15$13 Demand
1. Joe would pay as much as $23 for the second lesson . . .Flo
Flo
Joe
McCollumMartin
Zoe
Supply
2. while Martin would offer it for as little as $15.
1 5
Martin
GibsonMartin
3. Four lessons is the equilibrium and the efficient quantity.
Price
Number of Lessons per Week2 3 4
Bo
13
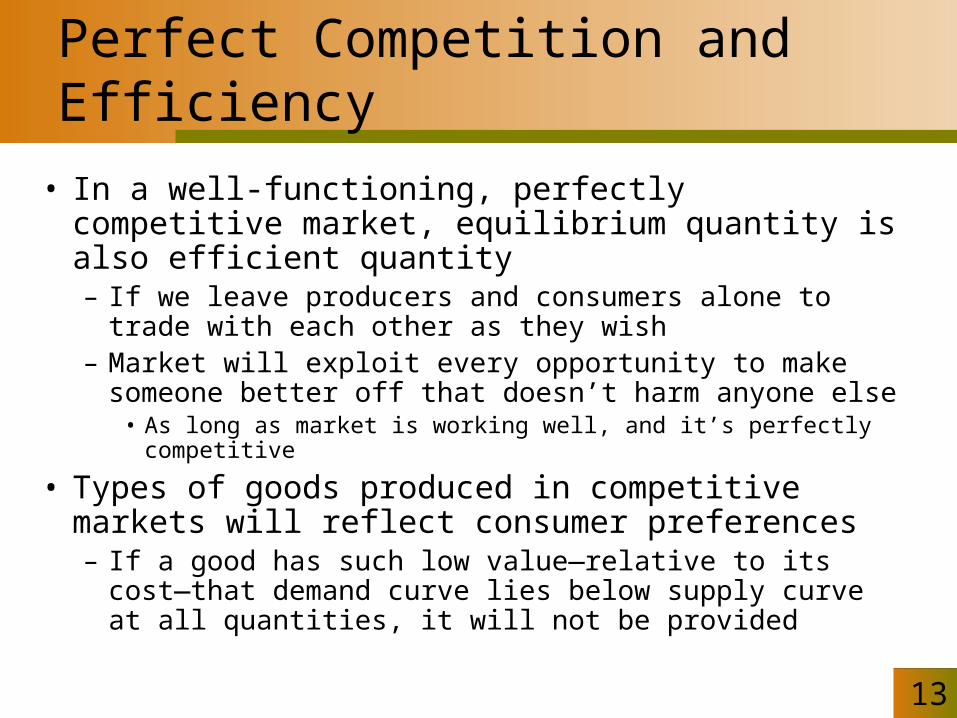
Perfect Competition and Efficiency
• In a well-functioning, perfectly competitive market, equilibrium quantity is also efficient quantity– If we leave producers and consumers alone to trade
with each other as they wish– Market will exploit every opportunity to make someone
better off that doesn’t harm anyone else • As long as market is working well, and it’s perfectly competitive
• Types of goods produced in competitive markets will reflect consumer preferences– If a good has such low value—relative to its cost—that
demand curve lies below supply curve at all quantities, it will not be provided

14
Perfect Competition and Efficiency
• The notion that perfect competition—where many buyers and sellers each try to do the best for themselves—actually delivers an efficient economy is one of the most important ideas in economics– Adam Smith coined term ‘invisible hand’ to describe the
force that leads a competitive economy relentlessly and automatically toward economic efficiency
• Recognize the end promoted by invisible hand as economically efficient outcome

15
Property Rights
One of the key elements needed for a well-functioning market is a well-defined set of property rights, including four key charateristics:
- Universality:requires that all resources are privately owned and all entitlements completely specified.
- Exclusivity:requires that all benefits and costs accrued as the result of owning and using the resources should accrue to the owner, and only the owner, either directly or indirectly by sale to others.
- Transferability:requires that all property rights should be transferable from one owner to another in a voluntary exchange.
- Enforceability:requires that property rights should be secure from seizure or encroachment by others.
16
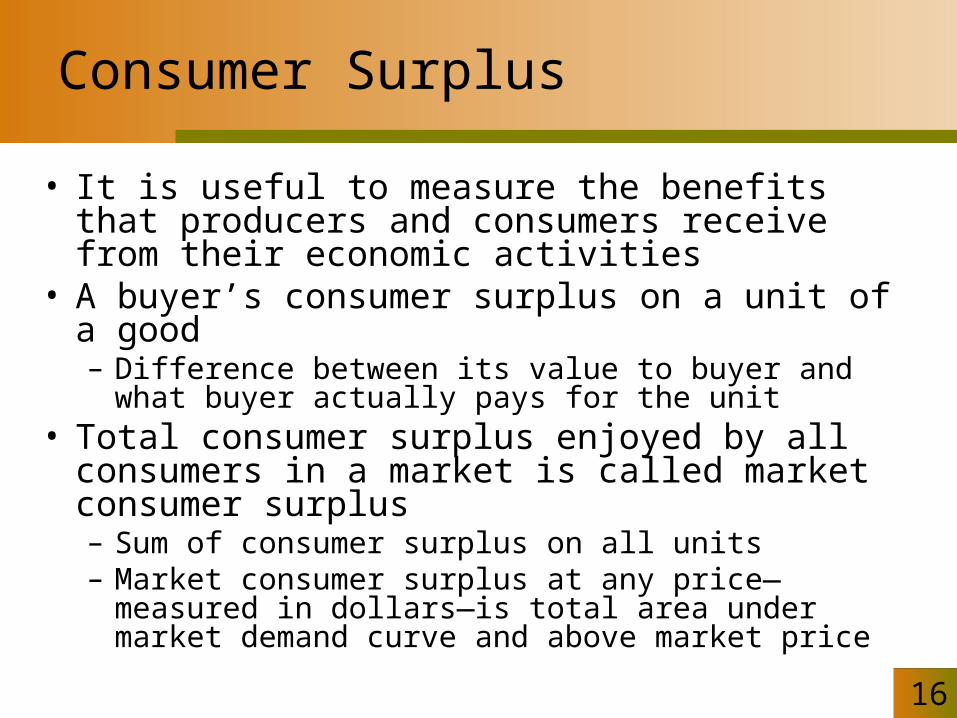
Consumer Surplus
• It is useful to measure the benefits that producers and consumers receive from their economic activities
• A buyer’s consumer surplus on a unit of a good– Difference between its value to buyer and what buyer
actually pays for the unit• Total consumer surplus enjoyed by all consumers
in a market is called market consumer surplus– Sum of consumer surplus on all units– Market consumer surplus at any price—measured in
dollars—is total area under market demand curve and above market price

17
Figure 4(a): Consumer Surplus in a Small and Large Market for Guitar Lessons
1 2 3 4 5
$25$23$21$19$17
Demand
The total shaded area is market consumer surplus.
(a)
Price
Number of Lessons per Week
1. When market price is $19, someone (Flo) gets $6 in consumer surplus on the first lesson . . .
3. and someone (Flo again) gets $2 in consumer surplus on the third.
2. someone (Joe) gets $4 in consumer surplus on the second . . .
Assumed Market Price
18
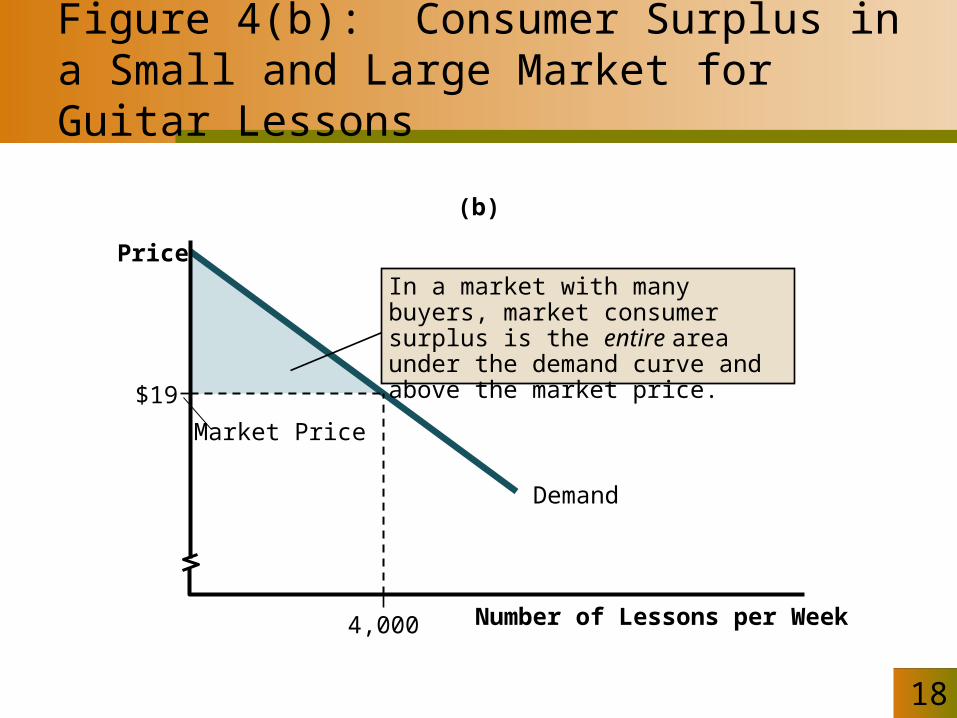
Figure 4(b): Consumer Surplus in a Small and Large Market for Guitar Lessons
4,000
$19
Market Price
(b)
Price
Number of Lessons per Week
In a market with many buyers, market consumer surplus is the entire area under the demand curve and above the market price.
Demand

19
Producer Surplus
• An individual seller’s producer surplus on a unit of a good – Difference between what seller actually gets and
additional cost of providing it
• Total producer surplus gained by all sellers in a market is called market producer surplus– Found by adding up producer surplus gained by all
sellers in market– Market producer surplus at any price—measured in
dollars—is total area above market supply curve and below market price

20
Figure 5(a): Producer Surplus From Selling Guitar Lessons
1 2 3 4
$21$19$17$15$13
Supply
(a)
Price
Number of Lessons per Week
The total shaded area is market producer surplus.
3. and someone (Gibson) gets $2 on the third.
1.When market price is $19, someone (Martin) gets $6 in producer surplus on the first lesson . . .
2. someone (Martin again) gets $4 in producer surplus on the second . . .
Assumed Market Price
5

21
Figure 5(b): Producer Surplus From Selling Guitar Lessons
4,000
$19
In a market with many sellers, market producer surplus is the entire area above the market supply curve and below the market price.
Price
(b)
Number of Lessons per Week
Supply
Market Price

22
Total Net Benefits in a Market
• Measure total net benefits gained in a market as– Sum of consumer and producer surplus in that
market
• In Figure 6– Blue shaded area represents market consumer
surplus– Pink shaded area is market producer surplus– Total shaded area represents total net benefits

23
Figure 6: Total Net Benefits in aCompetitive Market for Guitar Lessons
$19
4,000
S
D
Equilibrium Price
Price
Equilibrium Quantity

24
Perfect Competition and Efficiency: The Total Benefits View
• Each time we make a Pareto improvement in a market– We make at least one party better off and make no one else worse
off– Therefore, a Pareto improvement will increase total net benefits
available in a market – Thus, we have a new way of viewing efficiency
• A market is efficient when sum of producer and consumer surplus is maximized in that market
• In a well-functioning, perfectly competitive market– Equilibrium quantity provides maximum possible benefit to buyers
and sellers combined, and is the efficient quantity

25
A Price Ceiling
• Creates greater harm for sellers than gains for buyers– Reduces total net benefits in the market in a perfectly
competitive market• Welfare loss in a market is dollar value of potential
benefits not achieved due to inefficiency in that market
• Although a price ceiling may benefit consumers as a group it will always reduce total net benefits in the market
26
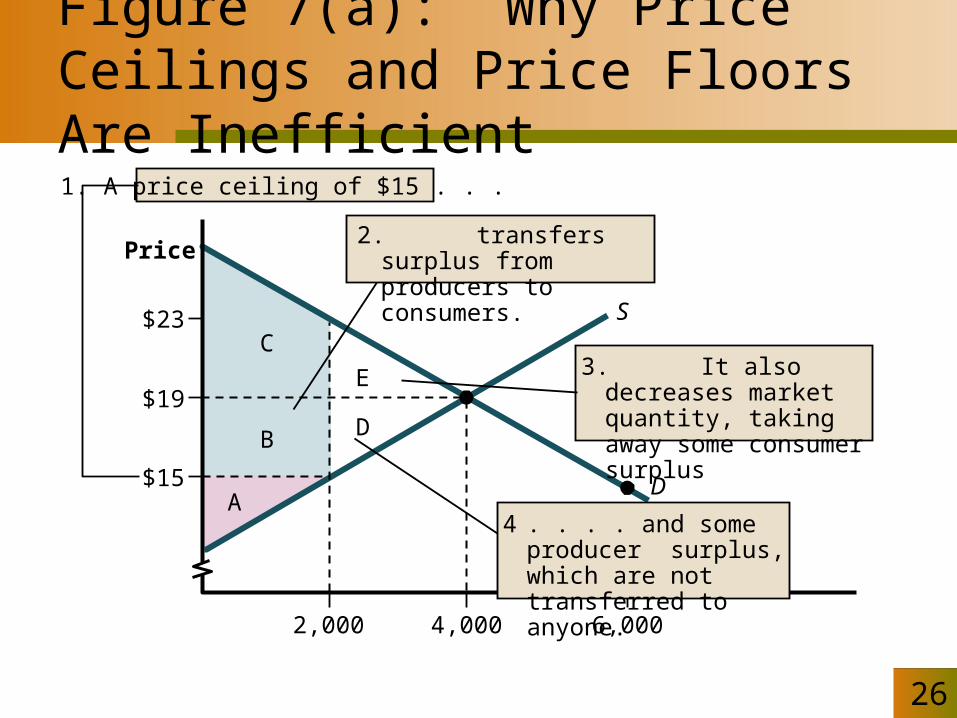
Figure 7(a): Why Price Ceilings and Price Floors Are Inefficient
$19
4,000
S
$15
6,0002,000
D
Price
1. A price ceiling of $15 . . .
3. It also decreases market quantity, taking away some consumer surplus
A
B D
E
C$23
2. transfers surplus from producers to consumers.
4 . . . . and some producer surplus, which are not transferred to anyone.

27
Figure 7(b): Why Price Ceilings and Price Floors Are Inefficient
3. It also decreases market quantity, taking away some consumer surplus
$19
4,000
S
$21
3,000
D
Price
1. A price floor of $21 . . .
A
B
D
E
C
2. transfers surplus from consumers to producers.
$17
5,000
4 . . . . and some producer surplus, which are not transferred to anyone.

28
Calculating the Welfare Loss
• Let’s calculate dollar value of welfare loss caused by price ceiling– Area of unshaded triangle formed by areas D and E
together• From high school algebra, area of any triangle is ½ x base x
height
• Welfare loss = ½ x base x height = ½ x $8 x 2,000 = $8,000
• When this market is delivering only 2,000 lessons per week instead of the efficient 4,000– Guitar teachers and students together lose $8,000 in
potential benefits per week or– Welfare loss would be 52 weeks x $8,000 per week =
$416,000 per year
29
A Price Floor
• In a perfectly competitive market, the price floor will always shrink total net benefits
• Reduces total benefits in market (causes a welfare loss)

30
The Efficiency Role of Government
• When a well-functioning, perfectly competitive market is permitted to reach its equilibrium, the outcome is efficient– No opportunities for mutual gain remain unexploited– Any government intervention that changes the market quantity
(say, a price ceiling or a price floor) will create inefficiency—a welfare loss
• But government can—and does—contribute to the economic efficiency of markets– Provides infrastructure that permits markets to function
• Physical infrastructure—bridges, airports, waterways, and buildings• Institutional infrastructure—laws, courts, and regulatory agencies
– Stepping in when markets are not working properly• When they leave Pareto improvements unexploited and therefore fail
to achieve economic efficiency