Embed Size (px)
Citation preview

1
Dust Impacts on the 20% Worst Visibility Days
Vic Etyemezian,
David Dubois,
Mark Green,
and
Jin Xu

2
Improve Sites in 1997 (black) and 2002 (all)

3
SPECIES FORMULA ASSUMPTIONS POSSIBLE SOURCES
SULFATE 4.125[S] All elemental S is from sulfate. All
sulfate is from ammonium sulfate. Fossil fuel combustion
NITRATE 1.29[NO3] Denuder efficiency is close to 100%. All nitrate is from ammonium nitrate.
Industrial and automobile emissions, organic decomposition
Organic Mass by Carbon (OMC) 1.4 * OC Average organic molecule is 70%
carbon.
Biomass burning, automobile emissions, fossil fuel combustion, gas-to-particle conversion of hydrocarbons
Light absorbing Carbon (LAC)
EC1+EC2+EC3-OP (see definitions below)
Incomplete combustion of fossil and biomass fuels
SOIL (fine soil) 2.2[Al]+2.49[Si]+1.63[Ca] +2.42[Fe]+1.94[Ti]
[Soil K]=0.6[Fe]. FeO and Fe2O3 are equally abundant. A factor of 1.16 is used for MgO, Na2O, H2O, CO2.
Desert dust, construction, road Dust
CM (coarse mass) [PM10] - [PM2.5] Consists only of insoluble soil particles Crushing or grinding operations, dust from paved or unpaved roads
Bext = 3F(RH)[Sulfate] + 3F(RH)[Nitrate] + 4[OMC] + 10[LAC] + 1[Soil] + 0.6[CM]+
10 (Rayleigh Gas Scattering)
Reconstructed Light Extinction Coefficients
4
20% Worst Days
• After sorting the reconstructed light extinction coefficient values of site X in year Y from lowest to highest, the days with light extinction coefficients above the 80th percentile value are considered 20% worst days in terms of visibility.

5
For This Presentation
• “Dust” = Coarse Mass (CM) + Fine Soil (FS)
• “Visibility extinction due to dust” is portion of Bext that is due to CM + FS
• Unless otherwise stated, data shown for 1997-2002
• Unless otherwise stated, Bext does NOT include Rayleigh scattering
• Some sites have longer record than others

6
Sources of “Dust” – CM+FS• Regional Windblown• Local Windblown• Road Dust• Construction• Mining• Agriculture• Asian Origin• African Origin• Organic debris• Wildfires• Volcanoes• Sea spray• Other

7
Fractional Contribution of Dust to Aerosol Extinction For All Worst Days

8
Absolute Contribution of Dust to Aerosol Extinction For All Worst Days (Mm-1)

9
Fraction of Worst Days When Dust Contributed 15% or more to Aerosol Extinction

10
Fraction of Worst Days When Dust Contributed more to Aerosol Extinction than Any Other Component
(NO3, SO4, OMC, LAC)

11
Q1 Q2
Q3 Q4
Seasonal Patterns:
Fraction of worst days when dust was principal component of extinction in each quarter.
LegendSummary_Dust_Seasonal.Q1
0.000000 - 0.100000
0.100001 - 0.200000
0.200001 - 0.300000
0.300001 - 0.400000
0.400001 - 0.500000
0.500001 - 1.000000

12
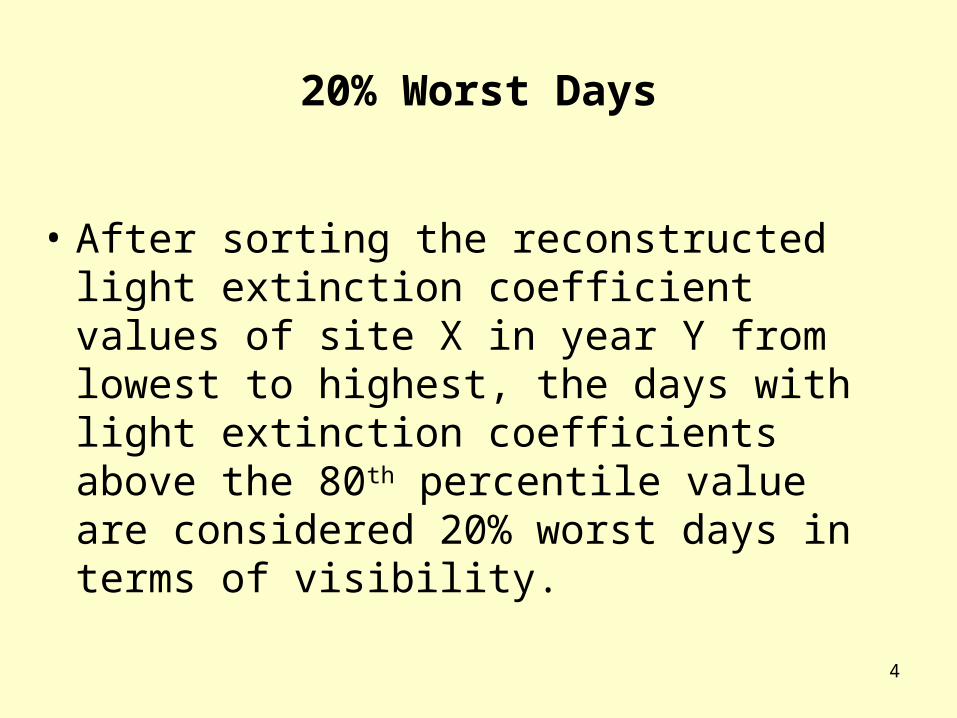
Example 1:Regional Windblown Dust Event
13
Regional Windblown Dust 4/26/02

14
Regional Windblown Dust 4/26/02
Percent of BextLocation Site_Name Bext (Mm-1) State Soil% CM/% Dust% CM/SoilBAND1 Bandelier National Monument 33.0 NM 11.4% 49.0% 60.4% 4.3BOAP1 Bosque del Apache 74.9 NM 13.2% 61.7% 74.9% 4.7CHIR1 Chiricahua National Monument 42.7 AZ 11.3% 70.5% 81.8% 6.2GICL1 Gila Wilderness 22.0 NM 17.4% 48.1% 65.5% 2.8MEVE1 Mesa Verde National Park 28.1 CO 21.4% 48.7% 70.1% 2.3PEFO1 Petrified Forest National Park 31.3 AZ 14.3% 64.6% 79.0% 4.5QUVA1 Queen Valley 49.5 AZ 17.0% 66.6% 83.5% 3.9SACR1 Salt Creek 47.1 NM 2.3% 17.1% 19.4% 7.5SAPE1 San Pedro Parks 21.2 NM 14.8% 32.0% 46.8% 2.2SAWE1 Saguaro West 47.7 AZ 15.7% 66.3% 82.0% 4.2WEMI1 Weminuche Wilderness 20.2 CO 13.2% 41.9% 55.1% 3.2WHIT1 White Mountain 84.3 NM 11.1% 45.6% 56.7% 4.1
Min 20.2 2.3% 17.1% 19.4% 2.2Max 84.3 21.4% 70.5% 83.5% 7.5
Average 41.8 13.6% 51.0% 64.6% 4.2

15
Surface Weather 4/26/04 ~ 5:00 PM Local time

16
NRL Model Prediction (WestPhal & Co) ~ 5:00 PM Local time
17
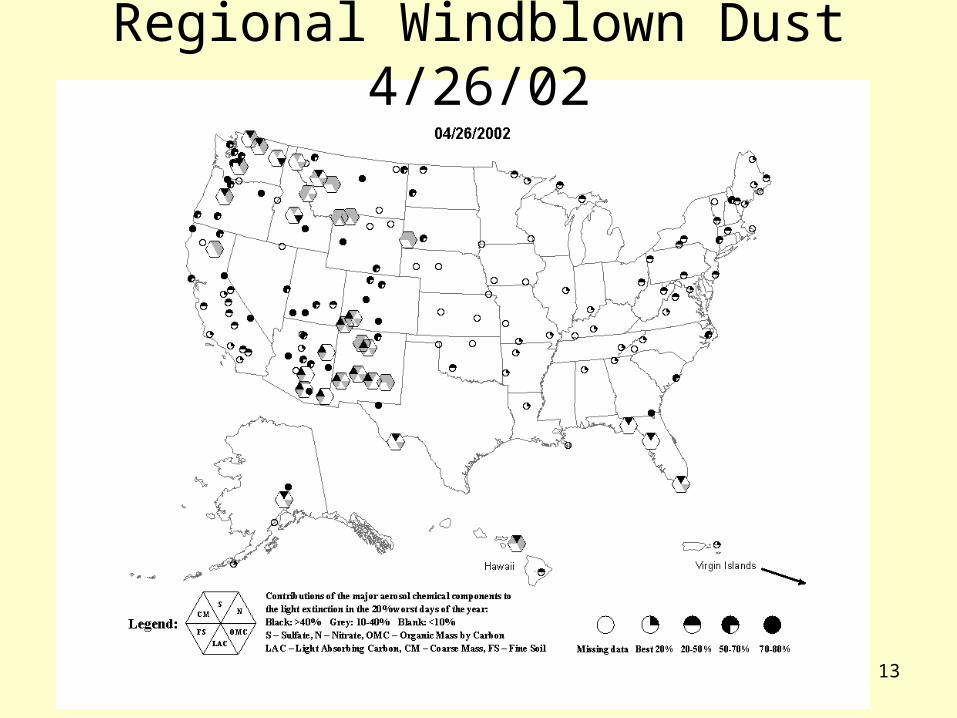
Supplemental Met and PM Data
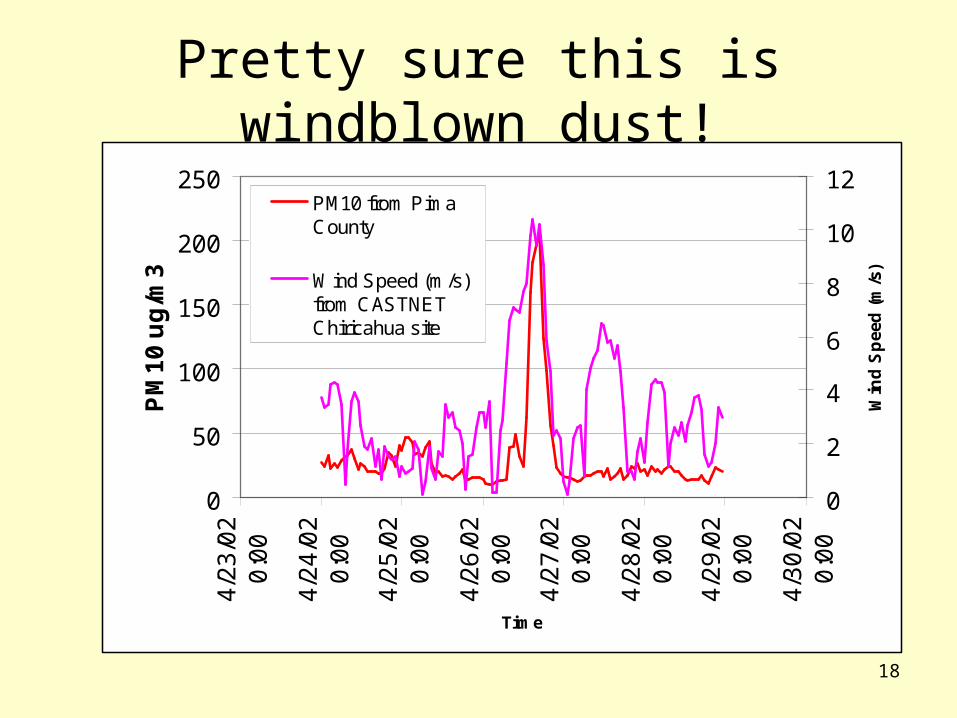
18
0
50
100
150
200
250
4/2
3/0
20
:00
4/2
4/0
20
:00
4/2
5/0
20
:00
4/2
6/0
20
:00
4/2
7/0
20
:00
4/2
8/0
20
:00
4/2
9/0
20
:00
4/3
0/0
20
:00
Time
PM
10
ug
/m3
0
2
4
6
8
10
12
Win
d S
pee
d (
m/s
)
PM10 from PimaCounty
Wind Speed (m/s)from CASTNETChiricahua site
Pretty sure this is windblown dust!

19
Example 2: Asian Dust

20
2001 Asian Dust Episode (4/16)

21
Asian Dust
• During the spring season, the desert regions in Mongolia and China are massive sources of mineral aerosols
• Aerosol particles emitted from the Northwest desert region of China may have a significant influence over Eastern Asia, the Northern Pacific and even as far away as North America
• Recent work suggests that the frequency of dust storms in China has increased in the last few decades

22
The Asians Don’t Like It Either
Winds in excess of 60 mph can suspend enormous amounts of dust from a very large region

23
2001 Asian Dust Episode (4/16)

24
2001 Asian Dust Episode (4/16)

25
Properties of Asian Dust
• Average CM:FS
– All 2001 WRAP Worst days caused by dust (except 4/16/01): 4.6
– All WRAP sites when 4/16/01 was worst day: 0.93
• Average K:Fe
– 2001 WRAP sites average: 0.91
– 4/16/01 worst day sites: 0.5
• Average Al:Si
– 2001 WRAP sites average: 0.2
– 4/16/01 worst day sites: 0.5

26
Example 3:Local Windblown Dust?

27
Single-site dust in Montana 7/27/01

28
Example of hazagons of confirmed fires in NV, WA, OR, ID

29

30
Surface weather ~ 5:00 PM Local Time

31

32

33
EPA AIRS Air Quality Monitors in Adjacent Counties
0
50
100
150
200
250
7/2
4/0
1 0
:00
7/2
5/0
1 0
:00
7/2
6/0
1 0
:00
7/2
7/0
1 0
:00
7/2
8/0
1 0
:00
7/2
9/0
1 0
:00
7/3
0/0
1 0
:00
7/3
1/0
1 0
:00
AIR
S P
M1
0 m
on
ito
r (u
g/m
3)
0
5
10
15
20
25
30
Win
d S
pe
ed
Gu
sts
at
RA
WS
Sta
tio
n (
mp
h)
Missoula
Lewis & Clark
Lake
Wind gusts (mph)

34

35
Moral of the Story: For this case nothing jumps out immediately as a
convincing “most likely” cause of the dust haze in Montruse

36
Another Resort: Chemistry
Example Jarbridge WA Cross-Correlation Plots

37
Some Things to Think About
• Should this Type of Analysis be done for every 20% worst day at every site in WRAP?
• OR is there a semi-systematic approach that can be used instead of brute force method?
• What types of information can we expect to learn?

38
Should This Analysis Be Done for Every Worst Day at Every WRAP
Site?
• # of 20% Worst Site-Days in WRAP Region– Between 1997 and 2003*: 6,839– Between 2001 and 2003* : 5,838– Between 2001 and 2003* AND
• Dust significant contributor (>15% of Bext): 2,392
• Dust principal contributor (greatest Bext): 899
• *2003 Data Available ~ October, 2004

39
Should “Episode Analysis” Be Done for Each of the 899 Cases
– Analyst can research and document 2 – 4 cases a day
– OR ~ 1 – 2 labor years - $$$$.– Not clear that this will result in a useful
explanation of “dust” for every case– Will have to be repeated in the future – if
desired

40
Can a semi-systematic, less ambitious, method be used?
• Look closely at a subset of worst days with dust as a dominant source
• Find commonalities among “like” events and differences between “unlike” events
• Use a set of criteria to place all remaining worst days into one of several categories according to “most likely source type”

41
How can this be done?
• Local and Regional Windblown dust1. For each site, identify a nearby meteorological
station that can provide reasonably representative wind speed data
2. Look at Wind Speed vs. Coarse Mass to estimate a threshold value for windblown dust at that site
3. Check if on a particular worst day with dust as dominant haze component
a. threshold value is exceeded b. ratio of Coarse Mass to Fine Soil above a predetermined
value
4. If so, categorize as Windblown Dust

42
Determining Threshold Wind Speed for Windblown Dust
0
100
200
300
400
500
600
700
800
900
0 2 4 6 8 10 12
Chiricahua Average WS (M/S)
PIM
A P
M1
0 (
ug
/m3
)

43
Windblown Dust
• 1 site affected – “Local Windblown” dust
• Multiple sites affected – “Regional Windblown”

44
Asian Dust
• Tendency to have large regional influence• Compare CM:FS ratio to predetermined value
(nominally 1 or less means long-range transport)• Inspect chemical signature (K/FE, Al/Si)• Identify a possible corresponding Asian Dust
Event (E.g. Using NRL model)• Inspect air mass trajectories• If all points to Asian origin then “Asian Dust”

45
Other Sources
• Construction: Unless close to monitor, likely infrequent and mixed with urban plume. Difficult to identify unless well-documented
• Road Dust: Same as Construction. If from urban source, urban air quality monitors might help. Signature of exhaust might help.
• Mining: Is there a mine within one day’s transport of site? Do trajectories show this as possible? Can chemistry be used as a tracer
• Agriculture: Could be substantial, depending on season. Difficult to confirm individual event occurrence. E.g. “Did Farm X harvest almond on Date Y?”

46
Other Sources
• African Dust: Can use same approach as Asian dust, though probably very infrequent cause of worst day
• Organic debris: Can be related to agriculture. Probably seasonal. Probably shows different CM:FS ratio than windblown
• Wildfires, Volcanoes: Were there any wildfires or volcano eruptions nearby? Ratios of FS:Organic, K:FS, CM:FS can help.
• Sea Spray: Probably impacts coastal sites (if any in WRAP). Na and Cl content and ratio of CM:FS can help

47
The “Other” Category
• For some cases, multiple sets of criteria would be met– Depending on # of such cases, inspect individually,
try to find supplemental information• For some cases, no set of criteria is met
satisfactorily– These will go into “Other” category. Can Happen
when:• Inadequate met data• Multiple sources in comparable quantities• Criteria set incorrectly• Unforeseen/undocumented source• Just Because

48
Summary of Method
• Consider only 2001-2003 20% worst days in WRAP at sites where dust (CM+FS) is dominant haze constituent
• Inspect subset of those days for useful trends to include known days for impacts from major source types
• As much as reasonable, place each worst day into category based on defined criteria. # of categories determined by how well the criteria can be defined
49
What Can We Learn? Pros and Cons of Method
• Cons:– Limited to worst days dominated by dust haze– Does not give “source apportionment” for any particular day– Some difficulties likely in determining source category for some
worst days• Pros:
– A mix of reasoning and brute force - optimize ratio of outcome to resources utilized
– Leverages many of the same tools currently used in Causes of Haze Assessment (COHA)
– Provides a first stab at a methodology that can be improved in the future
– Provides insight into knowledge gaps– Likely to result in accounting for the most frequent causes of
dust haze– Can be completed in 1 year or so

50
Discussion?

51
2001 Asian Dust Episode (4/16-4/19)

52
Ratio of Coarse Mass to Fine Soil Extinction
Average Contributions of Major Checm ial Com ponnents to Light Extinction for 68 WRAP Sites (1997-2001 April Average)
Sulfate36%
Nitrate15%
OC20%
EC7%
FS7%
CM15%
Average Contributions of Major Checm ial Com ponnents to Light Extinction for 68 WRAP Sites (April 16, 2001)
Sulfate28%
Nitrate14%
OC14%
EC3%
FS21%
CM20%
Average for 68 WRAP sites in April over period 1997-2001
Average for 68 WRAP sites 4/16/2001
On 4/16/01, 45 of the 68 WRAP IMPROVE monitoring sites were in 20% worst case days of the year 2001. Up to 11 more were worst case days on 4/19/01.

53
Other 2001 Worst Days at Mont1
1.813.4%8.6%4.8%65.820010510
3.512.1%9.4%2.7%49.120011001
4.58.4%6.9%1.5%48.420011004
2.430.9%21.8%9.2%47.620010817
4.412.0%9.8%2.2%44.920010814
3.310.4%7.9%2.4%44.820010928
4.121.7%17.4%4.2%40.120010925
8.02.6%2.3%0.3%39.920010113
6.72.8%2.4%0.4%39.120011115
11.512.9%11.9%1.0%38.320011109
2.152.3%35.4%16.8%32.220010829
2.632.2%23.2%9.0%29.920010820
1.420.2%11.7%8.6%28.720010507
2.025.5%16.9%8.6%28.020010913
4.617.0%14.0%3.0%26.820011007
3.556.8%44.1%12.7%26.820010727
3.451.4%39.7%11.7%26.720010724
1.936.4%24.1%12.4%26.720010823
2.120.3%13.8%6.5%26.420010513
2.946.2%34.5%11.7%25.820010904
7.21.9%1.6%0.2%24.920011025
2.514.5%10.4%4.2%24.520010519
3.917.5%13.9%3.6%24.320010525
CM%/Fine%Dust%CM/%Soil%BextDate