Embed Size (px)
Citation preview
1
Draft OECD Guidance document 1
Determination of in vitro intrinsic clearance using cryopreserved hepatocytes 2
(RT-HEP) or liver S9 sub-cellular fractions (RT-S9) from rainbow trout and 3
extrapolation to in vivo intrinsic clearance 4
Contents 5
1. General Introduction and Scope ..................................................................................................... 2 6
2. Selection of the in vitro system ....................................................................................................... 3 7
2.1 Biological and technical considerations ........................................................................................ 3 8
2.2 Comparison of in vitro intrinsic clearance rates ............................................................................ 4 9
3. Considerations specific for the test chemicals ................................................................................ 6 10
3.1 Analytical method ................................................................................................................... 6 11
3.2 Preparation of test chemical stock solutions ................................................................................ 6 12
3.3 Extraction solvents for stopping of the incubation and extraction of the test chemical .............. 7 13
3.4 Selection of test chemical concentrations .................................................................................... 7 14
3.5 Poorly water soluble test chemicals .............................................................................................. 8 15
3.6 Volatile test chemicals ................................................................................................................... 8 16
3.7 Adsorption of test chemicals ......................................................................................................... 9 17
3.8 Abiotic degradation of test chemicals ........................................................................................... 9 18
3.9 Ionised chemicals .......................................................................................................................... 9 19
3.10 Testing of chiral chemicals and structural isomers ..................................................................... 9 20
3.11 Mixtures as test chemicals ........................................................................................................ 10 21
4. Positive and negative control incubations .................................................................................... 10 22
4.1 Negative control incubations ................................................................................................ 10 23
4.1.1 Enzymatically inactive RT-HEP and RT-S9 ............................................................................. 10 24
4.1.2 Additional negative control incubations – RT-S9 ................................................................. 11 25
4.2 Positive control (reference chemical) incubations ................................................................ 11 26
5. In vitro-in vivo extrapolation and mass-balance model to predict bioconcentration factors ....... 13 27
5.1 In vitro-in vivo extrapolation and mass balance model to predict BCFs: theoretical 28
background ........................................................................................................................................ 13 29
6. Use of the spreadsheets for BCF predictions: practical application ............................................. 14 30
7. Interpretation and applications of predicted BCFs ....................................................................... 16 31
8. Other potential applications of the in vitro RT-HEP and RT-S9 assays .......................................... 17 32
9. References ..................................................................................................................................... 19 33
2
ANNEX 1 ................................................................................................................................................ 23 34
Abbreviations ........................................................................................................................................ 23 35
Annex 2 .................................................................................................................................................. 25 36
Preparation of room temperature inactivated RT-S9 ....................................................................... 25 37
Annex 3 .................................................................................................................................................. 26 38
Spreadsheets for calculation of BCFs using the hepatocyte-bioconcentration factor model (HEP-39
BCF) and the S9-bioconcentration factor (S9-BCF) model ................................................................ 26 40
Annex 4 .................................................................................................................................................. 32 41
Recommendations on how to proceed in case of substantial decreases of the test chemical in 42
enzymatically inactive (heat-inactivated) control incubations. ........................................................ 32 43
44
1. General Introduction and Scope 45
1. This Guidance Document accompanies OECD Test Guideline (TG) xx on Determination of in 46
vitro intrinsic clearance using cryopreserved rainbow trout hepatocytes (RT-HEP) (OECD xxxx) and on 47
Determination of in vitro intrinsic clearance using rainbow trout liver S9 sub-cellular fractions (RT-S9) 48
(OECD xxxx). It provides additional guidance on how to best perform these methods and apply 49
measured in vitro intrinsic clearance rates to predict chemical bioconcentration factor (BCF) for fish. 50
In addition, it describes potential applications for these methods apart from BCF prediction. 51
2. Biotransformation can reduce the extent to which chemicals accumulate in fish. Recent 52
research has led to development of a screening-level QSAR model for estimating biotransformation 53
rates (kMET) based on chemical structure (Arnot et al. 2009). This QSAR had been implemented in the 54
Arnot-Gobas bioaccumulation models (Arnot et al. 2003) within the U.S. EPA’s Estimation Program 55
Interface (EPI) Suite (U.S. Environmental Protection Agency 2013). Despite this progress, 56
biotransformation remains one of the greatest uncertainties in the prediction of bioaccumulation of 57
chemicals in fish. In vitro metabolizing systems which directly measure biotransformation rates using 58
fish hepatocytes or liver S9 sub-cellular fractions can be used as an alternative method to refine 59
bioconcentration factor (BCF) predictions (Nichols et al. 2006; Han et al. 2007; Cowan-Ellsberry et al. 60
2008). 61
3. Measured in vitro intrinsic clearance rates obtained from OECD TG RT-HEP or RT-S9 can 62
incorporated into in vitro-in vivo extrapolation models and used as inputs to existing chemical mass-63
balance models to predict a BCF (Nichols et al. 2013). 64
4. Chapter 2 gives some guidance on the selection of the in vitro system, i.e. OECD TG RT-HEP 65
or RT-S9, including biological and technical considerations, and an overview of published efforts to 66
compare both methods. 67
5. Chapter 3 focuses on specific considerations for the testing of chemicals regarding the 68
analytical method, chemical stock solutions, test chemical concentrations, quantification of chiral 69
chemicals or structural isomers, poor water solubility, volatility, adsorption, and abiotic degradation. 70
Furthermore, the testing of ionised chemicals and mixtures is briefly addressed. 71
3
6. Chapter 4 provides guidance on the use of negative control incubations (enzymatically 72
inactive RT-HEP and RT-S9) and positive control incubations using reference chemicals. 73
7. Chapter 5 introduces the in vitro-in vivo biotransformation extrapolation model and the 74
mass-balance bioconcentration model for fish, and gives some guidance on the application of these 75
models to calculate BCFs based on measured in vitro biotransformation rates. 76
8. Chapter 6 discusses other potential applications of these methods. 77
78
2. Selection of the in vitro system 79
9. This chapter aims to provide some guidance for the user on which in vitro system, i.e. OECD 80
TG RT-HEP or RT-S9, should be chosen. There are only limited numbers of studies published which 81
directly compare in vitro intrinsic clearance rates of the same set of chemicals in liver S9 sub-cellular 82
fractions and hepatocytes from the same fish species. 83
84
2.1 Biological and technical considerations 85
10. There are significant differences between the two in vitro systems which should be 86
considered before choosing one. Hepatocytes contain the whole set of metabolic enzymes and 87
cofactors at physiological levels (Li 2007). Thus, hepatocyte-based assays do not require addition of 88
cofactors for biotransformation studies. However, rate-limiting factors specifically associated with 89
hepatocytes may include cofactor depletion and / or restricted chemical diffusion across the cell 90
membrane as discussed for human hepatocytes (Godoy et al. 2013). 91
11. In contrast to liver S9 sub-cellular fractions, hepatocytes contain intact cell membranes. 92
Thus, uptake of the test chemical by passive diffusion or active transport is required for 93
biotransformation in hepatocytes (Li 2007). If uptake is rate-limiting on biotransformation, 94
hepatocytes may be closer to the in vivo situation and a more appropriate choice for the in vitro 95
system. 96
12. Liver S9 sub-cellular fractions are cell-free systems containing cytosolic and microsomal 97
enzymes, but require the addition of cofactors. Cofactors for Phase I (nicotinamide adenine 98
dinucleotide phosphate; NADPH) and the Phase II enzymes UDP-glucuronosyltransferases (uridine 5'-99
diphospho-glucuronic acid; UDPGA), sulfotransferases (3'-phosphoadenosine-5'-phosphosulfate; 100
PAPS) and glutathione transferases (glutathione; GSH) have to be added to the S9 incubations 101
(Johanning et al. 2012). The addition of alamethicin is needed reduce latency associated with 102
glucuronidation activity (Ladd et al. 2016). Other Phase II enzymes may be involved in the 103
biotransformation of certain chemicals like the conjugation of carboxylic groups with amino acids, 104
e.g. taurine (James 1987; Plakas et al. 1990). However, cofactors for these minor Phase II reactions 105
are currently not part of the standard S9 protocol. If it is known that such reactions play a role in 106
metabolism of a specific substrate, hepatocytes may be preferred over S9 fractions. 107
4
13. Both in vitro systems (OECD TG RT-HEP or RT-S9) are considered to have a limited working 108
lifetime due to a progressive loss of enzymatic activity. Hepatocytes are thought to maintain their 109
biotransformational integrity longer, so they may be preferred for assessing slowly metabolized 110
chemicals (Fay et al. 2015). Accumulating experience indicates that substrate depletion experiments 111
using RT-HEP incubations may be carried out up to 4 h (Fay et al. 2015), whereas the total incubation 112
time using RT-S9 should not generally exceed 2 h (Johanning et al. 2012). To date, the working 113
lifetime of these two preparations has not been rigorously established. However, for very slowly 114
biotransformed test chemicals up to 4 h may be possible. Therefore, the difference regarding 115
incubation time between the two assays seems to be minor. The lowest rate of in vitro activity which 116
can be reliably quantified is approximately 0.05/h to 0.14/h (Nichols et al. 2013; Chen et al. 2016). 117
14. The major advantage using liver S9 sub-cellular fractions compared to hepatocytes is the 118
ease of preparation and simpler shipment and storage conditions (i.e. shipment on dry ice and 119
storage at -80°C for S9 sub-cellular fractions vs. shipment in liquid nitrogen and storage in liquid 120
nitrogen or at -135°C for hepatocytes). 121
15. Liver S9 sub-cellular fractions are technically easier to use for substrate depletion 122
experiments compared to cryopreserved hepatocytes, which require more complex procedures for 123
proper thawing and handling of the cells (e.g. cell counting). As such, it may be possible to achieve 124
higher levels of chemical throughput using S9 fractions. In a ring trial of these two methods, intra- 125
and inter-laboratory variability in assay performance tended to be somewhat lower for RT-S9 than 126
for RT-HEP. This finding was attributed to variability among individual users with respect to cell 127
counting technique and viability determination. Generally, however, intra- and inter-laboratory 128
variability associated with both assays was quite low, indicating that both methods are highly reliable 129
(OECD xxxx). 130
131
2.2 Comparison of in vitro intrinsic clearance rates 132
16. There have been few direct comparisons of the hepatocyte and liver S9 sub-cellular fraction 133
assays. In a study by Han et al., in vitro activities determined using liver S9 sub-cellular fractions, liver 134
microsomes and freshly isolated hepatocytes from rainbow trout were compared for five chemicals. 135
Intrinsic clearance values (expressed as mL/h/106 cells) determined using microsomes and S9 sub-136
cellular fractions were 4.5 to 16.6-fold lower than those measured using hepatocytes (Han et al. 137
2009). In vitro depletion assays for 6 polycyclic aromatic hydrocarbons (PAHs) were performed 138
recently using cryopreserved rainbow trout hepatocytes (Fay et al. 2016), and predicted in vivo 139
intrinsic clearance values (CLIN VIVO, INT; mL/h/g liver) were compared to values predicted using existing 140
data from trout liver S9 sub-cellular fractions (Nichols et al. 2013). Importantly, the hepatocytes and 141
S9 sub-cellular fractions employed for this comparison were obtained from the trout of the same size 142
and strain, raised under similar conditions. Moreover, measured levels of chemical binding in both in 143
vitro systems were very similar indicating that for each test chemical the free (unbound) 144
concentration in both test systems was approximately the same. Predicted in vivo intrinsic clearance 145
rates (CLIN VIVO,INT) for 5 out of 6 PAHs, determined in cryopreserved hepatocytes, were in close 146
agreement with those determined using S9 sub-cellular fractions (<2.5-fold difference). For one 147
chemical (benzo[a]pyrene), the CLIN VIVO,INT determined using S9 fractions was ca. 10-fold higher than 148
that obtained using cryopreserved hepatocytes. Based on these findings, Fay et al. concluded that 149
5
both in vitro systems are well-suited for measuring intrinsic clearance rates in rainbow trout (Fay et 150
al. 2016). 151
17. In the ring trial performed to support development of OECD TG RT-HEP and TG RT-S9 (OECD 152
xxxx), in vitro intrinsic clearance rates for six chemicals were determined using both methods. When 153
these in vitro rates were extrapolated to in vivo intrinsic clearance values (CLIN VIVO, INT; mL/h/g liver), 154
the clearance rates calculated for each test chemical differed among the two test systems by no 155
more than a factor of 2, and were generally much closer. Moreover, there was no general trend 156
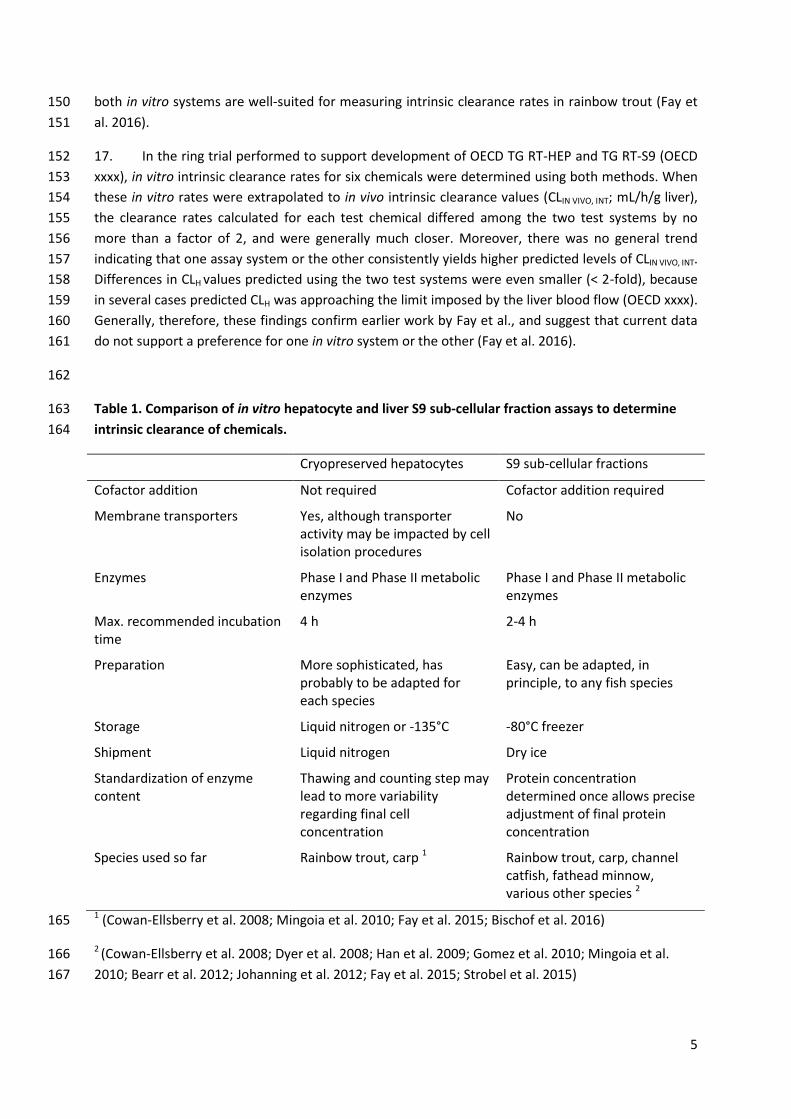
indicating that one assay system or the other consistently yields higher predicted levels of CLIN VIVO, INT. 157
Differences in CLH values predicted using the two test systems were even smaller (< 2-fold), because 158
in several cases predicted CLH was approaching the limit imposed by the liver blood flow (OECD xxxx). 159
Generally, therefore, these findings confirm earlier work by Fay et al., and suggest that current data 160
do not support a preference for one in vitro system or the other (Fay et al. 2016). 161
162
Table 1. Comparison of in vitro hepatocyte and liver S9 sub-cellular fraction assays to determine 163
intrinsic clearance of chemicals. 164
Cryopreserved hepatocytes S9 sub-cellular fractions
Cofactor addition Not required Cofactor addition required
Membrane transporters Yes, although transporter activity may be impacted by cell isolation procedures
No
Enzymes Phase I and Phase II metabolic enzymes
Phase I and Phase II metabolic enzymes
Max. recommended incubation time
4 h 2-4 h
Preparation More sophisticated, has probably to be adapted for each species
Easy, can be adapted, in principle, to any fish species
Storage Liquid nitrogen or -135°C -80°C freezer
Shipment Liquid nitrogen Dry ice
Standardization of enzyme content
Thawing and counting step may lead to more variability regarding final cell concentration
Protein concentration determined once allows precise adjustment of final protein concentration
Species used so far Rainbow trout, carp 1 Rainbow trout, carp, channel catfish, fathead minnow, various other species 2
1 (Cowan-Ellsberry et al. 2008; Mingoia et al. 2010; Fay et al. 2015; Bischof et al. 2016) 165
2 (Cowan-Ellsberry et al. 2008; Dyer et al. 2008; Han et al. 2009; Gomez et al. 2010; Mingoia et al. 166
2010; Bearr et al. 2012; Johanning et al. 2012; Fay et al. 2015; Strobel et al. 2015) 167
6
3. Considerations specific for the test chemicals 168
18. This section addresses considerations for the development of a robust test chemical 169
analytical method, including the selection of appropriate solvents for the preparation of test 170
chemical stock solutions and extraction solvents. Additional guidance is provided on the selection of 171
test chemical concentration and how to address potential issues such as poor water solubility, 172
volatility, adsorption, instability, ionization. The potential for applying these methods to chemical 173
mixtures is also discussed. In general, preliminary incubations with both active and enzymatically 174
inactive biological material should be performed in order to identify potential issues and optimize the 175
assay conditions. 176
19. The OECD guidance document 23 “Guidance Document on Aquatic Toxicity Testing of 177
Difficult Substances and Mixtures” (OECD 2000) provides further support for the testing of 178
substances and mixtures classified as “difficult to test”. 179
180
3.1 Analytical method 181
20. A robust and sensitive analytical method (HPLC, LC-or GC-MS) is needed to determine 182
chemical depletion using TG xx or TG xy. The sensitivity of the analytical method determines the 183
lower limit of concentration of the test chemical which can be used in the assay. As a general rule, 184
the initial test chemical concentration should be around 10-fold higher than the limit of 185
quantification (LOQ). 186
21. An internal standard with similar properties as the test chemical may be used to correct for 187
potential losses of the test chemical during sample preparation (e.g. due to evaporation of the 188
stopping solvent during the extraction procedure). The internal standard should be added to the 189
stopping solvent. 190
22. To quantify the test chemical, calibration standards should be prepared in the presence of 191
biological matrix (i.e. incubation buffer containing cofactors, alamethicin, and enzymatically inactive 192
S9 sub-cellular fractions for RT-S9 incubations, and L-15 containing enzymatically inactive 193
hepatocytes for RT-HEP incubations) and extracted using the same protocol as for the incubation 194
samples. Alternatively, the calibration standards can be prepared in an organic solvent. In this case, 195
matrix spikes are needed to allow correction for extraction efficiency in order to calculate the 196
concentration of test chemical in the incubation samples. 197
198
3.2 Preparation of test chemical stock solutions 199
23. Stock solution(s) of the test chemical should be prepared in the reaction buffer (i.e. L-15 200
medium for RT-HEP and potassium phosphate buffer for RT-S9, respectively) if possible. However, 201
since chemicals of interest for bioaccumulation assessment tend to be hydrophobic, water-miscible 202
solvents are commonly used to facilitate introduction of these chemicals to the test system. A 203
concentrated stock solution of the test chemical is prepared in a solvent. Defined quantities of the 204
stock solution (or intermediate spiking solution) are then added to the incubation mixture to start 205
the reaction, termed “spiking.” 206
7
24. The choice of a spiking solvent depends in part on the properties of the test chemical. 207
Solubility of the test chemical in this solvent should be determined. Water-miscible solvents which 208
are commonly used include acetonitrile, acetone, and methanol (Johanning et al. 2012). DMSO is not 209
recommended due to inhibition of certain CYP isoforms as described for human liver microsomes 210
(Chauret et al. 1998). The organic stock solution can be directly added to the incubation mixture or, 211
preferably, diluted into an intermediary spiking solution with lower level of solvent which is finally 212
added to the incubations. This may be in particular necessary for the multiple tube approach (OECD 213
xxxx). In either case, the solvent concentration in the incubation should not exceed 1% of the total 214
volume (Johanning et al. 2012). In general, final concentrations of organic solvents in the incubation 215
medium should be minimized as much as possible, since they can potently inhibit enzyme activities 216
(Easterbrook et al. 2001; Sakalli et al. 2015). 217
25. If stock solutions of test chemicals are stored prior to the incubation experiments, stability 218
tests must be performed under the corresponding storage conditions. Stock solutions should not be 219
stored for longer than 2 weeks at 4°C, and spiking solutions should be freshly prepared at each day of 220
the incubation. Stock solutions and spiking solutions should be stored in the dark or in Amber glass 221
vials for photolabile chemicals. 222
223
3.3 Extraction solvents for stopping of the incubation and extraction of the test 224
chemical 225
26. The organic solvent used to stop the biotransformation activity and extract the chemical in 226
RT-S9 and RT-HEP incubations depends on the properties of the test chemical and on the analytical 227
method used. Commonly used stopping and extractions solvents are e.g. acetonitrile, methanol, 228
dichloromethane (methylene chloride), and methyl tert-butyl ether (MTBE) (OECD xxxx). Due to 229
difference of the biological matrix, different extraction solvents may be needed for RT-HEP and RT-S9 230
incubations. 231
27. Preliminary experiments should be performed to determine whether the test chemical is 232
extractable from the incubation samples (active and enzymatically inactive RT-S9 or active and 233
enzymatically inactive RT-HEP, respectively). Different organic solvents may need to be compared to 234
ensure sufficient extraction efficacy. In instances where the extraction solvent may interact with 235
plastic, glass tubes should be used for extraction. 236
28. If extracted incubation samples are kept frozen prior to analysis, the chemical stability of 237
these frozen, extracted samples must be determined. It is not recommended to freeze directly 238
incubation samples which have not been extracted due to potential losses e.g. by adsorption. 239
Extracted samples should be stored in tightly closed glass vials, such as HPLC- or GC-vials. 240
241
3.4 Selection of test chemical concentrations 242
29. From theoretical considerations, the starting test chemical concentration should be 243
substantially lower than the Michaelis-Menten affinity constant (KM) for the reaction in order to 244
result in first-order depletion kinetics (Nichols et al. 2006). Previously, Lo et al. demonstrated a 245
procedure for estimating KM from substrate depletion data collected across a range starting 246
8
concentrations (Lo et al. 2015). Using this method, they showed that in vitro intrinsic clearance rates 247
may depend strongly on the initial test chemical concentration. A user of TG xx or TG xy may wish to 248
evaluate the concentration-dependence of a particular reaction to insure that the starting 249
concentration is <<KM. Without such an effort, the test chemical concentration may be guided by 250
analytical sensitivity as described above. Selection of the starting test chemical concentration is 251
detailed in TG xx and TG xy, Annex 5. 252
30. In certain cases (e.g. if the analytical method is not sensitive enough which may be common 253
for substances with multiple isomers), the use of a test chemical concentration ≥ 1 µM may be valid 254
from the perspective of providing a conservative bioaccumulation assessment. If, however, the 255
starting test chemical concentration is >KM, an in vitro assay may underestimate the true rate of in 256
vivo activity leading to an over-prediction of the true BCF. 257
258
3.5 Poorly water soluble test chemicals 259
31. For very hydrophobic chemicals (log Kow > 6), use of a solvent spiking approach could result 260
in a dynamic system with incomplete dissolution in the aqueous assay medium. In particular, the test 261
chemical concentration could locally exceed its aqueous solubility causing the formation of 262
microcrystals (Kwon et al. 2009). This could, in turn, reduce the substrate concentration available to 263
metabolizing enzymes causing underestimation of in vitro biotransformation rates (Lee et al. 2014). 264
To minimize this problem, all samples should be mixed immediately after substrate addition. 265
32. A sorbent-phase dosing approach may be more useful for measuring in vitro intrinsic 266
clearance rates for chemicals with very low water solubility (Kwon et al. 2009; Lee et al. 2011). An 267
ethylene vinyl acetate (EVA) thin-film sorbent-phase dosing approach has been developed and 268
applied to measure the in vitro intrinsic clearance of hydrophobic chemicals by RT-S9. The in vitro 269
intrinsic clearance rate of pyrene (log Kow 5.18) was similar in solvent-delivery dosing experiments 270
and the sorbent-phase dosing experiments. In contrast, the in vitro intrinsic clearance rate 271
determined for chyrsene (log Kow 5.60) using sorbent-phase dosing was 20-fold higher than that 272
achieved using solvent spiking (Lee et al. 2014). 273
274
3.6 Volatile test chemicals 275
33. Volatility of the test chemical must be taken into account to minimize abiotic loss. Generally, 276
if the Henry’s law constant (H) is >100 Pa m3/mol, more than 50% of the substance could be lost from 277
the water phase within 3-4 hours (OECD 2000). 278
34. A substantial decrease of the test chemical concentration (i.e. >20%) in the control 279
incubations using enzymatically inactive RT-S9 or RT-HEP may indicate abiotic losses due to volatility. 280
The significance of volatility can be assessed by comparing control incubations with enzymatically 281
inactive RT-S9 or RT-HEP in open and closed vials in preliminary experiments using other types of 282
vials (e.g. GC or HPLC vials rendering smaller headspace). 283
35. The multiple tube approach (OECD xxxx) is preferred for testing of volatile chemicals. In 284
contrast to the single tube approach which requires withdrawal of aliquots at different time points, 285
9
incubation vials using the multiple tube approach are only opened once at the sampling point and 286
the headspace volume for each time point is comparable. 287
288
3.7 Adsorption of test chemicals 289
36. Abiotic loss of the test chemical may also be caused by adsorption onto surfaces and onto 290
organic material like protein or lipids. 291
37. Glass vials have to be used for the RT-HEP and RT-S9 incubations (OECD TG RT-HEP and RT-292
S9). The use of plastic vessels is not recommended for the incubation assays. Additionally, highly 293
adsorptive materials like rubber should be avoided as part of the exposure system. When closed vials 294
are used for incubations, lids should consist of non-adsorptive materials like polytetrafluoroethylene 295
(PTFE) (OECD 2000). 296
38. When working with highly hydrophobic compounds, it is important to minimize the sampling 297
transfers during analysis (Johanning et al. 2012). Thus, the multiple tube approach is recommended 298
in which incubation, stopping of the reaction and extraction are done in the same vial. 299
300
3.8 Abiotic degradation of test chemicals 301
39. Abiotic degradation processes, including hydrolysis and photolysis, may also cause a loss of 302
test chemicals from active and enzymatically inactive RT-S9 or RT-HEP. Amber glass incubation vials 303
(e.g. amber GC vials) may be used to prevent photolysis. 304
40. If chemical stock solutions are stored, the stability of these solutions must be evaluated prior 305
to testing. Furthermore, spiking solutions of the test chemical should be prepared fresh the day of an 306
experiment (see section 3.2). 307
308
3.9 Ionised chemicals 309
41. Relatively small changes in pH can significantly alter the balance between the dissociated and 310
non-dissociated forms of some organic acids and bases (OECD 2000). The relevant dissociation 311
constants (pKa values) should be known prior to testing. Recently, in vitro intrinsic clearances were 312
determined for ionisable chemicals using RT-S9 (Chen et al. 2016). 313
314
3.10 Testing of chiral chemicals and structural isomers 315
42. The substrate depletion approach using RT-S9 or RT-HEP may be employed to compared in 316
vitro intrinsic clearance rates for different stereoisomers or structural isomers. For example, trout 317
liver S9 fractions were applied to investigate enantiomer-specific differences in biotransformation of 318
three pharmaceuticals (Connors et al. 2013). 319
10
43. Some chemicals exist as isomeric mixtures containing two or more isomers. In vitro intrinsic 320
clearance rates can be determined for the individual isomers in these mixtures if the analytical 321
method is sensitive enough to quantify the isomers separately (Laue et al. 2014). Current BCF 322
predictions based on log Kow and QSAR-estimated biotransformation rates (i.e. the Arnot-Gobas 323
model, (Arnot et al. 2003)) do not distinguish between different stereoisomers except if there are 324
differences in log Kow values. 325
326
3.11 Mixtures as test chemicals 327
44. In principle, TG xx and TG xy can be used to determine in vitro intrinsic clearance rates of 328
mixtures. With few exceptions, these in vitro methods have only been applied to single chemical 329
substances (Lee et al. 2014). Using a conventional solvent dosing approach Lee et al. found that in 330
vitro biotransformation rate constants for three polycyclic aromatic hydrocarbons (PAHs) tested 331
individually were significantly greater than those obtained when same three PAHs were tested as a 332
mixture. Based on this finding, it was suggested that in vitro biotransformation of one PAH may be 333
competitively inhibited by the presence of other PAHs (Lee et al. 2014). 334
45. The mixture effect noted by Lee et al. when using a conventional solvent dosing was 335
substantially reduced when the same three PAHs were tested using a sorbent-phase dosing 336
approach. The lower initial substrate concentrations in the incubation medium in the thin-film dosing 337
experiments may reduce competitive inhibition. Thus, a sorbent-delivery system may have greater 338
potential for measuring biotransformation rates of multiple chemicals (Lee et al. 2014). 339
46. In addition to possible inhibitory effects associated with mixtures, the analytical 340
determination of the concentrations of individual components of the mixture may be challenging. 341
The extraction method, analytical method, and test concentration must be suitable for all 342
components of the mixture. Thus, it is recommended to test the biotransformation of the individual 343
components of mixtures if they are available. 344
345
4. Positive and negative control incubations 346
4.1 Negative control incubations 347
47. The use of a negative control is necessary to ensure that an observed decrease in test 348
chemical concentration is not due to abiotic processes. This section describes procedures used to 349
prepare negative controls as well as guidance on how the negative control results should be 350
interpreted. 351
352
4.1.1 Enzymatically inactive RT-HEP and RT-S9 353
48. TG xx and TG xy state that in addition to incubations with active RT-HEP or RT-S9, negative 354
control incubations with enzymatically inactive RT-HEP or RT-S9 should be performed in parallel to 355
distinguish between enzymatic metabolism and abiotic decrease (e.g. abiotic degradation, 356
11
volatilization, adsorption to the reaction vessel). Enzymatically inactive RT-HEP or RT-S9 are used for 357
negative control incubations and their routine preparation by heat inactivation is described in TG xx 358
and TG xy. Heating in a microwave is not recommended (Fay et al. 2015). 359
49. A decrease of the test chemical by >20% with enzymatically inactive biological material 360
indicates potential issues which are addressed in section 3.6-3.8. In such cases, it is recommended 361
that the incubation conditions are optimized to reduce these abiotic loss processes 362
50. For some chemicals, there may be issues due to the inhomogeneous nature (i.e. precipitated 363
protein) of the heat-inactivated matrix, especially for heat-inactivated RT-S9. In such cases, 364
enzymatically inactive RT-S9 can be prepared by incubating active RT-S9 at room temperature for 24 365
h followed by storage at -20°C for at least 24 h prior to use. Negative control incubations with room-366
temperature inactivated RT-S9 are carried out in presence of alamethicin, but without addition of 367
any cofactors. Preparation of room-temperature RT-S9 is described in detail in Annex 2. 368
51. If, during preliminary incubations, there is negligible loss of substrate in the presence of 369
enzymatically inactive RT-HEP or RT-S9 (see Annex 6, TG xx and Annex 5, TG xy, respectively), a 370
reduced number of time points may be applied for the negative controls in the main incubations, 371
e.g., starting, middle, and ending time points (Johanning et al. 2012). 372
52. If there is an abiotic loss of test chemical from enzymatically inactive RT-HEP or RT-S9 which 373
cannot be avoided by optimization of assay conditions (i.e., abiotic decrease >20%), the rate of this 374
loss process may be subtracted from the measured rate of depletion in active samples to obtain a 375
corrected in vitro intrinsic clearance rate (Nichols et al. 2013). In this case, however, it must be 376
verified that the abiotic loss process follows first-order kinetics. 377
378
4.1.2 Additional negative control incubations – RT-S9 379
53. Control incubations containing active RTL-S9, but no added cofactors, can be used to detect 380
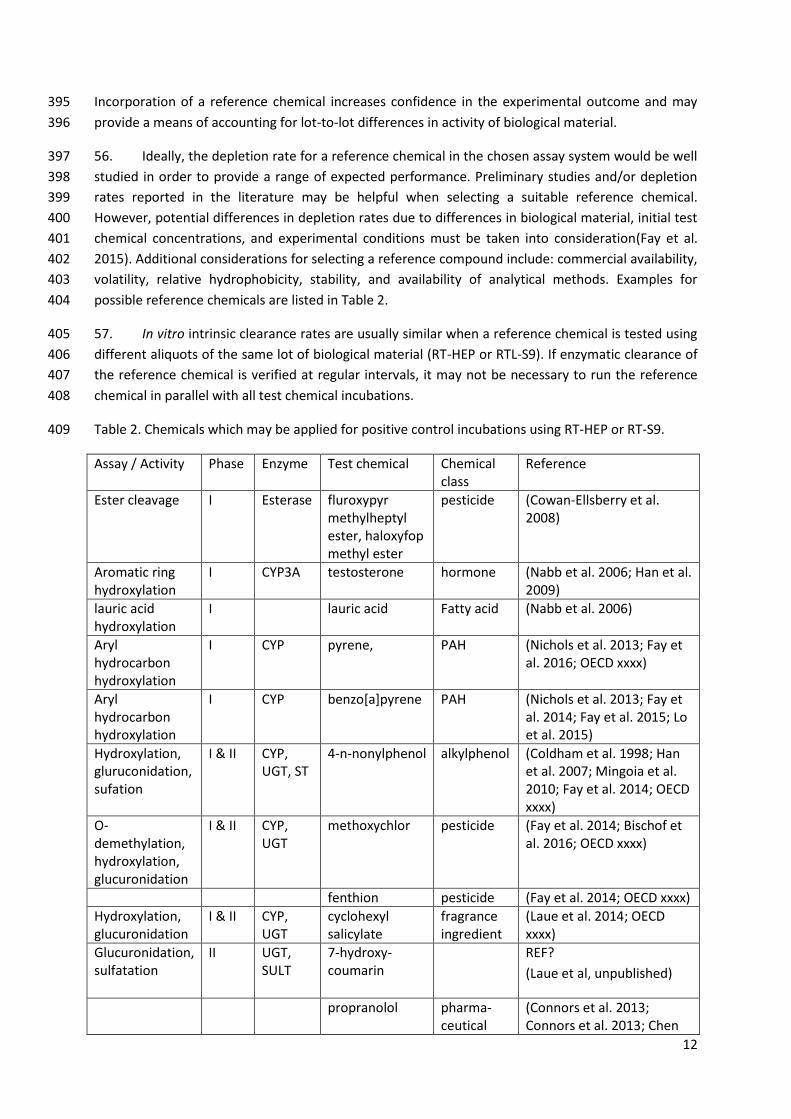
cofactor-independent enzymatic reactions such as hydrolysis by esterases. It should be noted, 381
however, that background concentrations of each cofactor may be present in liver S9 sub-cellular 382
fractions (Johanning et al. 2012). 383
384
4.2 Positive control (reference chemical) incubations 385
54. Before using a new lot of RT-HEP or RTL-S9, the enzymatic activity of this material should be 386
characterized by running Phase I and Phase II biotransformation reactions using standard substrates. 387
Assays that have been used to characterize RT-HEP and RT-S9 are described in TG xx and TG xy 388
(Annex 3). 389
55. In addition to the initial characterization of a new lot of RT-HEP or RTL-S9, it is recommended 390
that users incorporate an appropriate reference chemical into assays involving a new test chemical in 391
order to verify enzymatic activity of the biological material. If a specific pathway for 392
biotransformation of the new test chemical is known or suspected (e.g., Phase I or Phase II), it may 393
be useful to choose a reference chemical which is transformed by the same metabolic pathway. 394
12
Incorporation of a reference chemical increases confidence in the experimental outcome and may 395
provide a means of accounting for lot-to-lot differences in activity of biological material. 396
56. Ideally, the depletion rate for a reference chemical in the chosen assay system would be well 397
studied in order to provide a range of expected performance. Preliminary studies and/or depletion 398
rates reported in the literature may be helpful when selecting a suitable reference chemical. 399
However, potential differences in depletion rates due to differences in biological material, initial test 400
chemical concentrations, and experimental conditions must be taken into consideration(Fay et al. 401
2015). Additional considerations for selecting a reference compound include: commercial availability, 402
volatility, relative hydrophobicity, stability, and availability of analytical methods. Examples for 403
possible reference chemicals are listed in Table 2. 404
57. In vitro intrinsic clearance rates are usually similar when a reference chemical is tested using 405
different aliquots of the same lot of biological material (RT-HEP or RTL-S9). If enzymatic clearance of 406
the reference chemical is verified at regular intervals, it may not be necessary to run the reference 407
chemical in parallel with all test chemical incubations. 408
Table 2. Chemicals which may be applied for positive control incubations using RT-HEP or RT-S9. 409
Assay / Activity Phase Enzyme Test chemical Chemical class
Reference
Ester cleavage I Esterase fluroxypyr methylheptyl ester, haloxyfop methyl ester
pesticide (Cowan-Ellsberry et al. 2008)
Aromatic ring hydroxylation
I CYP3A testosterone hormone (Nabb et al. 2006; Han et al. 2009)
lauric acid hydroxylation
I lauric acid Fatty acid (Nabb et al. 2006)
Aryl hydrocarbon hydroxylation
I CYP pyrene, PAH (Nichols et al. 2013; Fay et al. 2016; OECD xxxx)
Aryl hydrocarbon hydroxylation
I CYP benzo[a]pyrene PAH (Nichols et al. 2013; Fay et al. 2014; Fay et al. 2015; Lo et al. 2015)
Hydroxylation, gluruconidation, sufation
I & II CYP, UGT, ST
4-n-nonylphenol alkylphenol (Coldham et al. 1998; Han et al. 2007; Mingoia et al. 2010; Fay et al. 2014; OECD xxxx)
O-demethylation, hydroxylation, glucuronidation
I & II CYP, UGT
methoxychlor pesticide (Fay et al. 2014; Bischof et al. 2016; OECD xxxx)
fenthion pesticide (Fay et al. 2014; OECD xxxx)
Hydroxylation, glucuronidation
I & II CYP, UGT
cyclohexyl salicylate
fragrance ingredient
(Laue et al. 2014; OECD xxxx)
Glucuronidation, sulfatation
II UGT, SULT
7-hydroxy-coumarin
REF?
(Laue et al, unpublished)
propranolol pharma-ceutical
(Connors et al. 2013; Connors et al. 2013; Chen
13
et al. 2016)
Glutathione conjugation
II GST
410
5. In vitro-in vivo extrapolation and mass-balance model to predict 411
bioconcentration factors 412
5.1 In vitro-in vivo extrapolation and mass balance model to predict BCFs: 413
theoretical background 414
58. Measured in vitro intrinsic clearance rates are extrapolated to an estimate of hepatic 415
clearance (CLH), which is used to estimate a whole-body biotransformation rate constant (kMET). This 416
whole-body rate constant is then used as an input to established mass-balance models for rainbow 417
trout to predict well-known metrics of accumulation such as the bioconcentration factor (BCF). 418
Details on the general approach have been given by various authors (Nichols et al. 2006; Han et al. 419
2007; Cowan-Ellsberry et al. 2009; Han et al. 2009). In a recent report, Nichols et al. (2013) described 420
a pair of models that employ measured in vitro intrinsic clearance rates to predict BCF values in 421
rainbow trout. One model (HEP-BCF) was provided for data derived from RT-HEP, while a second (S9-422
BCF) was developed for data derived from RT-S9. Both models were configured as Microsoft Excel 423
spreadsheets and are available upon request from the corresponding author. Importantly, these 424
models predict the BCF for a “standardized” fish (10 g rainbow trout containing 5% whole-body lipid), 425
which is typical of fish commonly tested in vivo under OECD TG305 (OECD 2012). 426
59. As described in TG xx and TG xy, a substrate depletion approach is used to determine an in 427
vitro reaction rate constant (1/h). Implied by this approach is an assumption that the starting 428
substrate concentration is below KM, the Michaelis-Menten affinity constant for the reaction (i.e., 429
under first-order conditions). This rate constant is then normalized to cell number or S9 protein 430
content to derive the in vitro intrinsic clearance (CLIN VITRO,INT; mL/h/106 cells or mL/h/mg protein) 431
(OECD xxxx; OECD xxxx). 432
60. In the S9-BCF model, the CLIN VITRO,INT is multiplied by the S9 content of liver tissue (LS9; mg/g 433
liver) and liver weight as a fraction of body weight (g liver/g fish) to yield the in vivo intrinsic 434
clearance (CLIN VIVO,INT; mL/h/g fish) (Nichols et al. 2013). Multiplying by 24 gives an CLIN VIVO,INT with 435
units of L/d/kg fish. The S9 content of liver tissue refers to the total amount of S9 protein in the 436
tissue and not the protein content of the S9 fraction itself. This scaling factor accounts for incomplete 437
recovery of protein during the preparation of S9 sub-cellular fraction (e.g. due to incomplete cell 438
lysis) and was determined using two markers of microsomal protein (total cytochrome P450 content 439
and glucose-6-phosphatase activity). An average value of 163 mg S9 protein /g liver is applied in the 440
S9-BCF model (Nichols et al. 2013). This correction had not been implemented in previous models 441
(Cowan-Ellsberry et al. 2008; Han et al. 2009). The fractional liver weight used by Nichols et al. was 442
based on a value determined previously for small trout (Schultz et al. 1999). 443
61. In the HEP-BCF model, the CLIN VITRO,INT is multiplied by hepatocellularity (LHEP; 106 cells/g liver) 444
and fractional liver weight to yield the CLIN VIVO,INT (L/d/kg). An average hepatocellularity value of 500 x 445
106 cells/g liver is used in the HEP-BCF model (Nichols et al. 2013). This value is appropriate for 446
14
sexually immature trout and is based on studies performed by the authors as well as studies 447
described previously (Hampton et al. 1989; Han et al. 2008). 448
62. The CLIN VIVO,INT is converted to an estimate of in vivo hepatic clearance (CLH; L/d kg) using a well-449
stirred liver model (Nichols et al. 2013). 450
CLH = QH U CLIN VIVO, INT/ (QH + U CLIN VIVO, INT) (1) 451
where QH (L/d/kg fish) is the liver blood flow rate and U (unitless) is a binding term (ranging from 0.0 452
to 1.0) that corrects for the difference in free chemical concentration between blood and the in vitro 453
system used to measure activity (Nichols et al. 2006; Nichols et al. 2013). In the spreadsheets, U is 454
calculated as the ratio of free chemical fractions in blood plasma (U,P; unitless) and the in vitro 455
system (U,S9 or U,HEP; unitless), each of which is estimated using log Kow–based algorithms. 456
Consistent with the “free chemical hypothesis,” these models assume that only the free chemical 457
fraction is available for metabolic transformation in vitro and in vivo. 458
63. Presently, the effect of chemical binding on predicted hepatic clearance is one of the major 459
uncertainties in modelled BCF predictions. It was observed in several studies that setting U =1.0 (i.e., 460
assuming the same availability of the chemical to metabolic enzymes in vitro and in vivo) resulted in 461
much better agreement between predicted and empirical BCF values (Cowan-Ellsberry et al. 2008; 462
Escher et al. 2011; Laue et al. 2014; OECD xxxx). The spreadsheet can be adapted by manually 463
changing the term “fu” to “fuone”, thereby setting U =1.0). This results in the following equation: 464
CLH = QH CLIN VIVO, INT/ (QH + CLIN VIVO, INT) (2) 465
For chemicals with relatively high log Kow values and low intrinsic clearance rates, the two different 466
binding assumptions result in substantial differences in calculated hepatic clearance rates and 467
predicted BCFs (Nichols et al. 2013). The impact on these binding assumptions is discussed in more 468
detail below (§73-74). 469
64. A whole-body biotransformation rate constant (kMET; 1/d) is calculated by dividing CLH by the 470
chemical’s apparent volume of distribution, referenced to the chemical concentration in blood (VD,BL; 471
L/kg) (Nichols et al. 2006). The VD is estimated as the ratio of fish/water and blood/water partition 472
coefficients, each of which is calculated using log Kow-based algorithms. 473
65. The total chemical concentration in fish at steady state (CFISH,SS; mg/kg) is predicted using the 474
1-compartment model given by Arnot and Gobas (Arnot et al. 2003). The calculation includes rate 475
constants that describe chemical uptake and loss across the gills, and fecal egestion (Arnot et al. 476
2003). Finally, (CFISH,SS; mg/kg) is divided by the chemical concentration in water (CW,TOT) resulting in a 477
BCF value expressed on a total chemical basis (BCFTOT; L/kg). A second BCF is calculated normalized 478
for fish lipid content (BCFFD,L; L/kg lipid) (Nichols et al. 2013). 479
480
6. Use of the spreadsheets for BCF predictions: practical application 481
66. BCFs are predicted for the test chemical based on in vitro biotransformation rates 482
determined in the RT-HEP or RT-S9 assay using the corresponding spreadsheets. The two different 483
15
binding assumptions (i.e. U modelled and U=1.0) should be considered for BCF calculation to 484
estimate upper and lower limits of hepatic clearance (Nichols et al. 2013). 485
67. Parameters that need to be entered by the user into the spreadsheets are the log Kow of the 486
test chemical, the body weight of fish used for RT-HEP or RT-S9 preparation (does not impact the BCF 487
calculations in the current spreadsheet), the RT-S9 protein concentration or hepatocyte 488
concentration used in the in vitro assay, the reaction rate determined by the in vitro assay, 489
incubation temperature, and the nominal chemical test concentration (Tables 2 and 3). Measured log 490
Kow values should be used, when available; in the absence of measured values, modelled estimates 491
can be used (e.g., those provided by EpiSuite). 492
68. Additional independent variables such as liver S9 protein content, liver weight as a fraction of 493
body weight, and liver blood flow as a fraction of cardiac output are specified in the spreadsheets. 494
See Annex 3 for details. 495
69. The spreadsheets calculate a BCFTOT (L/kg) for a standard fish based on the in vitro reaction 496
rate determined in the hepatocyte or S9 assay. A second BCF is calculated normalized for fish lipid 497
(BCFFD,L; L/kg lipid) (Nichols et al. 2013). 498
499
Table 3. Independent variable inputs to be set by the researcher when using the S9-bioconcentration 500
factor (S9-BCF) model. Additional independent variables which are already included in the 501
spreadsheet are not listed (Nichols et al. 2013). 502
Parameter Value Units
Log Kow of test chemical Measured or estimated Unitless Body weight of fish used as source of S9
Measured g
S9 protein concentration (CS9) in the assay
Set by researcher; typically 0.5 to 2.0 mg/mL
Reaction rate (Rate) Measured; from substrate depletion assay
1/h
Modelled temperature (T) Set by researcher, should correspond to acclimatization temperature and temperature used for in vitro assay
Celsius
Total aqueous chemical concentration (Cw, TOT)
Set by researcher mg/L
503
Table 4. Independent variable inputs to be set by the researcher when using the hepatocyte-504
bioconcentration factor (HEP-BCF) model. Additional independent variables which are already 505
included in the spreadsheet are not listed (Nichols et al. 2013). 506
Parameter Value Units
Log Kow of test chemical Measured or estimated Unitless Body weight of fish used as source of hepatocytes
Measured g
Hepatocyte cell number (CHEP) Set by user; typically 1 to 2 × 10⁶ (final cell number is verified by recounting)
cells/mL
Reaction rate (Rate) Measured; from substrate depletion 1/h
16
assay Modelled temperature (T) Set by researcher, should correspond to
acclimatization temperature and temperature used for in vitro assay
Celsius
Total aqueous chemical concentration (Cw, TOT)
Set by researcher; does not impact BCF calculations
mg/L
507
7. Interpretation and applications of predicted BCFs 508
70. BCFs obtained by incorporating measured in vitro biotransformation rates into the in BCF 509
model may be used to categorize a test chemical as B (bioaccumulative) or not B according to the 510
corresponding regulatory program. 511
71. The RT-HEP and RT-S9 assays have practical limitations which limit their use for chemicals 512
metabolized at very low rates. The ability to detect a low rate chemical depletion (i.e., one 513
statistically different from negative controls) depends on the behaviour of these controls, the quality 514
of the dataset (e.g., the precision of replicated measurements at each time point), and the length of 515
time over which the assay is run. As noted above, these assays have a finite working lifetime. 516
Previously, Nichols et al. (2013) estimated that the lowest rate of in vitro activity which can be 517
reliably quantified using this approach is about 0.05/h, based on historical data for several 518
compounds. A somewhat higher limit value (0.14/h) was estimated by Chen et al. (Chen et al. 2016), 519
based on modelled simulations of hypothetical substrate depletion data. 520
72. Both in vitro systems are considered to have a limited working lifetime due to a progressive 521
loss of enzymatic activity. To date, the working lifetime of RT-HEP and RT-S9 has not been rigorously 522
established. Because proteases may contribute to loss of activity of RT-S9, the addition of a protease 523
inhibitor may improve assay performance. However, this possibility has not yet been evaluated. 524
73. For some hydrophobic chemicals, there was a poor correlation between empirical BCFs and 525
BCFs predicted using the full modelled binding assumption (i.e., fU = fU,P/fU,HEP or fU,S9). Instead, there 526
was better agreement using the binding assumption U=1.0, especially for slowly metabolized 527
chemicals (Cowan-Ellsberry et al. 2008; Escher et al. 2011; Laue et al. 2014), (REF ring trial report). 528
These observations suggest that hepatic clearance values predicted using the full binding assumption 529
under-predict true levels of in vivo clearance resulting in overestimation of measured BCFs. A 530
systematic bias toward under-prediction of in vivo hepatic clearance by in vitro systems (hepatocytes, 531
microsomes) derived from human liver tissue has been noted by several authors (Hallifax et al. 2010; 532
Hallifax et al. 2012). 533
74. Previously, it was suggested that the two different binding assumptions may be used to 534
estimate upper and lower limits on hepatic clearance (Nichols et al. 2013). More studies are needed 535
to evaluate which binding assumption results in more accurate BCF predictions for hydrophobic 536
chemicals in fish. These studies should ideally be performed at substrate concentrations shown to be 537
well below the KM for the reaction if the analytical method is sensitive enough. Recent work indicates 538
that the use of substrate concentrations greater than KM may, by itself, result in lower levels of 539
measured in vitro clearance, and by extension lower levels of predicted in vivo hepatic clearance and 540
higher predicted BCF values (Lo et al. 2015). 541
17
75. Additional factors that may explain differences between measured and predicted BCF values 542
include extrahepatic metabolism and induction of metabolizing enzymes in prolonged contaminant 543
exposures (e.g., a laboratory BCF testing effort). In either case, these factors would tend to result in 544
measured BCFs that are lower than those predicted considering only hepatic metabolism, as well as 545
those predicted using liver S9-subcellular fractions and hepatocytes from trout that have not been 546
induced. In this sense, the RT-HEP and RT-S9 assays provide a conservative basis of performing 547
bioaccumulation assessments; that is, BCFs are unlikely to be higher than values predicted using 548
these assays, but may be lower. 549
76. When used to evaluate the validity of in vitro-in vivo metabolism extrapolation efforts, it 550
should also be kept in mind that even high quality experimental BCF data differ by >0.5 log units for 551
at least 35% of chemicals tested and >1 log unit for at least 10% of chemicals (Nendza et al. 2010) 552
which may result in BCFs values which are below and above a certain B threshold, e.g. as described 553
for lindane (log BCF ranging from 2.16-3.32) (Arnot et al. 2006). 554
77. Additionally, the impact of the log Kow value used to predict BCFs based on in vitro intrinsic 555
clearance has to be considered for the interpretation of the predicted BCFs. The accepted variation 556
of log Kow values determined using OECD TG 117 (OECD 2004) is +/- 0.5 which may result in 557
substantially different predicted BCFs especially for higher log Kow chemicals which are slowly 558
biotransformed. Log Kow values calculated using QSAR methods are even more prone to error and 559
should be used with caution. 560
78. The predicted BCFs based on in vitro data may be applied to assess the bioaccumulation 561
potential as part of a weight of evidence approach (Nichols et al. 2009) or for read across (i.e. 562
comparison of in vitro intrinsic clearance of the test chemical with another chemical for which 563
empirical BCF data are available). Furthermore, predicted BCFs based on in vitro data may be useful 564
as an additional tool for screening for bioaccumulation potential in order to decide whether a full in 565
vivo fish-BCF study is warranted. 566
79. Although the spreadsheets given by Nichols et al. (2013) were developed to predict BCF 567
values for a standardized fish (10 g trout containing 5% lipid), they may be used to predict BCFs for 568
any fish species (lifestage, etc.) of interest by appropriate specification of in vitro-in vivo scaling 569
factors. Additional research is needed to develop these scaling factors for other species. 570
571
8. Other potential applications of the in vitro RT-HEP and RT-S9 572
assays 573
80. In principal, the RT-HEP and RT-S9 assays can be adapted to any fish species, thereby 574
allowing for a comparison of in vitro biotransformation in different fish species. Primary hepatocytes 575
have been successfully isolated from numerous fish species; however, to-date, consistent substrate 576
depletion studies have only been performed in rainbow trout (Han et al. 2008; Mingoia et al. 2010; 577
Fay et al. 2014; Bischof et al. 2016) and common carp (Cyprinus carpio) (Cowan-Ellsberry et al. 2008; 578
Dyer et al. 2008; Dyer et al. 2009; Bischof et al. 2016). 579
18
81. Because they are easier to prepare, most studies on multiple species have been performed 580
using liver S9 sub-cellular fractions. For example, Phase I and II metabolism of model substrates have 581
been compared in eight finfish species (González et al. 2009) and the metabolism of benzo[a]pyrene 582
was compared in liver S9 sub-cellular fractions from red and white blooded antarctic fish (Strobel et 583
al. 2015). 584
82. In addition to liver, S9 sub-cellular fractions can be prepared from other organs, such as the 585
gills and gut. This facilitates comparisons of biotransformation in different organs and may provide a 586
means for studying the impact of extrahepatic clearance clearance on predicted BCFs. Gomez et al 587
compared biotransformation of pharmaceuticals in S9 sub-cellular fractions prepared from liver and 588
gill of rainbow trout and channel catfish (Ictalurus punctatus) (Gomez et al. 2010; Gomez et al. 2011). 589
83. The RT-HEP and RT-S9 assays can be applied to identify metabolites in vitro as surrogate for 590
in vivo metabolism studies. In this application, the assays are used to quantify the appearance of 591
metabolites and not the disappearance of parent chemical (Bischof et al. 2016; Chen et al. 2016). 592
84. Similar to applications for drug evaluations, drug-drug interaction studies, e.g. the in vitro 593
inhibition of cytochrome P450-mediated reactions had been studies in liver microsomes from 594
untreated and -naphthoflavone (BNF) or clotrimazole and dexamethasone treated rainbow trout 595
(Smith et al. 2012; Burkina et al. 2013). Alternatively, interference of chemicals like pharmaceuticals 596
with endogenous and xenobiotic metabolizing enzymes can also be studies directly using sub-cellular 597
fractions, e.g. from carp (Thibaut et al. 2006). 598
19
9. References 599
600 Arnot, J.A. and F.A.P.C. Gobas (2003). A generic QSAR for assessing the bioaccumulation potential of 601
organic chemicals in aquatic food webs. QSAR and Combinatorial Science 22(3): 337-345. 602 Arnot, J.A. and F.A.P.C. Gobas (2006). A review of bioconcentration factor (BCF) and bioaccumulation 603
factor (BAF) assessments for organic chemicals in aquatic organisms. Environmental Reviews 604 14(4): 257-297. 605
Arnot, J.A., W. Meylan, J. Tunkel, P.H. Howard, D. Mackay, M. Bonnell and R.S. Boethling (2009). A 606 quantitative structure-activity relationship for predicting metabolic biotransformation rates 607 for organic chemicals in fish. Environmental Toxicology and Chemistry 28(6): 1168-1177. 608
Bearr, J.S., C.L. Mitchelmore, S.C. Roberts and H.M. Stapleton (2012). Species specific differences in 609 the in vitro metabolism of the flame retardant mixture, Firemaster(R) BZ-54. Aquatic 610 Toxicology 124-125: 41-47. 611
Bischof, I., J. Koster, H. Segner and C. Schlechtriem (2016). Hepatocytes as in vitro test system to 612 investigate metabolite patterns of pesticides in farmed rainbow trout and common carp: 613 Comparison between in vivo and in vitro and across species. Comparative Biochemistry and 614 Physiology Part C: Toxicology & Pharmacology. 615
Burkina, V., V. Zlabek and G. Zamaratskaia (2013). Clotrimazole, but not dexamethasone, is a potent 616 in vitro inhibitor of cytochrome P450 isoforms CYP1A and CYP3A in rainbow trout. 617 Chemosphere 92(9): 1099-1104. 618
Chauret, N., A. Gauthier and D.A. Nicoll-Griffith (1998). Effect of common organic solvents on in vitro 619 cytochrome P450-mediated metabolic activities in human liver microsomes. Drug 620 Metabolism and Disposition 26(1): 1-4. 621
Chen, Y., J.L.M. Hermens, M.T.O. Jonker, J.A. Arnot, J.M. Armitage, T. Brown, J.W. Nichols, K.A. Fay 622 and S.T.J. Droge (2016). Which Molecular Features Affect the Intrinsic Hepatic Clearance Rate 623 of Ionizable Organic Chemicals in Fish? Environmental Science & Technology 50(23): 12722-624 12731. 625
Coldham, N.G., S. Sivapathasundaram, M. Dave, L.A. Ashfield, T.G. Pottinger, C. Goodall and M.J. 626 Sauer (1998). Biotransformation, tissue distribution, and persistence of 4-nonylphenol 627 residues in juvenile rainbow trout (Oncorhynchus mykiss). Drug Metab Dispos 26(4): 347-628 354. 629
Connors, K.A., B. Du, P.N. Fitzsimmons, C.K. Chambliss, J.W. Nichols and B.W. Brooks (2013). 630 Enantiomer-Specific In Vitro Biotransformation of Select Pharmaceuticals in Rainbow Trout 631 (Oncorhynchus mykiss). Chirality 25(11): 763-767 632
Connors, K.A., B. Du, P.N. Fitzsimmons, A.D. Hoffman, C.K. Chambliss, J.W. Nichols and B.W. Brooks 633 (2013). Comparative pharmaceutical metabolism by rainbow trout (Oncorhynchus mykiss) 634 liver S9 fractions. Environmental Toxicology and Chemistry 32(8): 1810-1818. 635
Cowan-Ellsberry, C.E., S.D. Dyer, S. Erhardt, M.J. Bernhard, A.L. Roe, M.E. Dowty and A.V. Weisbrod 636 (2008). Approach for extrapolating in vitro metabolism data to refine bioconcentration factor 637 estimates. Chemosphere 70(10): 1804-1817. 638
Cowan-Ellsberry, C.E., M.S. McLachlan, J.A. Arnot, M. Macleod, T.E. McKone and F. Wania (2009). 639 Modeling exposure to persistent chemicals in hazard and risk assessment. Integrated 640 Environmental Assessment and Management 5(4): 662-679. 641
Dyer, S.D., M.J. Bernhard, C. Cowan-Ellsberry, E. Perdu-Durand, S. Demmerle and J.-P. Cravedi (2008). 642 In vitro biotransformation of surfactants in fish. Part I: Linear alkylbenzene sulfonate (C12-643 LAS) and alcohol ethoxylate (C13EO8). Chemosphere 72(5): 850-862. 644
Dyer, S.D., M.J. Bernhard, C. Cowan-Ellsberry, E. Perdu-Durand, S. Demmerle and J.-P. Cravedi (2009). 645 In vitro biotransformation of surfactants in fish. Part II - Alcohol ethoxylate (C16EO8) and 646 alcohol ethoxylate sulfate (C14EO2S) to estimate bioconcentration potential. Chemosphere 647 76(7): 989-998. 648
20
Easterbrook, J., C. Lu, Y. Sakai and A.P. Li (2001). Effects of organic solvents on the activities of 649 cytochrome P450 isoforms, UDP-dependent glucuronyl transferase, and phenol 650 sulfotransferase in human hepatocytes. Drug Metabolism and Disposition 29(2): 141-144. 651
Escher, B.I., et al. (2011). Protein and lipid binding parameters in Rainbow Trout (Oncorhynchus 652 mykiss) blood and liver fractions to extrapolate from an in vitro metabolic degradation assay 653 to in vivo bioaccumulation potential of hydrophobic organic chemicals. Chemical Research in 654 Toxicology 24(7): 1134-1143. 655
Fay, K.A., P.N. Fitzsimmons, A.D. Hoffman and J.W. Nichols (2014). Optimizing the use of rainbow 656 trout hepatocytes for bioaccumulation assessments with fish. Xenobiotica 44(4): 345-351. 657
Fay, K.A., P.N. Fitzsimmons, A.D. Hoffman and J.W. Nichols (2016). Comparison of trout hepatocytes 658 and liver S9 fractions as in vitro models for predicting hepatic clearance in fish. 659 Environmental Toxicology and Chemistry. 660
Fay, K.A., et al. (2014). Intra- and Interlaboratory Reliability of a Cryopreserved Trout Hepatocyte 661 Assay for the Prediction of Chemical Bioaccumulation Potential. Environmental Science & 662 Technology 48(14): 8170-8178. 663
Fay, K.A., D.L. Nabb, R.T. Mingoia, I. Bischof, J.W. Nichols, H. Segner, K. Johanning and X. Han (2015). 664 Determination of Metabolic Stability Using Cryopreserved Hepatocytes from Rainbow Trout 665 (Oncorhynchus mykiss). Current Protocols in Toxicology 65: 4 42 41-44 42 29. 666
Godoy, P., et al. (2013). Recent advances in 2D and 3D in vitro systems using primary hepatocytes, 667 alternative hepatocyte sources and non-parenchymal liver cells and their use in investigating 668 mechanisms of hepatotoxicity, cell signaling and ADME. Archives of Toxicology 87(8): 1315-669 1530. 670
Gomez, C., L. Constantine, M. Moen, A. Vaz, W. Wang and D. Huggett (2011). Ibuprofen Metabolism 671 in the Liver and Gill of Rainbow Trout, Oncorhynchus mykiss. Bulletin of Environmental 672 Contamination and Toxicology 86(3): 247-251. 673
Gomez, C.F., L. Constantine and D.B. Huggett (2010). The influence of gill and liver metabolism on the 674 predicted bioconcentration of three pharmaceuticals in fish. Chemosphere 81(10): 1189-675 1195. 676
González, J.F., R. Reimschuessel, B. Shaikh and A.S. Kane (2009). Kinetics of hepatic phase I and II 677 biotransformation reactions in eight finfish species. Marine Environmental Research 67(4-5): 678 183-188. 679
Hallifax, D., J. Foster and J.B. Houston (2010). Prediction of Human Metabolic Clearance from In Vitro 680 Systems: Retrospective Analysis and Prospective View. Pharmaceutical Research 27(10): 681 2150-2161. 682
Hallifax, D. and J.B. Houston (2012). Evaluation of hepatic clearance prediction using in vitro data: 683 Emphasis on fraction unbound in plasma and drug ionisation using a database of 107 drugs. 684 Journal of Pharmaceutical Sciences 101(8): 2645-2652. 685
Hampton, J.A., R.C. Lantz and D.E. Hinton (1989). Functional units in rainbow trout (Salmo gairdneri, 686 Richardson) liver: III. Morphometric analysis of parenchyma, stroma, and component cell 687 types. American Journal of Anatomy 185(1): 58-73. 688
Han, X., R.T. Mingoia, D.L. Nabb, C.H. Yang, S.I. Snajdr and R.A. Hoke (2008). Xenobiotic intrinsic 689 clearance in freshly isolated hepatocytes from rainbow trout (Oncorhynchus mykiss): 690 determination of trout hepatocellularity, optimization of cell concentrations and comparison 691 of serum and serum-free incubations. Aquatic Toxicology 89(1): 11-17. 692
Han, X., D.L. Nabb, R.T. Mingoia and C.H. Yang (2007). Determination of xenobiotic intrinsic clearance 693 in freshly isolated hepatocytes from rainbow trout (Oncorhynchus mykiss) and rat and its 694 application in bioaccumulation assessment. Environmental Science & Technology 41(9): 695 3269-3276. 696
Han, X., D.L. Nabb, C.H. Yang, S.I. Snajdr and R.T. Mingoia (2009). Liver microsomes and S9 from 697 rainbow trout (Oncorhynchus mykiss): comparison of basal-level enzyme activities with rat 698 and determination of xenobiotic intrinsic clearance in support of bioaccumulation 699 assessment. Environmental Toxicology and Chemistry 28(3): 481-488. 700
21
Han, X., T. Shen and H. Lou (2007). Dietary polyphenols and their biological significance. International 701 Journal of Molecular Sciences 8(9): 950-988. 702
James, M.O. (1987). Conjugation of organic pollutants in aquatic species. Environ Health Perspect 71: 703 97-103. 704
Johanning, K., et al. (2012). Assessment of Metabolic Stability Using the Rainbow Trout 705 (Oncorhynchus mykiss) Liver S9 Fraction. Current Protocols in Toxicology Chapter 14: 706 Unit14.10. 707
Kwon, J.-H., T. Wuethrich, P. Mayer and B.I. Escher (2009). Development of a dynamic delivery 708 method for in vitro bioassays. Chemosphere 76(1): 83-90. 709
Ladd, M.A., P.N. Fitzsimmons and J.W. Nichols (2016). Optimization of a UDP-glucuronosyltransferase 710 assay for trout liver S9 fractions: activity enhancement by alamethicin, a pore-forming 711 peptide. Xenobiotica: 1-10. 712
Laue, H., H. Gfeller, K.J. Jenner, J.W. Nichols, S. Kern and A. Natsch (2014). Predicting the 713 Bioconcentration of Fragrance Ingredients by Rainbow Trout Using Measured Rates of in 714 Vitro Intrinsic Clearance. Environmental Science & Technology 48(16): 9486-9495. 715
Lee, Y.-S., D.H.Y. Lee, M. Delafoulhouze, S.V. Otton, M.M. Moore, C.J. Kennedy and F.A.P.C. Gobas 716 (2014). In vitro biotransformation rates in fish liver S9: Effect of dosing techniques. 717 Environmental Toxicology and Chemistry 33(8): 1885-1893. 718
Lee, Y.-S., S.V. Otton, D.A. Campbell, M.M. Moore, C.J. Kennedy and F.A.P.C. Gobas (2011). 719 Measuring In Vitro Biotransformation Rates of Super Hydrophobic Chemicals in Rat Liver S9 720 Fractions Using Thin-Film Sorbent-Phase Dosing. Environmental Science & Technology 46(1): 721 410-418. 722
Li, A.P. (2007). Human hepatocytes: Isolation, cryopreservation and applications in drug 723 development. Chemico-Biological Interactions 168(1): 16-29. 724
Lo, J.C., G.N. Allard, S.V. Otton, D.A. Campbell and F.A. Gobas (2015). Concentration dependence of 725 biotransformation in fish liver S9: Optimizing substrate concentrations to estimate hepatic 726 clearance for bioaccumulation assessment. Environmental Toxicology and Chemistry 34(12): 727 2782-2790. 728
Mingoia, R.T., K.P. Glover, D.L. Nabb, C.H. Yang, S.I. Snajdr and X. Han (2010). Cryopreserved 729 Hepatocytes from Rainbow Trout (Oncorhynchus mykiss): A Validation Study to Support Their 730 Application in Bioaccumulation Assessment. Environmental Science & Technology 44(8): 731 3052-3058. 732
Nabb, D.L., R.T. Mingoia, C.-H. Yang and X. Han (2006). Comparison of basal level metabolic enzyme 733 activities of freshly isolated hepatocytes from rainbow trout (Oncorhynchus mykiss) and rat. 734 Aquatic Toxicology 80(1): 52-59. 735
Nendza, M., et al. (2010). Chapter 4 Data Quality Assessment for In Silico Methods: A Survey of 736 Approaches and Needs. In Silico Toxicology: Principles and Applications, The Royal Society of 737 Chemistry: 59-117. 738
Nichols, J.W., M. Bonnell, S.D. Dimitrov, B.I. Escher, X. Han and N.I. Kramer (2009). Bioaccumulation 739 assessment using predictive approaches. Integr Environ Assess Manag 5(4): 577-597. 740
Nichols, J.W., A.D. Hoffman, T.L. ter Laak and P.N. Fitzsimmons (2013). Hepatic clearance of six 741 polycyclic aromatic hydrocarbons by isolated perfused trout livers: Prediction from in vitro 742 clearance by liver S9 fractions. Toxicological Sciences 136(2): 359-372. 743
Nichols, J.W., D.B. Huggett, J.A. Arnot, P.N. Fitzsimmons and C.E. Cowan-Ellsberry (2013). Towards 744 improved models for predicting bioconcentration of well-metabolized compounds by 745 rainbow trout using measured rates of in vitro intrinsic clearance. Environmental Toxicology 746 and Chemistry 32(7): 1611-1622. 747
Nichols, J.W., I.R. Schultz and P.N. Fitzsimmons (2006). In vitro-in vivo extrapolation of quantitative 748 hepatic biotransformation data for fish. I. A review of methods, and strategies for 749 incorporating intrinsic clearance estimates into chemical kinetic models. Aquatic Toxicology 750 78(1): 74-90. 751
22
OECD (2000). Guidance document on aquatic toxicity testing of difficult substances and mixtures. 752 Series on Testing and Assessment, No.23. 753
OECD (2004). OECD Guidelines for the Testing of Chemicals - Partition Coefficient (n-octanol/water). 754 High Performance Liquid Chromatography (HPLC) Method. OECD testing guidelines 117(13 755 April 2004). 756
OECD (2012). OECD Guidelines for testing of chemicals - Bioaccumulation in Fish: Aqueous and 757 Dietary Exposure; 305, last updated 2 October. Paris, France. 758
OECD (xxxx). Determination of in vitro intrinsic clearance using cryopreserved rainbow trout 759 hepatocytes (RT-HEP). OECD testing guidelines Test No. xxx. 760
OECD (xxxx). Determination of in vitro intrinsic clearance using rainbow trout liver S9 sub-cellular 761 fraction (RT-S9). OECD testing guidelines Test No. xxx. 762
OECD (xxxx). Multi-laboratory ring trial to support development of OECD test guidelines on 763 determination of in vitro intrinsic clearance using cryopreserved rainbow trout hepatocytes 764 and liver S9 sub-cellular fractions. 765
Plakas, S.M. and M.O. James (1990). Bioavailability, metabolism, and renal excretion of benzoic acid 766 in the channel catfish (Ictalurus punctatus). Drug Metabolism and Disposition 18(5): 552-556. 767
Sakalli, S., V. Burkina, V. Zlabek and G. Zamaratskaia (2015). Effects of acetone, acetonitrile, ethanol, 768 methanol and DMSO on cytochrome P450 in rainbow trout (Oncorhynchus mykiss) hepatic 769 microsomes. Toxicol Mech Methods 25(6): 501-506. 770
Schultz, I.R. and W.L. Hayton (1999). Interspecies scaling of the bioaccumulation of lipophilic 771 xenobiotics in fish: An example using trifluralin. Environmental Toxicology and Chemistry 772 18(7): 1440-1449. 773
Smith, E.M., F.I. Iftikar, S. Higgins, A. Irshad, R. Jandoc, M. Lee and J.Y. Wilson (2012). In vitro 774 inhibition of cytochrome P450-mediated reactions by gemfibrozil, erythromycin, 775 ciprofloxacin and fluoxetine in fish liver microsomes. Aquatic Toxicology 109(0): 259-266. 776
Strobel, A., P. Burkhardt-Holm, P. Schmid and H. Segner (2015). Benzo(a)pyrene Metabolism and 777 EROD and GST Biotransformation Activity in the Liver of Red- and White-Blooded Antarctic 778 Fish. Environmental Science & Technology 49(13): 8022-8032. 779
Thibaut, R., S. Schnell and C. Porte (2006). The Interference of Pharmaceuticals with Endogenous and 780 Xenobiotic Metabolizing Enzymes in Carp Liver: An In-Vitro Study. Environmental Science & 781 Technology 40(16): 5154-5160. 782
U.S. Environmental Protection Agency, E.A.B.W., DC. (2013). Exposure Assessment Tools and Models, 783 Estimation Program Interface (EPI) Suite, Version 4.1. 784
785
786
23
ANNEX 1 787
Abbreviations 788
789
BCF Bioconcentration factor 790
BCFTOT Bioconcentration factor expressed on a total chemical basis (L/kg) 791
BCFFD,L Bioconcentration factor normalized for fish lipid content (L/kg lipid) 792
CFISH,SS chemical concentration in fish at steady state (mg/kg) 793
CLH in vivo hepatic clearance (L/d kg) 794
CLIN VITRO, INT in vitro intrinsic clearance (mL/h/106 cells or mL/h/mg protein) 795
CLIN VIVO, INT in vivo intrinsic clearance (mL/h/g fish) 796
CYP Cytochrome P450 797
CW,TOT chemical concentration in water (mg/L) 798
DMEM Dulbecco’s modified Eagle’s medium 799
DMSO Dimethyl sulfoxide 800
EROD Ethoxyresorufin-O-deethylase 801
fU binding term used to correct for binding effects in vitro and in plasma 802
U,HEP free chemical fractions in the in vitro system (RT-HEP; unitless) 803
fU, P free chemical fractions in blood plasma (unitless) 804
U,S9 free chemical fractions in the in vitro system (RT-S9; unitless) 805
GC Gas Chromatography 806
GSH L-Glutathione 807
GST Glutathione transferase 808
HPLC High Performance Liquid Chromatography 809
IVIVE model In vitro to in vivo extrapolation model 810
KM Michaelis-Menton constant 811
kMET Whole-body biotransformation rate constant (1/d) 812
log Kow n-Octanol-water partition coefficient 813
L-15 Leibovitz-15 814
24
LOQ Limit of quantification 815
LS9 S9 content of liver tissue (;mg/g liver) 816
LHEP hepatocellularity (106 cells/g liver/g fish) 817
MS Mass spectrometry 818
MTBE methyl tert-butyl ether 819
NADPH Nicotinamide adenine dinucleotide 2'-phosphate 820
PAH Polycyclic aromatic hydrocarbon 821
PAPS Adenosine 3'-phosphate 5'-phosphosulfate 822
pKa Acid dissociation constant 823
QH Liver blood flow rate (mL/h/g liver) 824
RT-HEP Rainbow trout hepatocytes 825
RT-S9 Rainbow trout liver S9 sub-cellular fraction 826
SULT Sulfotransferase 827
TG Test Guideline 828
UDPGA Uridine 5'-diphosphoglucuronic acid 829
UGT Uridine 5'-diphospho-glucuronosyltransferase 830
Vmax maximum enzymatic rate at saturating test chemical concentration 831
25
Annex 2 832
Preparation of room temperature inactivated RT-S9 833
1. For certain chemicals the use of enzymatically inactive RT-S9 generated by heat-inactivation 834
as negative control may lead to substantial abiotic decrease in the control as discussed in section 835
4.1.1. If the decrease of the test chemical is >20% in presence of heat-inactivated RT-S9 which cannot 836
be diminished as described in sections 3.6-3.8, room-temperature inactivated (RTI) RT-S9 fractions 837
may be used as an alternative negative control. 838
2. This enzymatically inactive RT-S9 can be prepared by incubating active RT-S9 at room 839
temperature for 24 h as described below. Negative control incubations with RTI RT-S9 are carried out 840
in presence of alamethicin, but without addition of any cofactors. 841
3. To prepare RTI RT-S9, an appropriate volume of active RT-S9 is thawed and diluted to 10.0 842
mg/mL protein by adding 100 mM potassium phosphate buffer, pH 7.8. 843
4. The vial(s) with the diluted RT-S9 are incubated for 24 h at room temperature for inactivation 844
and stored for at least 24 h at -20°C prior to use. 845
5. Negative control incubations with RTI RT-S9 should be carried out in presence of alamethicin, 846
but without addition of any cofactors. The final composition of the reaction mixture for the RTI RT-S9 847
control in one 7 mL scintillation vial prior to dosing is as follows: 848
a. 800 µL 100 mM K-PO4 buffer 849 b. 100 µL pre-diluted RTI S9 (10 mg/mL protein) 850 c. 100 µL 250 µg/mL alamethicin 851
852
6. Excess RTI RT-S9 material may be refrozen at -20°C for further use. 853
26
Annex 3 854
Spreadsheets for calculation of BCFs using the hepatocyte-bioconcentration factor 855
model (HEP-BCF) and the S9-bioconcentration factor (S9-BCF) model 856
857
Table 1. Independent variable inputs to be set to the hepatocyte-bioconcentration factor (HEP-BCF) 858
model for the BCF prediction of methoxychlor as example. 859
Parameter Value Units
Log Kow of test chemical1 5.1 Unitless Body weight of fish used as source of hepatocytes2 364 g Hepatocyte cell number (CHEP)3 2.2 × 10⁶ cells/mL Reaction rate (Rate) 0.128 1/h Modelled temperature (T) 12 Celsius Total aqueous chemical concentration (Cw, TOT)
2 1.0 mg/L 1log Kow of test chemical can be measured or estimated 860 2does not impact BCF calculations 861 3final cell number was verified by recounting 862
863
864
Table 2. Independent variable inputs to be set to the S9 bioconcentration factor (S9-BCF) model for 865
the BCF prediction of methoxychlor as example. 866
Parameter Value Units
Log Kow of test chemical1 5.1 Unitless Body weight of fish used as source of S92 310 g S9 protein concentration (CS9) in the assay 1.0 mg/mL Reaction rate (Rate) 0.359 1/h Modelled temperature (T) 12 Celsius Total aqueous chemical concentration (Cw, TOT)
2 1.0 mg/L 1log Kow of test chemical can be measured or estimated 867 2does not impact BCF calculations 868
869
870
871
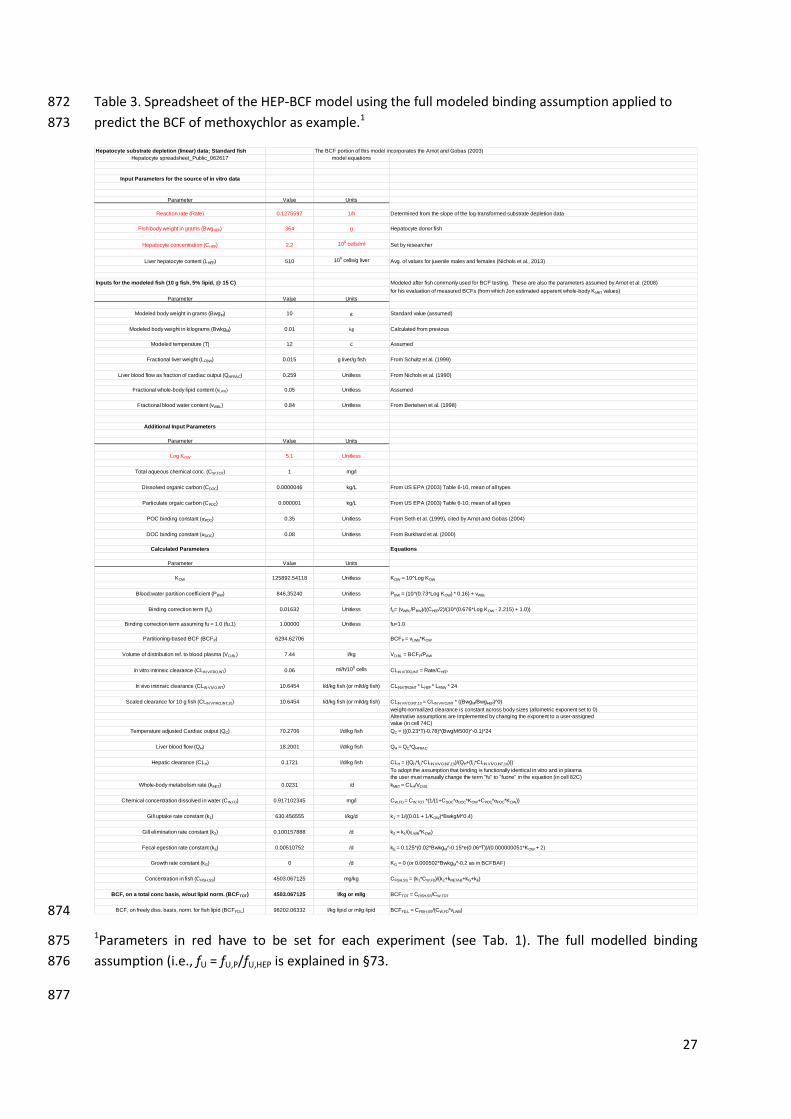
27
Table 3. Spreadsheet of the HEP-BCF model using the full modeled binding assumption applied to 872
predict the BCF of methoxychlor as example.1 873
874
1Parameters in red have to be set for each experiment (see Tab. 1). The full modelled binding 875
assumption (i.e., fU = fU,P/fU,HEP is explained in §73. 876
877
Hepatocyte substrate depletion (linear) data; Standard fish The BCF portion of this model incorporates the Arnot and Gobas (2003)
Hepatocyte spreadsheet_Public_062617 model equations
Input Parameters for the source of in vitro data
Parameter Value Units
Reaction rate (Rate) 0.1275597 1/h Determined from the slope of the log-transformed substrate depletion data
Fish body weight in grams (BwgHEP) 364 g Hepatocyte donor fish
Hepatocyte concentration (CHEP) 2.2 106 cells/ml Set by researcher
Liver hepatocyte content (LHEP) 510 106 cells/g liver Avg. of values for juvenile males and females (Nichols et al., 2013)
Inputs for the modeled fish (10 g fish, 5% lipid, @ 15 C) Modeled after fish commonly used for BCF testing. These are also the parameters assumed by Arnot et al. (2008)
for his evaluation of measured BCFs (from which Jon estimated apparent whole-body KMET values)
Parameter Value Units
Modeled body weight in grams (BwgM) 10 g Standard value (assumed)
Modeled body weight in kilograms (BwkgM) 0.01 kg Calculated from previous
Modeled temperature (T) 12 C Assumed
Fractional liver weight (LFBW) 0.015 g liver/g fish From Schultz et al. (1999)
Liver blood flow as fraction of cardiac output (QHFRAC) 0.259 Unitless From Nichols et al. (1990)
Fractional whole-body lipid content (vLWB) 0.05 Unitless Assumed
Fractional blood water content (vWBL) 0.84 Unitless From Bertelsen et al. (1998)
Additional Input Parameters
Parameter Value Units
Log KOW 5.1 Unitless
Total aqueous chemical conc. (CW,TOT) 1 mg/l
Dissolved organic carbon (CDOC) 0.0000046 kg/L From US EPA (2003) Table 6-10, mean of all types
Particulate orgaic carbon (CPOC) 0.000001 kg/L From US EPA (2003) Table 6-10, mean of all types
POC binding constant (αPOC) 0.35 Unitless From Seth et al. (1999), cited by Arnot and Gobas (2004)
DOC binding constant (αDOC) 0.08 Unitless From Burkhard et al. (2000)
Calculated Parameters Equations
Parameter Value Units
KOW 125892.54118 Unitless KOW = 10^Log KOW
Blood:water partition coefficient (PBW) 846.35240 Unitless PBW = (10^(0.73*Log KOW) * 0.16) + vWBL
Binding correction term (fU) 0.01632 Unitless fU= (vWBL/PBW)/((CHEP/2)/(10^(0.676*Log KOW - 2.215) + 1.0))
Binding correction term assuming fu = 1.0 (fu,1) 1.00000 Unitless fu=1.0
Partitioning-based BCF (BCFP) 6294.62706 BCFP = vLWB*KOW
Volume of distribution ref. to blood plasma (VD,BL) 7.44 l/kg VD,BL = BCFP/PBW
In vitro intrinsic clearance (CLIN VITRO,INT) 0.06 ml/h/106 cells CLIN VITRO,INT = Rate/CHEP
In vivo intrinsic clearance (CLIN VIVO,INT) 10.6454 l/d/kg fish (or ml/d/g fish) CLINVITROINT * LHEP * LFBW * 24
Scaled clearance for 10 g fish (CLIN VITRO,INT,10) 10.6454 l/d/kg fish (or ml/d/g fish) CLIN VIVO,INT,10 = CLIN VIVO,INT * ((BwgM/BwgHEP)^0)
weight-normalized clearance is constant across body sizes (allometric exponent set to 0)
Alternative assumptions are implemented by changing the exponent to a user-assigned
value (in cell 74C)
Temperature adjusted Cardiac output (QC) 70.2706 l/d/kg fish QC = (((0.23*T)-0.78)*(BwgM/500)^-0.1)*24
Liver blood flow (QH) 18.2001 l/d/kg fish QH = QC*QHFRAC
Hepatic clearance (CLH) 0.1721 l/d/kg fish CLH = ((QH*fU*CLIN VIVO,INT,10)/(QH+(fU*CLIN VIVO,INT,10)))
To adopt the assumption that binding is functionally identical in vitro and in plasma
the user must manually change the term "fu" to "fuone" in the equation (in cell 82C)
Whole-body metabolism rate (kMET) 0.0231 /d kMET = CLH/VD,BL
Chemical concentration dissolved in water (CW,FD) 0.917102345 mg/l CW,FD = CW,TOT *(1/(1+CDOC*αDOC*KOW+CPOC*αPOC*KOW))
Gill uptake rate constant (k1) 630.456555 l/kg/d k1 = 1/((0.01 + 1/KOW)*BwkgM^0.4)
Gill elimination rate constant (k2) 0.100157888 /d k2 = k1/(vLWB*KOW)
Fecal egestion rate constant (kE) 0.00510752 /d kE = 0.125*(0.02*BwkgM^-0.15*e(0.06*T))/(0.000000051*KOW + 2)
Growth rate constant (kG) 0 /d KG = 0 (or 0.000502*BwkgM^-0.2 as in BCFBAF)
Concentration in fish (CFISH,SS) 4503.067125 mg/kg CFISH,SS = (k1*CW,FD)/(k2+kMETAB+kG+kE)
BCF, on a total conc basis, w/out lipid norm. (BCFTOT) 4503.067125 l/kg or ml/g BCFTOT = CFISH,SS/CW,TOT
BCF, on freely diss. basis, norm. for fish lipid (BCFFD,L) 98202.06332 l/kg lipid or ml/g lipid BCFFD,L = CFISH,SS/(CW,FD*vLWB)
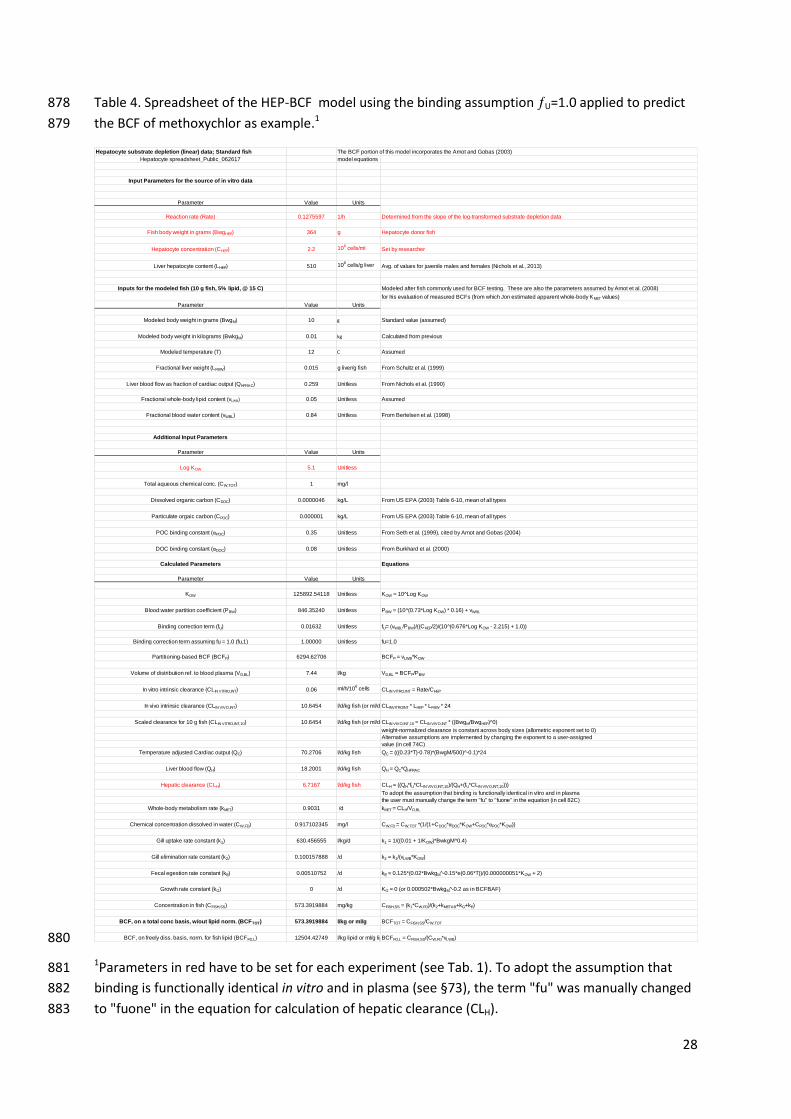
28
Table 4. Spreadsheet of the HEP-BCF model using the binding assumption U=1.0 applied to predict 878
the BCF of methoxychlor as example.1 879
880
1Parameters in red have to be set for each experiment (see Tab. 1). To adopt the assumption that 881
binding is functionally identical in vitro and in plasma (see §73), the term "fu" was manually changed 882
to "fuone" in the equation for calculation of hepatic clearance (CLH). 883
Hepatocyte substrate depletion (linear) data; Standard fish The BCF portion of this model incorporates the Arnot and Gobas (2003)
Hepatocyte spreadsheet_Public_062617 model equations
Input Parameters for the source of in vitro data
Parameter Value Units
Reaction rate (Rate) 0.1275597 1/h Determined from the slope of the log-transformed substrate depletion data
Fish body weight in grams (BwgHEP) 364 g Hepatocyte donor fish
Hepatocyte concentration (CHEP) 2.2 106 cells/ml Set by researcher
Liver hepatocyte content (LHEP) 510 106 cells/g liver Avg. of values for juvenile males and females (Nichols et al., 2013)
Inputs for the modeled fish (10 g fish, 5% lipid, @ 15 C) Modeled after fish commonly used for BCF testing. These are also the parameters assumed by Arnot et al. (2008)
for his evaluation of measured BCFs (from which Jon estimated apparent whole-body KMET values)
Parameter Value Units
Modeled body weight in grams (BwgM) 10 g Standard value (assumed)
Modeled body weight in kilograms (BwkgM) 0.01 kg Calculated from previous
Modeled temperature (T) 12 C Assumed
Fractional liver weight (LFBW) 0.015 g liver/g fish From Schultz et al. (1999)
Liver blood flow as fraction of cardiac output (QHFRAC) 0.259 Unitless From Nichols et al. (1990)
Fractional whole-body lipid content (vLWB) 0.05 Unitless Assumed
Fractional blood water content (vWBL) 0.84 Unitless From Bertelsen et al. (1998)
Additional Input Parameters
Parameter Value Units
Log KOW 5.1 Unitless
Total aqueous chemical conc. (CW,TOT) 1 mg/l
Dissolved organic carbon (CDOC) 0.0000046 kg/L From US EPA (2003) Table 6-10, mean of all types
Particulate orgaic carbon (CPOC) 0.000001 kg/L From US EPA (2003) Table 6-10, mean of all types
POC binding constant (αPOC) 0.35 Unitless From Seth et al. (1999), cited by Arnot and Gobas (2004)
DOC binding constant (αDOC) 0.08 Unitless From Burkhard et al. (2000)
Calculated Parameters Equations
Parameter Value Units
KOW 125892.54118 Unitless KOW = 10^Log KOW
Blood:water partition coefficient (PBW) 846.35240 Unitless PBW = (10^(0.73*Log KOW) * 0.16) + vWBL
Binding correction term (fU) 0.01632 Unitless fU= (vWBL/PBW)/((CHEP/2)/(10^(0.676*Log KOW - 2.215) + 1.0))
Binding correction term assuming fu = 1.0 (fu,1) 1.00000 Unitless fu=1.0
Partitioning-based BCF (BCFP) 6294.62706 BCFP = vLWB*KOW
Volume of distribution ref. to blood plasma (VD,BL) 7.44 l/kg VD,BL = BCFP/PBW
In vitro intrinsic clearance (CLIN VITRO,INT) 0.06 ml/h/106 cells CLIN VITRO,INT = Rate/CHEP
In vivo intrinsic clearance (CLIN VIVO,INT) 10.6454 l/d/kg fish (or ml/d/g fish)CLINVITROINT * LHEP * LFBW * 24
Scaled clearance for 10 g fish (CLIN VITRO,INT,10) 10.6454 l/d/kg fish (or ml/d/g fish)CLIN VIVO,INT,10 = CLIN VIVO,INT * ((BwgM/BwgHEP)^0)
weight-normalized clearance is constant across body sizes (allometric exponent set to 0)
Alternative assumptions are implemented by changing the exponent to a user-assigned
value (in cell 74C)
Temperature adjusted Cardiac output (QC) 70.2706 l/d/kg fish QC = (((0.23*T)-0.78)*(BwgM/500)^-0.1)*24
Liver blood flow (QH) 18.2001 l/d/kg fish QH = QC*QHFRAC
Hepatic clearance (CLH) 6.7167 l/d/kg fish CLH = ((QH*fU*CLIN VIVO,INT,10)/(QH+(fU*CLIN VIVO,INT,10)))
To adopt the assumption that binding is functionally identical in vitro and in plasma
the user must manually change the term "fu" to "fuone" in the equation (in cell 82C)
Whole-body metabolism rate (kMET) 0.9031 /d kMET = CLH/VD,BL
Chemical concentration dissolved in water (CW,FD) 0.917102345 mg/l CW,FD = CW,TOT *(1/(1+CDOC*αDOC*KOW+CPOC*αPOC*KOW))
Gill uptake rate constant (k1) 630.456555 l/kg/d k1 = 1/((0.01 + 1/KOW)*BwkgM^0.4)
Gill elimination rate constant (k2) 0.100157888 /d k2 = k1/(vLWB*KOW)
Fecal egestion rate constant (kE) 0.00510752 /d kE = 0.125*(0.02*BwkgM^-0.15*e(0.06*T))/(0.000000051*KOW + 2)
Growth rate constant (kG) 0 /d KG = 0 (or 0.000502*BwkgM^-0.2 as in BCFBAF)
Concentration in fish (CFISH,SS) 573.3919884 mg/kg CFISH,SS = (k1*CW,FD)/(k2+kMETAB+kG+kE)
BCF, on a total conc basis, w/out lipid norm. (BCFTOT) 573.3919884 l/kg or ml/g BCFTOT = CFISH,SS/CW,TOT
BCF, on freely diss. basis, norm. for fish lipid (BCFFD,L) 12504.42749 l/kg lipid or ml/g lipidBCFFD,L = CFISH,SS/(CW,FD*vLWB)
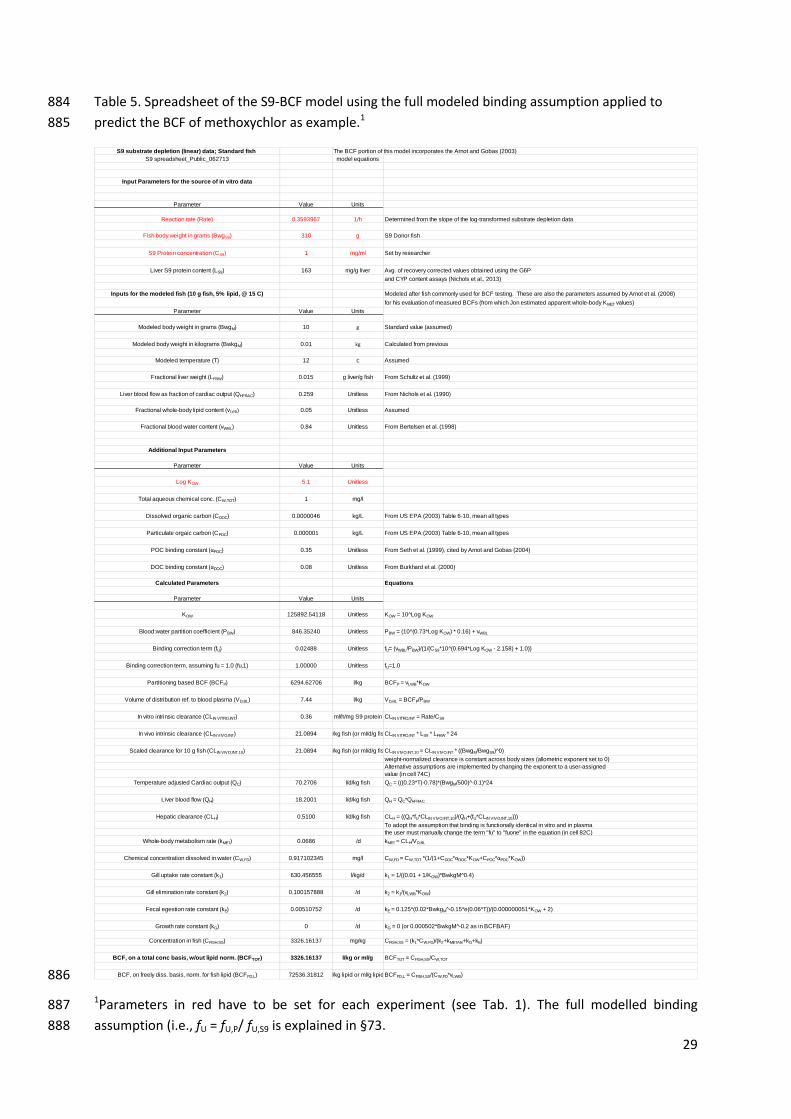
29
Table 5. Spreadsheet of the S9-BCF model using the full modeled binding assumption applied to 884
predict the BCF of methoxychlor as example.1 885
886
1Parameters in red have to be set for each experiment (see Tab. 1). The full modelled binding 887
assumption (i.e., fU = fU,P/ fU,S9 is explained in §73. 888
S9 substrate depletion (linear) data; Standard fish The BCF portion of this model incorporates the Arnot and Gobas (2003)
S9 spreadsheet_Public_062713 model equations
Input Parameters for the source of in vitro data
Parameter Value Units
Reaction rate (Rate) 0.3593967 1/h Determined from the slope of the log-transformed substrate depletion data
Fish body weight in grams (BwgS9) 310 g S9 Donor fish
S9 Protein concentration (CS9) 1 mg/ml Set by researcher
Liver S9 protein content (LS9) 163 mg/g liver Avg. of recovery corrected values obtained using the G6P
and CYP content assays (Nichols et al., 2013)
Inputs for the modeled fish (10 g fish, 5% lipid, @ 15 C) Modeled after fish commonly used for BCF testing. These are also the parameters assumed by Arnot et al. (2008)
for his evaluation of measured BCFs (from which Jon estimated apparent whole-body KMET values)
Parameter Value Units
Modeled body weight in grams (BwgM) 10 g Standard value (assumed)
Modeled body weight in kilograms (BwkgM) 0.01 kg Calculated from previous
Modeled temperature (T) 12 C Assumed
Fractional liver weight (LFBW) 0.015 g liver/g fish From Schultz et al. (1999)
Liver blood flow as fraction of cardiac output (QHFRAC) 0.259 Unitless From Nichols et al. (1990)
Fractional whole-body lipid content (vLWB) 0.05 Unitless Assumed
Fractional blood water content (vWBL) 0.84 Unitless From Bertelsen et al. (1998)
Additional Input Parameters
Parameter Value Units
Log KOW 5.1 Unitless
Total aqueous chemical conc. (CW,TOT) 1 mg/l
Dissolved organic carbon (CDOC) 0.0000046 kg/L From US EPA (2003) Table 6-10, mean all types
Particulate orgaic carbon (CPOC) 0.000001 kg/L From US EPA (2003) Table 6-10, mean all types
POC binding constant (αPOC) 0.35 Unitless From Seth et al. (1999), cited by Arnot and Gobas (2004)
DOC binding constant (αDOC) 0.08 Unitless From Burkhard et al. (2000)
Calculated Parameters Equations
Parameter Value Units
KOW 125892.54118 Unitless KOW = 10^Log KOW
Blood:water partition coefficient (PBW) 846.35240 Unitless PBW = (10^(0.73*Log KOW) * 0.16) + vWBL
Binding correction term (fU) 0.02488 Unitless fU= (vWBL/PBW)/(1/(CS9*10^(0.694*Log KOW - 2.158) + 1.0))
Binding correction term, assuming fu = 1.0 (fu,1) 1.00000 Unitless fU=1.0
Partitioning based BCF (BCFP) 6294.62706 l/kg BCFP = vLWB*KOW
Volume of distribution ref. to blood plasma (VD,BL) 7.44 l/kg VD,BL = BCFP/PBW
In vitro intrinsic clearance (CLIN VITRO,INT) 0.36 ml/h/mg S9 protein CLIN VITRO,INT = Rate/CS9
In vivo intrinsic clearance (CLIN VIVO,INT) 21.0894 l/d/kg fish (or ml/d/g fish)CLIN VITRO,INT * LS9 * LFBW * 24
Scaled clearance for 10 g fish (CLIN VIVO,INT,10) 21.0894 l/d/kg fish (or ml/d/g fish)CLIN VIVO,INT,10 = CLIN VIVO,INT * ((BwgM/BwgS9)^0)
weight-normalized clearance is constant across body sizes (allometric exponent set to 0)
Alternative assumptions are implemented by changing the exponent to a user-assigned
value (in cell 74C)
Temperature adjusted Cardiac output (QC) 70.2706 l/d/kg fish QC = (((0.23*T)-0.78)*(BwgM/500)^-0.1)*24
Liver blood flow (QH) 18.2001 l/d/kg fish QH = QC*QHFRAC
Hepatic clearance (CLH) 0.5100 l/d/kg fish CLH = ((QH*fU*CLIN VIVO,INT,10)/(QH+(fU*CLIN VIVO,INT,10)))
To adopt the assumption that binding is functionally identical in vitro and in plasma
the user must manually change the term "fu" to "fuone" in the equation (in cell 82C)
Whole-body metabolism rate (kMET) 0.0686 /d kMET = CLH/VD,BL
Chemical concentration dissolved in water (CW,FD) 0.917102345 mg/l CW,FD = CW,TOT *(1/(1+CDOC*αDOC*KOW+CPOC*αPOC*KOW))
Gill uptake rate constant (k1) 630.456555 l/kg/d k1 = 1/((0.01 + 1/KOW)*BwkgM^0.4)
Gill elimination rate constant (k2) 0.100157888 /d k2 = k1/(vLWB*KOW)
Fecal egestion rate constant (kE) 0.00510752 /d kE = 0.125*(0.02*BwkgM^-0.15*e(0.06*T))/(0.000000051*KOW + 2)
Growth rate constant (kG) 0 /d kG = 0 (or 0.000502*BwkgM^-0.2 as in BCFBAF)
Concentration in fish (CFISH,SS) 3326.16137 mg/kg CFISH,SS = (k1*CW,FD)/(k2+kMETAB+kG+kE)
BCF, on a total conc basis, w/out lipid norm. (BCFTOT) 3326.16137 l/kg or ml/g BCFTOT = CFISH,SS/CW,TOT
BCF, on freely diss. basis, norm. for fish lipid (BCFFD,L) 72536.31812 l/kg lipid or ml/g lipid BCFFD,L = CFISH,SS/(CW,FD*vLWB)
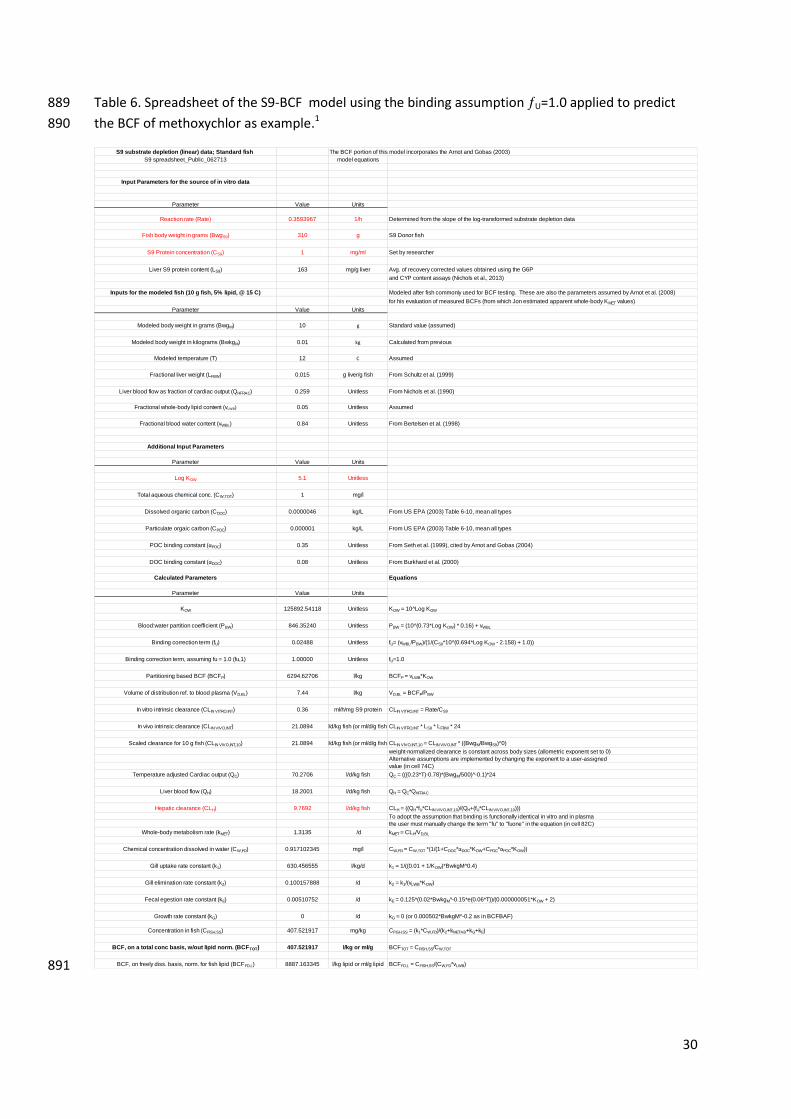
30
Table 6. Spreadsheet of the S9-BCF model using the binding assumption U=1.0 applied to predict 889
the BCF of methoxychlor as example.1 890
891
S9 substrate depletion (linear) data; Standard fish The BCF portion of this model incorporates the Arnot and Gobas (2003)
S9 spreadsheet_Public_062713 model equations
Input Parameters for the source of in vitro data
Parameter Value Units
Reaction rate (Rate) 0.3593967 1/h Determined from the slope of the log-transformed substrate depletion data
Fish body weight in grams (BwgS9) 310 g S9 Donor fish
S9 Protein concentration (CS9) 1 mg/ml Set by researcher
Liver S9 protein content (LS9) 163 mg/g liver Avg. of recovery corrected values obtained using the G6P
and CYP content assays (Nichols et al., 2013)
Inputs for the modeled fish (10 g fish, 5% lipid, @ 15 C) Modeled after fish commonly used for BCF testing. These are also the parameters assumed by Arnot et al. (2008)
for his evaluation of measured BCFs (from which Jon estimated apparent whole-body KMET values)
Parameter Value Units
Modeled body weight in grams (BwgM) 10 g Standard value (assumed)
Modeled body weight in kilograms (BwkgM) 0.01 kg Calculated from previous
Modeled temperature (T) 12 C Assumed
Fractional liver weight (LFBW) 0.015 g liver/g fish From Schultz et al. (1999)
Liver blood flow as fraction of cardiac output (QHFRAC) 0.259 Unitless From Nichols et al. (1990)
Fractional whole-body lipid content (vLWB) 0.05 Unitless Assumed
Fractional blood water content (vWBL) 0.84 Unitless From Bertelsen et al. (1998)
Additional Input Parameters
Parameter Value Units
Log KOW 5.1 Unitless
Total aqueous chemical conc. (CW,TOT) 1 mg/l
Dissolved organic carbon (CDOC) 0.0000046 kg/L From US EPA (2003) Table 6-10, mean all types
Particulate orgaic carbon (CPOC) 0.000001 kg/L From US EPA (2003) Table 6-10, mean all types
POC binding constant (αPOC) 0.35 Unitless From Seth et al. (1999), cited by Arnot and Gobas (2004)
DOC binding constant (αDOC) 0.08 Unitless From Burkhard et al. (2000)
Calculated Parameters Equations
Parameter Value Units
KOW 125892.54118 Unitless KOW = 10^Log KOW
Blood:water partition coefficient (PBW) 846.35240 Unitless PBW = (10^(0.73*Log KOW) * 0.16) + vWBL
Binding correction term (fU) 0.02488 Unitless fU= (vWBL/PBW)/(1/(CS9*10^(0.694*Log KOW - 2.158) + 1.0))
Binding correction term, assuming fu = 1.0 (fu,1) 1.00000 Unitless fU=1.0
Partitioning based BCF (BCFP) 6294.62706 l/kg BCFP = vLWB*KOW
Volume of distribution ref. to blood plasma (VD,BL) 7.44 l/kg VD,BL = BCFP/PBW
In vitro intrinsic clearance (CLIN VITRO,INT) 0.36 ml/h/mg S9 protein CLIN VITRO,INT = Rate/CS9
In vivo intrinsic clearance (CLIN VIVO,INT) 21.0894 l/d/kg fish (or ml/d/g fish)CLIN VITRO,INT * LS9 * LFBW * 24
Scaled clearance for 10 g fish (CLIN VIVO,INT,10) 21.0894 l/d/kg fish (or ml/d/g fish)CLIN VIVO,INT,10 = CLIN VIVO,INT * ((BwgM/BwgS9)^0)
weight-normalized clearance is constant across body sizes (allometric exponent set to 0)
Alternative assumptions are implemented by changing the exponent to a user-assigned
value (in cell 74C)
Temperature adjusted Cardiac output (QC) 70.2706 l/d/kg fish QC = (((0.23*T)-0.78)*(BwgM/500)^-0.1)*24
Liver blood flow (QH) 18.2001 l/d/kg fish QH = QC*QHFRAC
Hepatic clearance (CLH) 9.7692 l/d/kg fish CLH = ((QH*fU*CLIN VIVO,INT,10)/(QH+(fU*CLIN VIVO,INT,10)))
To adopt the assumption that binding is functionally identical in vitro and in plasma
the user must manually change the term "fu" to "fuone" in the equation (in cell 82C)
Whole-body metabolism rate (kMET) 1.3135 /d kMET = CLH/VD,BL
Chemical concentration dissolved in water (CW,FD) 0.917102345 mg/l CW,FD = CW,TOT *(1/(1+CDOC*αDOC*KOW+CPOC*αPOC*KOW))
Gill uptake rate constant (k1) 630.456555 l/kg/d k1 = 1/((0.01 + 1/KOW)*BwkgM^0.4)
Gill elimination rate constant (k2) 0.100157888 /d k2 = k1/(vLWB*KOW)
Fecal egestion rate constant (kE) 0.00510752 /d kE = 0.125*(0.02*BwkgM^-0.15*e(0.06*T))/(0.000000051*KOW + 2)
Growth rate constant (kG) 0 /d kG = 0 (or 0.000502*BwkgM^-0.2 as in BCFBAF)
Concentration in fish (CFISH,SS) 407.521917 mg/kg CFISH,SS = (k1*CW,FD)/(k2+kMETAB+kG+kE)
BCF, on a total conc basis, w/out lipid norm. (BCFTOT) 407.521917 l/kg or ml/g BCFTOT = CFISH,SS/CW,TOT
BCF, on freely diss. basis, norm. for fish lipid (BCFFD,L) 8887.163345 l/kg lipid or ml/g lipid BCFFD,L = CFISH,SS/(CW,FD*vLWB)
31
1Parameters in red have to be set for each experiment (see Tab. 1). To adopt the assumption that 892
binding is functionally identical in vitro and in plasma (see §73), the term "fu" was manually changed 893
to "fuone" in the equation for calculation of hepatic clearance (CLH). 894
895
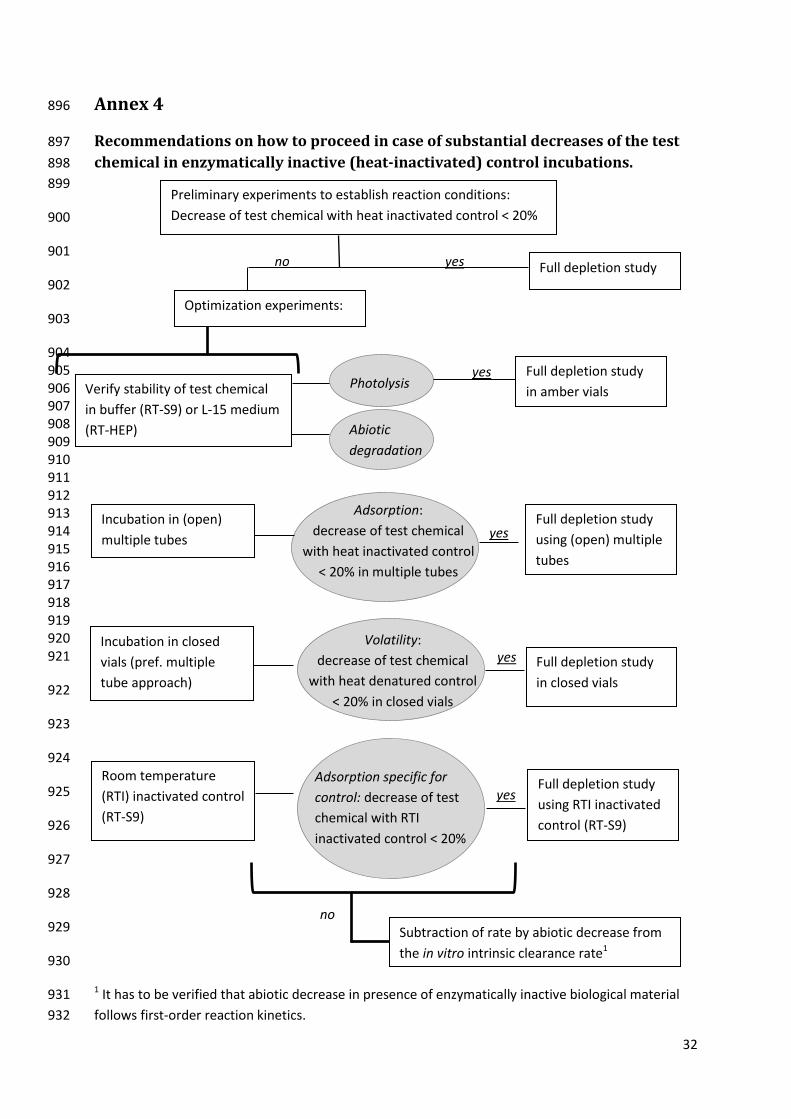
32
Annex 4 896
Recommendations on how to proceed in case of substantial decreases of the test 897
chemical in enzymatically inactive (heat-inactivated) control incubations. 898
899
900
901
902
903
904 905 906 907 908 909 910 911 912 913 914 915 916 917 918 919 920 921
922
923
924
925
926
927
928
929
930
1 It has to be verified that abiotic decrease in presence of enzymatically inactive biological material 931
follows first-order reaction kinetics. 932
no
yes
yes
yes
yes
Preliminary experiments to establish reaction conditions:
Decrease of test chemical with heat inactivated control < 20%
Full depletion study yes no
Incubation in (open)
multiple tubes
Optimization experiments:
Room temperature
(RTI) inactivated control
(RT-S9)
Verify stability of test chemical
in buffer (RT-S9) or L-15 medium
(RT-HEP)
Volatility:
decrease of test chemical
with heat denatured control
< 20% in closed vials
:
Full depletion study
using (open) multiple
tubes
Full depletion study
using RTI inactivated
control (RT-S9)
Full depletion study
in amber vials
Subtraction of rate by abiotic decrease from
the in vitro intrinsic clearance rate1
Photolysis
Adsorption:
decrease of test chemical
with heat inactivated control
< 20% in multiple tubes
:
Abiotic
degradation
Full depletion study
in closed vials
Incubation in closed
vials (pref. multiple
tube approach)
Adsorption specific for
control: decrease of test
chemical with RTI
inactivated control < 20%
: