Embed Size (px)
Citation preview
1
DR Mohammad HosseinSANEIDepartment of pathologyIsfahan university of medical science

2
• . Gross tumor may be identified by examination of the posterior and posterolateral horseshoe-shaped peripheral zone of the prostate looking for asymmetry in size, color, and density of tissue between right and left halves of the prostate

3
• In more than 85% of prostates, gross tumor will be identified
• Submission of the prostate in this manner will allow detection of more than 90% of positive margins, extraprostatic extension, and seminal vesicle invasion with, on average, a submission of only 12 to 13 cassettes (see later for description of lymph node examination

4
• FIGURE 45-3. Gross photograph of benign prostatic hyperplasia

5
• FIGURE 45-66. Gross appearance of adenocarcinoma of the prostate. Note more solid, homogeneous, gray–white appearance to carcinoma (left) as compared with contralateral benign prostate with a more spongy appearance.
adenocarcinoma

6
Gleason system

7
Gleason system
• is based on the glandular pattern of the tumor as identified at relatively low magnification
• cytologic features play no role in the grade of the tumor

8
• Both the primary (predominant) and the secondary (second most prevalent) architectural patterns are identified and assigned a grade from 1 to 5, with 1 being the most differentiated and 5 being undifferentiated
9
• Because both the primary and secondary patterns were considered influential in predicting prognosis, a combined Gleason grade resulted, obtained by the addition of the primary and secondary grades.
• If a tumor had only one histologic pattern, then for uniformity, the primary and secondary scores were given the same grade

10
• The combined Gleason grades range from 2 (1 + 1 = 2), which represents tumors uniformly composed of Gleason pattern 1 tumor, to 10 (5 + 5 = 10), which represents totally undifferentiated tumors

11
The advantages of the Gleason grading system are
• (a) it is easy to learn and apply because it is based on low-magnification pattern recognition
• and (b) it is less time consuming than the grading systems that examine cytologic features.

12
• Two older studies demonstrated good interobserver and intraobserver reproducibility with the Gleason system with agreements to within one combined Gleason grade of more than 80% and 90%, respectively
• However, more recent studies showed only moderate interobserver reproducibility among academic and private pathologists

13
• As shown on Gleason’s schematic diagram (Fig. 15), there is a continuum of differentiation between the various Gleason patterns such that the grade assigned at the extremes of a particular Gleason pattern may be somewhat subjective

14
• Another reason for grading discrepancies is the presence of more than two grades
• Gleason's system and most of the other grading systems were developed predominantly on needle biopsy and TUR specimens, in which it is uncommon for more than two grades to be represented.

15
• In prostatectomy specimens, however, tumors with multiple grades are not infrequent
• If more than two grades exist in Gleason's system, they should be commented on in a note.
• The Gleason grade on biopsy material has been shown to correlate fairly well with that of the subsequent radical prostatectomy

16
• Two large series comparing radical prostatectomy specimens and their diagnostic biopsies showed a correlation to within one combined Gleason grade in approximately 73% of the cases
• The tendency to undergrade needle-biopsy material results from the minimal amount of tumor in the needle biopsy and the consequent difficulty in appreciating either the infiltrative nature of the tumor or the variability in size and shape of the neoplastic glands, features that are characteristic of Gleason pattern 3

17
• An unavoidable cause of discrepant grading between the biopsy and subsequent prostatectomy specimen is that due to sampling error by the needle biopsy
• Because in TUR material there is greater sampling of the prostate and more tissue, the better to appreciate the overall architecture of the tumor, the grades assigned to TUR material tend to be more accurate than those given on needle-biopsy specimens.

18
• The major weakness of the Gleason grading system is that, although at both the low and high ends of the Gleason system we have fairly accurate predictive ability, the prognosis of the remaining patients is uncertain

19
The positive lymph node rate for various
Gleason scores is reported as follows:
• 2 to 4, less than 1%
• 5 to 6, 2% to 3%;
• 7, 10%;
• 8 to 10, 20%.

20
Extent of Cancer on Biopsy
• There are few data as to how the extent of cancer on needle biopsy should be recorded
• . Our own results show that only the
number of involved cores and bilaterality add to the prediction of pathologic stage, beyond that provided by biopsy grade and serum PSA values

21
Extent of Cancer on Biopsy
• Nevertheless, it is the convention to provide additional quantification when diagnosing cancer on needle biopsy
• We record the number of positive cores and the percentage positivity of each core

22

23
FIGURE 45-15. Gleason pattern 1 tumor composed of a circumscribed nodule of uniform, single, separate, closely
packed glands

24
.
FIGURE 45-16. In Gleason pattern 2, although the tumor is still fairly circumscribed, at the edge of the tumor nodule, there can be minimal extension by neoplastic glands into the surrounding nonneoplastic prostate. The glands in pattern 2 are still single and separate, yet they are more loosely arranged and not quite so uniform as in pattern 1.

25
FIGURE 45-17. Pattern 3 tumor infiltrates in and among the nonneoplastic prostate, with the glands having marked variation in size and shape. Many of the glands are smaller than those seen in pattern 1 or 2 tumors. Smoothly circumscribed cribriform nodules of tumor also are classified as pattern 3.

26
FIGURE 45-18. In Gleason pattern 4 tumor, the glands are no longer single and separate, as seen in patterns 1 through 3, and are composed of fused glands with ragged infiltrating edges. If one can mentally draw a circle around well-formed individual glands, then it is Gleason pattern 3.

27
.
FIGURE 45-19. The Gleason pattern 5 tumor shows no glandular differentiation with either solid masses of cells or individually infiltrating cells.

28
.
FIGURE 45-21. Adenocarcinoma of the prostate, Gleason grade 3 + 3 = 6 on needle biopsy. Note small glands infiltrating in and among larger benign glands.

29
FIGURE 45-22. Adenocarcinoma, Gleason grade 3 + 4 = 7. Note well-formed glands consistent with Gleason pattern 3 (lower right) compared with fused glands of Gleason pattern 4 (upper left).

30
FIGURE 45-24. Adenocarcinoma of the prostate, Gleason grade 3 + 3 = 6. Infiltrative appearance among benign glands is diagnostic of cancer.

31
• FIGURE 45-20. Gleason pattern 5 with central comedonecrosis.

32
Microscopic Diagnosis

33
• The types of difficulty encountered in diagnosing adenocarcinoma of the prostate depend on whether we are evaluating needle-biopsy material or TUR resection specimens
• . In needle-biopsy material, there exists the risk of overdiagnosing atrophic glands and seminal vesicles as carcinoma, as well as underdiagnosing adenocarcinoma because of the limited amount of tumor present.

34
• Atrophic glands stand out at scanning magnification because of their open lumina lined by cells with a high nuclear-to-cytoplasmic ratio, resulting in a very basophilic appearance to the glands

35
The most useful criteria to establish a
diagnosis of atrophic adenocarcinoma are • (a) an infiltrative pattern of growth, • (b) the presence of macronucleoli • (c) increased nuclear size • (d) the presence of adjacent, nonatrophic
cancer An important feature, which may not
necessarily be readily identifiable in atrophic glands, is the presence of a basal cell layer

36
• FIGURE 45-30. Atrophic adenocarcinoma of the prostate with very prominent nucleoli.

37
• FIGURE 45-31. Atrophic adenocarcinoma of the prostate (left) merging with more typical adenocarcinoma of the prostate (right).

38
• FIGURE 45-43. Needle biopsy showing glands with partial atrophy.
39
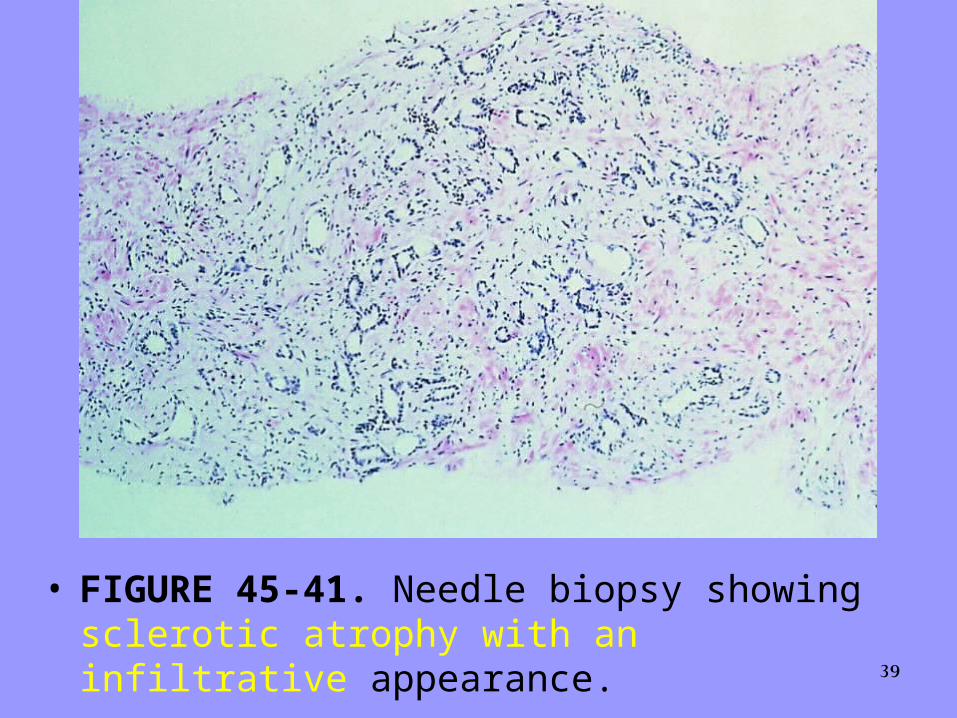
• FIGURE 45-41. Needle biopsy showing sclerotic atrophy with an infiltrative appearance.

40
The use of keratin antibodies specific for prostatic basal cells is helpful in identifying basal cells in atrophic glands
Another potential source of overdiagnosing prostatic adenocarcinoma is the presence of seminal vesicles or seminal vesicle–type epithelium on needle biopsy

41
• The presence of prominent lipofuscin granules within seminal vesicle epithelium is an important diagnostic aid
• Despite their marked enlargement and often bizarre shapes, these cells lack mitotic activity and commonly appear degenerated in nature, similar to what is seen with radiation atypia
42
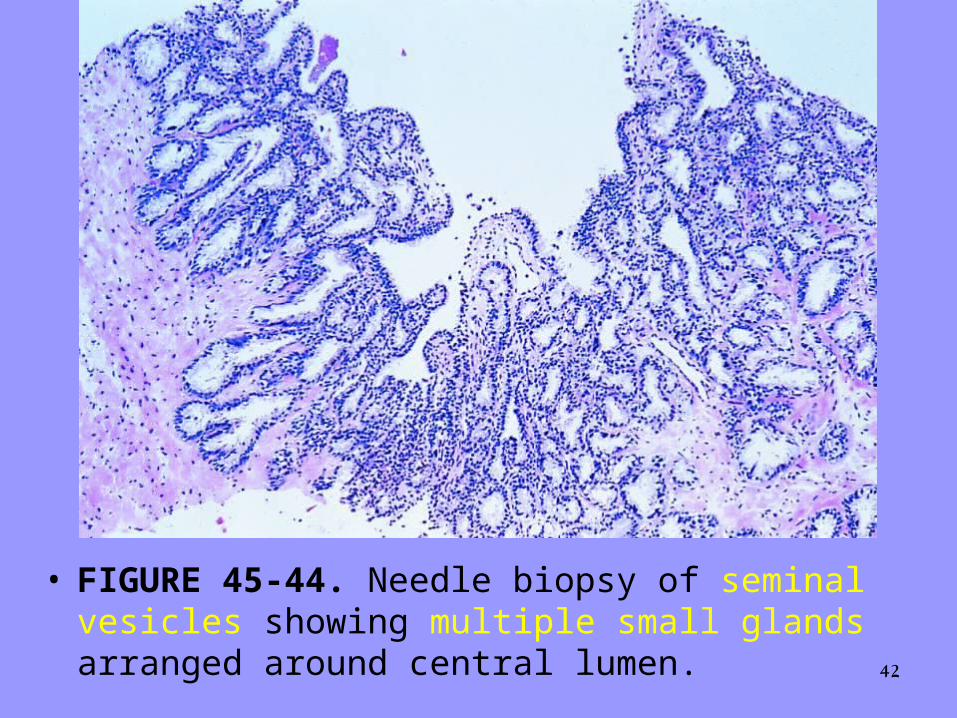
• FIGURE 45-44. Needle biopsy of seminal vesicles showing multiple small glands arranged around central lumen.

43
• FIGURE 45-45. Scattered markedly atypical nuclei with a degenerative appearance, characteristic of seminal vesicle epithelium. Prominent lipofuscin pigment noted.

44
• Seminal vesicle-type epithelium is also PSAP (not always PSA) negative and high-molecular-weight cytokeratin can distinguish between the two tissue types.
• A more common problem with the evaluation of needle-biopsy material from the prostate is not the overdiagnosis of carcinoma, but rather the underdiagnosis of carcinoma as a result of the limited amount of tumor present

45
underdiagnosis of carcinoma
• An unusual pattern of adenocarcinoma seen on needle biopsy that may be underdiagnosed involves cancers with voluminous xanthomatous cytoplasm in which nuclei are small and often show no or minimal atypia, termed foamy gland carcinoma; intraluminal pink homogeneous secretions are often present

46
underdiagnosis of carcinoma
• The identification of this type of cancer hinges on recognizing that the cytoplasm is unique to malignant glands, and the small, round nuclei are more uniformly hyperchromatic and round without a hint of a basal cell layer, as compared with normal glands.

47
• FIGURE 45-32. Adenocarcinoma of the prostate with abundant xanthomatous cytoplasm, small nuclei, and pink homogeneous intraluminal secretions. Compare cytoplasm with more typical adenocarcinoma (right).

48
• FIGURE 45-55. Xanthoma of the prostate.

49
recognition of prostatic cancer• The recognition of prostatic cancer in these
cases rests on both the architectural abnormalities resulting from the infiltrating neoplastic glands and the cytologic features of the neoplastic epithelium
• Although the finding of prominent nucleoli in the small glands is reassuring, it is not necessary to diagnose carcinoma. Often, only significant nuclear enlargement discriminates cancer from the surrounding benign glands
50
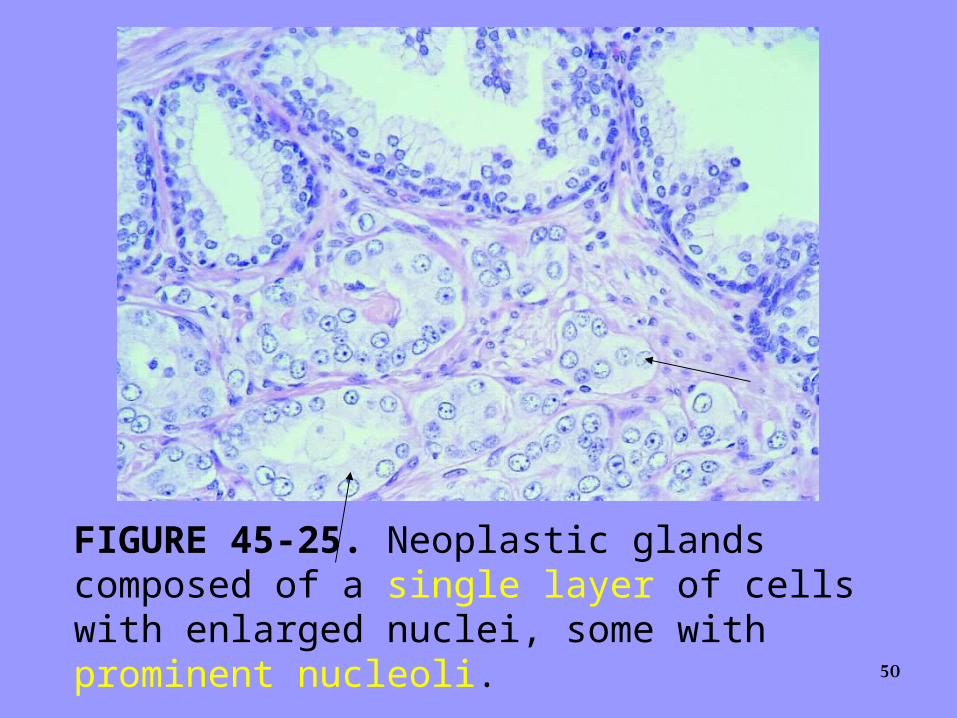
FIGURE 45-25. Neoplastic glands composed of a single layer of cells with enlarged nuclei, some with prominent nucleoli.

51
• FIGURE 45-34. Low-grade adenocarcinoma showing large back-to-back glands in which the luminal surfaces have an even straight edge without papillary infolding, and cells have abundant cytoplasm. Stains for 34be12 were negative in these glands

52
• FIGURE 45-33. Pseudohyperplastic adenocarcinoma where cancerous glands are relatively large and have papillary infolding architecturally resembling benign glands or high-grade prostatic intraepithelial neoplasia (PIN). The glands show prominent nucleoli, yet are too crowded to represent high-grade PIN. Stains for high molecular weight cytokeratin were also negative in the entire focus, in support of the diagnosis of cancer.

53
• ). Intraluminal pink acellular dense secretions or blue-tinged mucinous secretions seen in small suggestive glands may be additional features that help to differentiate malignant from benign glands, given their greater frequency in malignancy
• ). If the architectural or cytologic features or both are diagnostic of cancer, searching for a basal cell layer tends to confound rather than to help.

54
.
FIGURE 45-27. Adenocarcinoma of the prostate with blue-tinged mucinous secretions seen on hematoxylin and eosin–stained section.
55
.
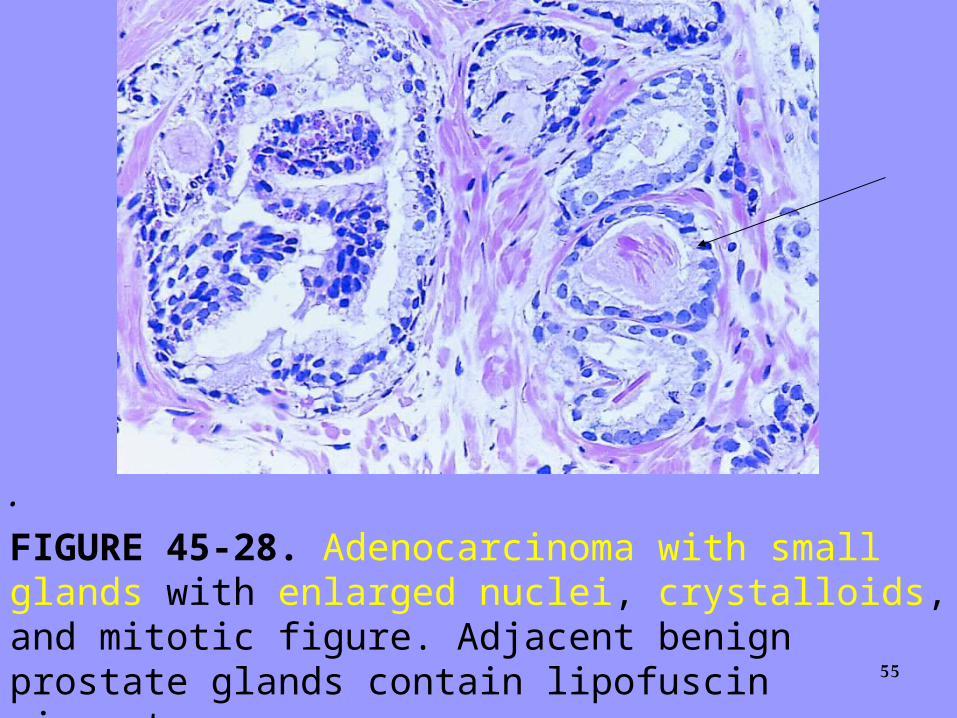
FIGURE 45-28. Adenocarcinoma with small glands with enlarged nuclei, crystalloids, and mitotic figure. Adjacent benign prostate glands contain lipofuscin pigment.

56
.
FIGURE 45-35. Adenocarcinoma of the prostate with perineural invasion. Occasionally glands with perineural invasion will show papillary infolding, mimicking a benign gland.
57
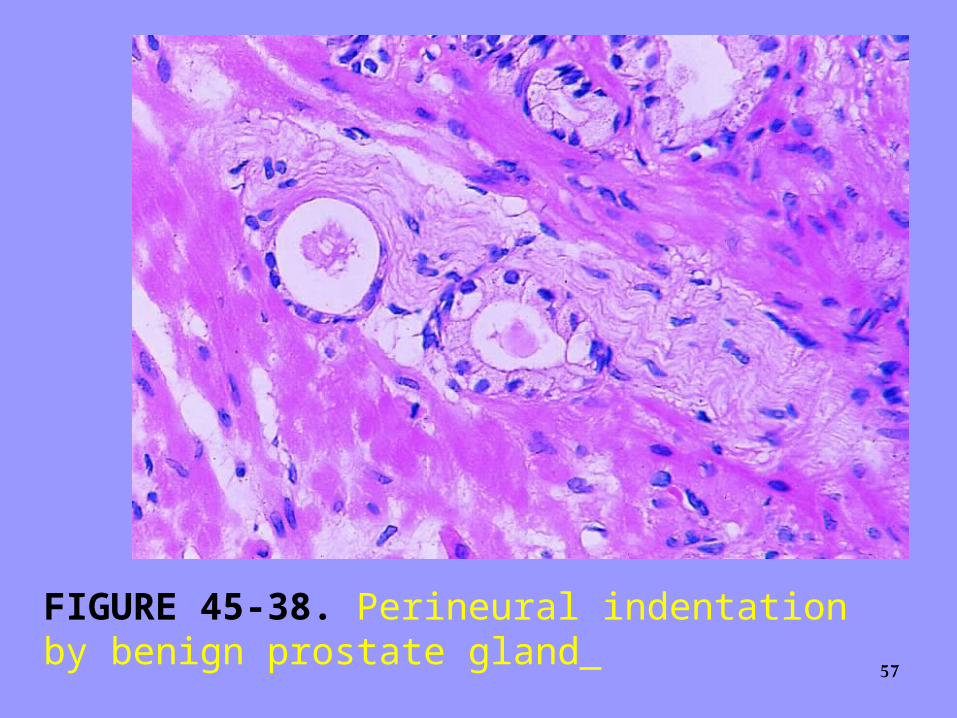
FIGURE 45-38. Perineural indentation by benign prostate gland

58
.
FIGURE 45-37. Glomerulations with adenocarcinoma showing cribriform formation that is not transluminal, resembling glomeruli.
59
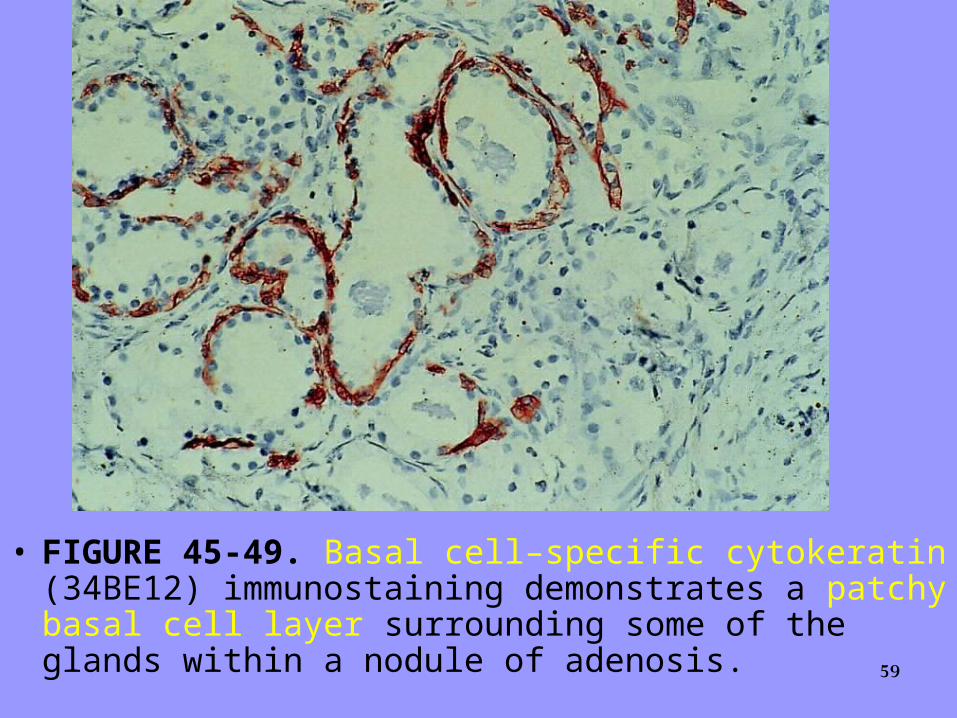
• FIGURE 45-49. Basal cell–specific cytokeratin (34BE12) immunostaining demonstrates a patchy basal cell layer surrounding some of the glands within a nodule of adenosis.

60
FIGURE 45-49. Basal cell–specific cytokeratin (34BE12) immunostaining demonstrates no basal cell in small gland consist with adenocarcinom.

61
• Also, basal cells in benign glands tend to stain uniformly and intensely, in contrast to the patchy staining in adenosis
• Adenosis tends to be located centrally within the gland, such that it is most commonly seen in TUR resection specimens

62
• In TUR resection specimens, we usually have an entire nodule of adenosis to evaluate; it would be highly unlikely for the entire focus to show no immunoreactivity with basal cell–specific cytokeratin
• . Consequently, the lack of basal cell–specific cytokeratin staining in a nodule of glands in which we are deciding between adenosis and low-grade adenocarcinoma is highly supportive of the diagnosis of adenocarcinoma
63
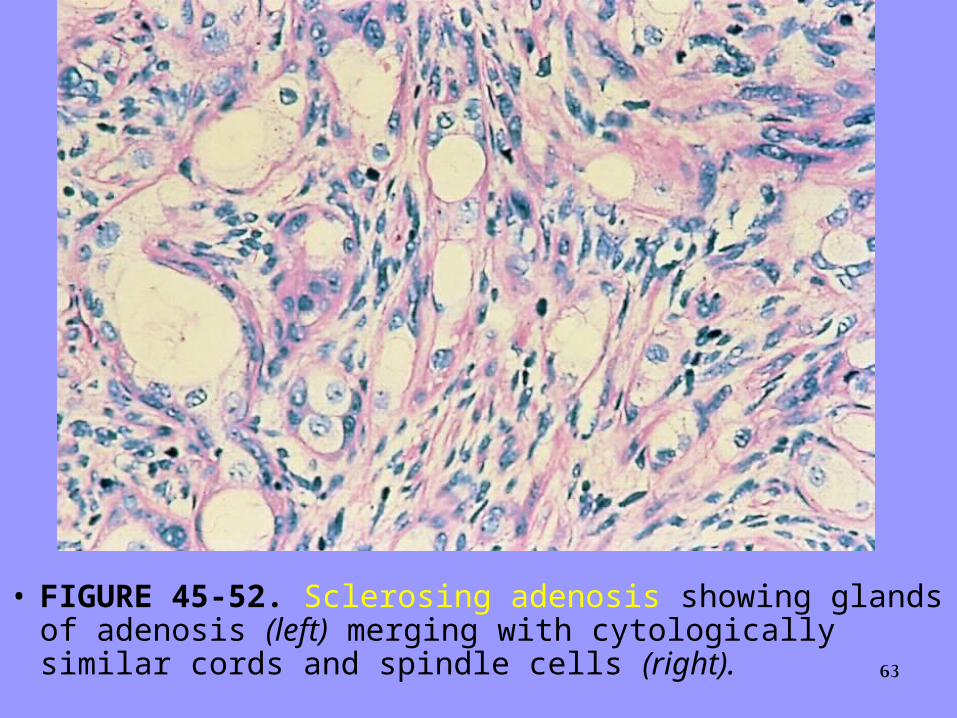
• FIGURE 45-52. Sclerosing adenosis showing glands of adenosis (left) merging with cytologically similar cords and spindle cells (right).

64
• FIGURE 45-94. Basal cell hyperplasia characterized by glandular structures with multiple cell layers.

65
• FIGURE 45-95. Basal cell hyperplasia with prominent nucleoli and mitotic figures.

66
• Table 2. Helpful features in the needle-biopsy diagnosis of adenocarcinoma on H&E-stained sections
• • Features diagnostic of adenocarcinoma• Perineural invasion• Mucinous fibroplasia (collagenous micronodules)• Glomerulations• Features favoring the diagnosis of cancer• (diagnosis based on a constellation of features)• Architecture• Small glands in between larger benign glands• Crowded glands that stand out from adjacent benign glands• Cytology• Prominent nucleoli• Nuclear enlargement• Hyperchromatic nuclei• Amphophilic cytoplasm• Mitotic figures• Luminal contents• Blue mucinous secretions• Pink amorphous secretions• Crystalloids in small infiltrating glands (i.e., not adenosis)• Adjacent findings• High grade PIN either away from small atypical glands or • in presence of numerous small atypical glands, such that• tangential sectioning or outpouching off of PIN not possible• • PIN, prostatic intraepithelial neoplasia.

PROSTATIC INTRAEPITHELIAL NEOPLASIA as
68
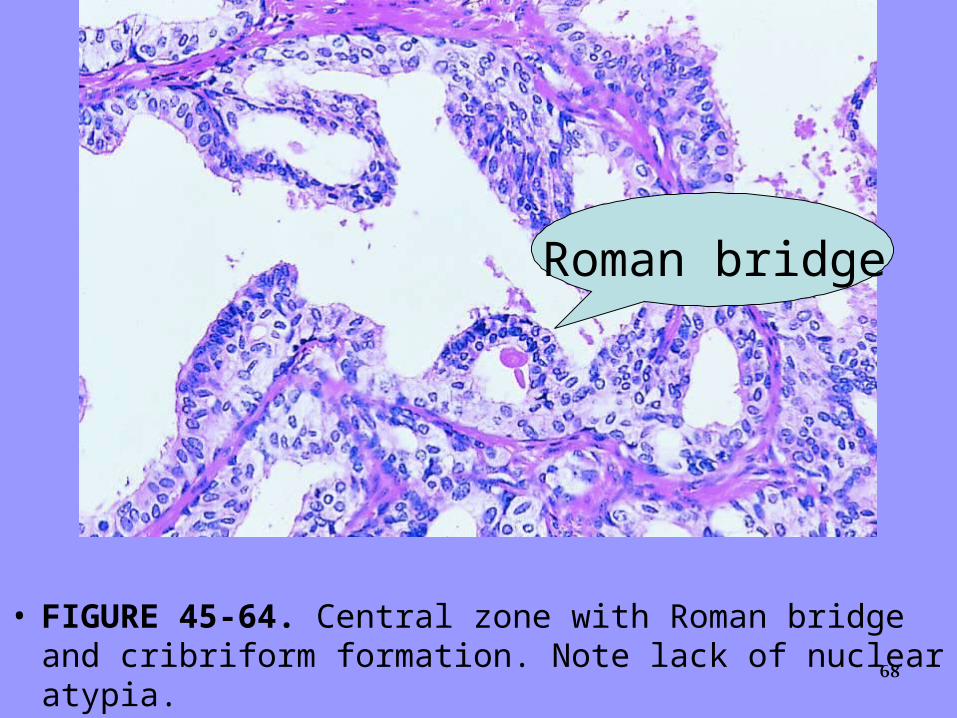
• FIGURE 45-64. Central zone with Roman bridge and cribriform formation. Note lack of nuclear atypia.
Roman bridge

69
FIGURE 45-56. Low-grade prostatic intraepithelial neoplasia with slight enlargement of nuclei and stratification, yet no prominent nucleoli.
70
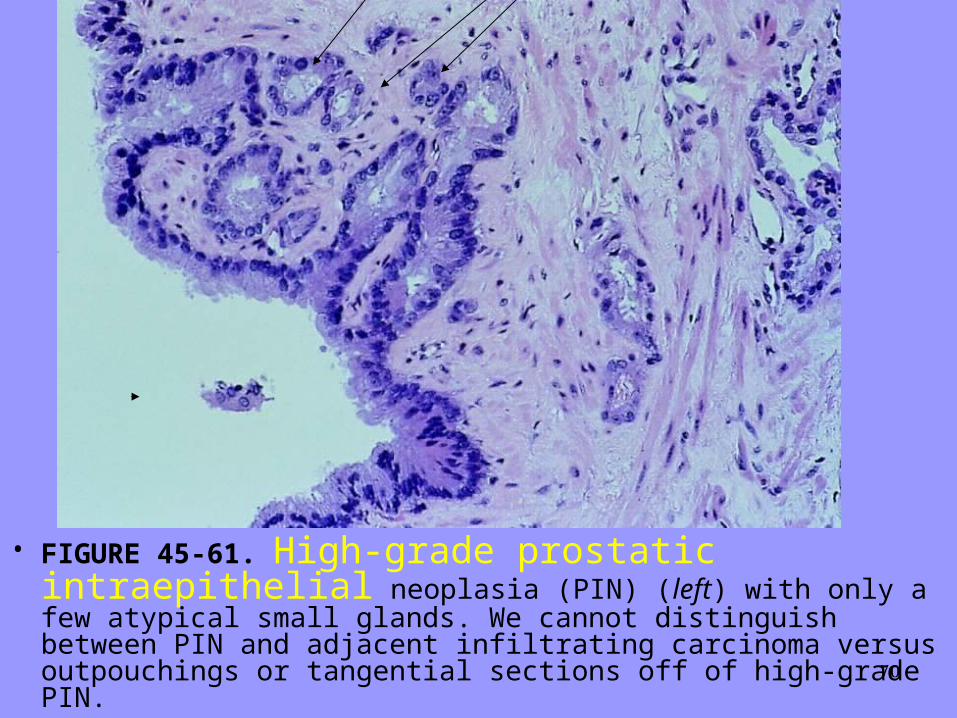
• FIGURE 45-61. High-grade prostatic intraepithelial neoplasia (PIN) (left) with only a few atypical small glands. We cannot distinguish between PIN and adjacent infiltrating carcinoma versus outpouchings or tangential sections off of high-grade PIN.

71
FIGURE 45-57. Low magnification of high-grade prostatic intraepithelial neoplasia, showing glands with a normal architectural pattern yet a basophilic appearance.

72
.
FIGURE 45-58. Basophilia of gland with high-grade prostatic intraepithelial neoplasia (PIN) owing to nuclear stratification and high nuclear-to-cytoplasmic ratio with large nuclei and prominent nucleoli. Note in left portion of field within a single gland, the abrupt transition between benign-appearing nuclei and PIN nuclei.

73
FIGURE 45-59. Prominent tall papillary tufts within high-grade prostatic intraepithelial neoplasia (PIN). Nuclei appear more benign toward the luminal surface of the papillary projections. Note large nuclei with frequent nucleoli, diagnostic of high-grade PIN, toward the edge of the gland up against the basement membrane.

74
FIGURE 45-60. High-grade prostatic intraepithelial neoplasia with cribriform pattern.
75
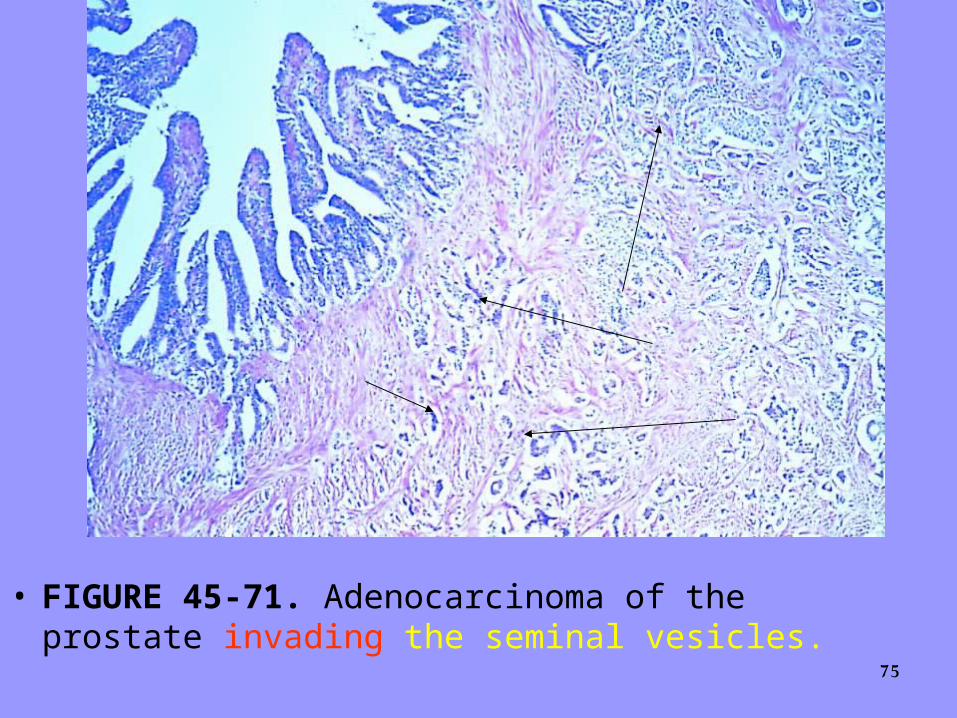
• FIGURE 45-71. Adenocarcinoma of the prostate invading the seminal vesicles.

76
• FIGURE 45-80. Adenocarcinoma after hormone therapy, showing tumor cells with pyknotic nuclei and foamy cytoplasm resembling histiocytes.

77• FIGURE 45-81. Benign prostate glands showing
radiation effect.

78
• FIGURE 45-82. Mucinous adenocarcinoma of the prostate with glands of adenocarcinoma floating within mucin.
79
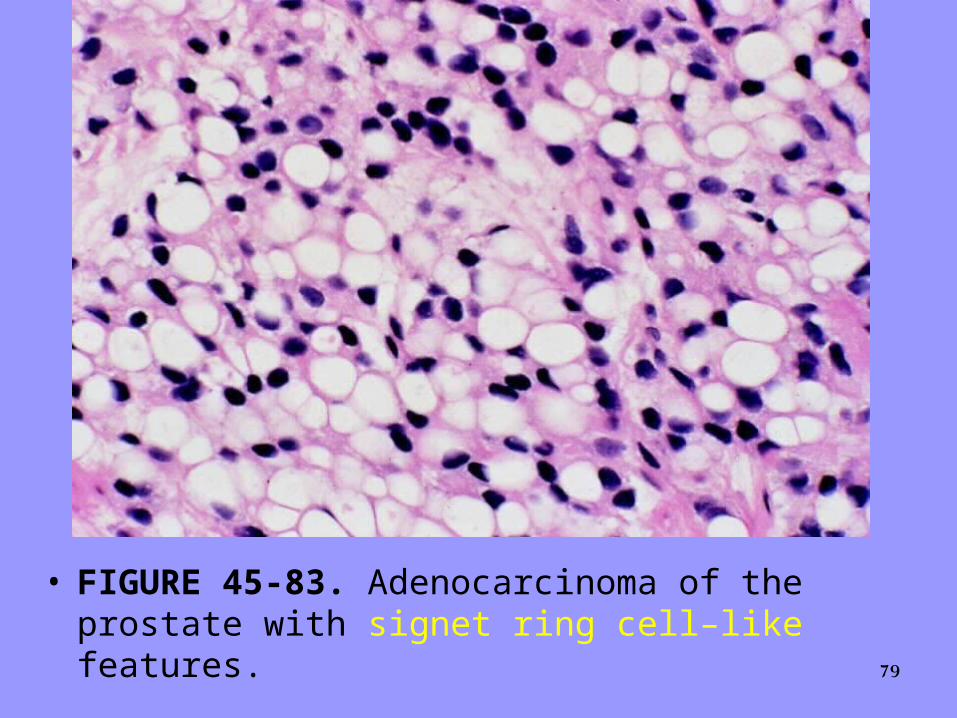
• FIGURE 45-83. Adenocarcinoma of the prostate with signet ring cell–like features.

80
• FIGURE 45-84. Adenocarcinoma of the prostate with fine, eosinophilic cytoplasmic granules corresponding to neuroendocrine differentiation. Immunostaining revealed strong positivity with human chorionic gonadotropin.

81
• FIGURE 45-85. Small cell carcinoma of the prostate admixed with ordinary adenocarcinoma of the prostate (right).

82
• FIGURE 45-86. Papillary prostatic duct adenocarcinoma showing tall pseudostratified columnar epithelium with dark cytoplasm.

83
• FIGURE 45-87. Cribriform pattern of prostatic duct adenocarcinoma.

84
• FIGURE 45-88. Adenosquamous carcinoma.

85
• FIGURE 45-89. Infiltrating transitional cell carcinoma in the prostate. Cells are more pleomorphic than is poorly differentiated prostate adenocarcinoma.
86
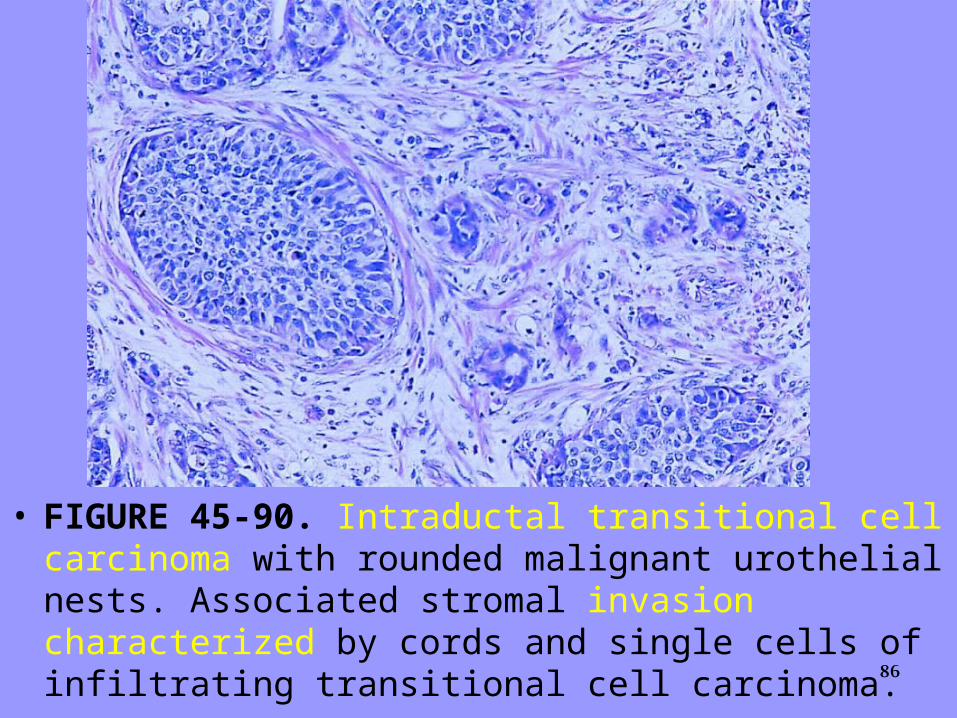
• FIGURE 45-90. Intraductal transitional cell carcinoma with rounded malignant urothelial nests. Associated stromal invasion characterized by cords and single cells of infiltrating transitional cell carcinoma.

87
• FIGURE 45-91. Stromal sarcoma of the prostate.

88
• FIGURE 45-92. Stromal proliferation of uncertain malignant potential with appearance of benign phyllodes tumor.
89
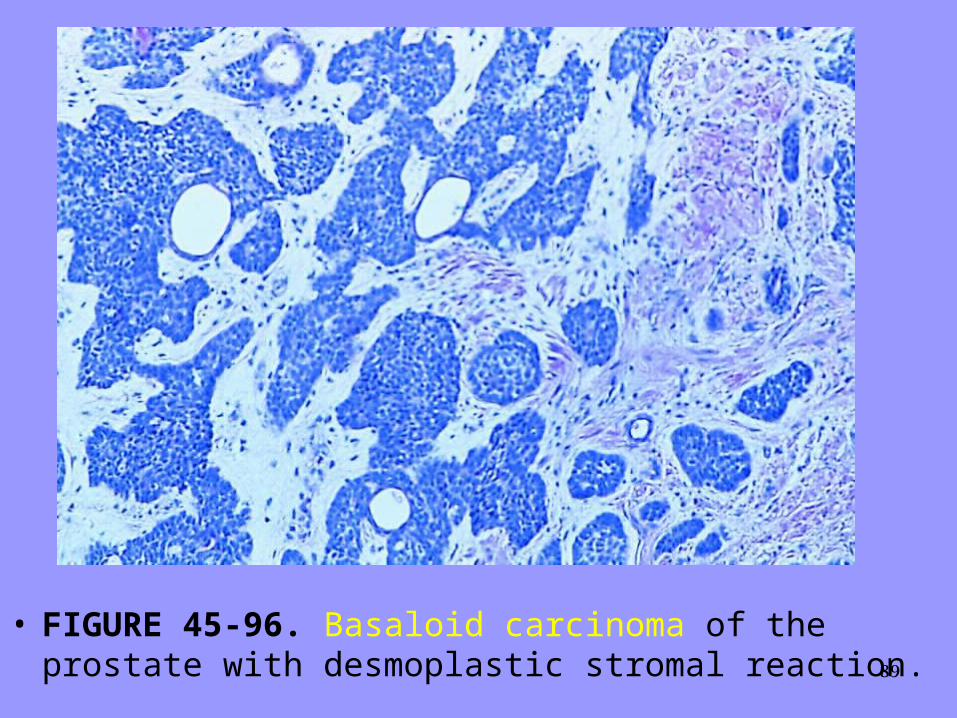
• FIGURE 45-96. Basaloid carcinoma of the prostate with desmoplastic stromal reaction.