Embed Size (px)
Citation preview

1
DNA microarrays for gene
expression profiling
Alberto Bernacchia
Dipartimento di Fisica E.Fermi, Università di Roma “La Sapienza”

2
Motivations
We know entire DNA sequences (genomes) of different organisms.
How are the genes expressed in different conditions?
DNA microarrays may answer
this question

3
DNA microarray manufacture
On each slide (few centimeters large), ≈105 spots are deposited (≈1m).
On each spot, a single gene is chemically bounded to the surface.
The entire genome in one slide
few hundred dollars each

4
An experiment
Referencesample
Test sample
RNA extraction
cDNA synthesis (RT) and amplification
cRNA synthesis and labeling Cy5Cy3
Hybridization
DNA / RNA Laser Scanning
(healthy)(diseased)

5
Example of scanned slide

6
Example of scanned slide

7
Alzheimer’s disease

8
European Brain Research Institute (EBRI)Istituto di Analisi dei Sistemi ed Informatica (IASI)
AD11 transgenic mices exepress the Alzheimer’s cellular phenotype
Alzheimer’s desease

9
Three brain areas: cerebral cortex, hippocampus, basal forebrain.
15 months6 months3 months
1 month
Experimental settingFour ages
Total 4x3x2=24 conditions
Two mices: anti-NGF AD11 (diseased), VHD11 (healthy)

10
Reproducibility of arrays
Two conditions
healthydiseased
More conditions
diseasedhealthy
reference (wild)healthy, hyppocampus, 1 month
reference (wild)diseased, cerebral cortex, 3 months
reference (wild)healthy, basal forebrain, 6 month
reference (wild)diseased, hyppocampus, 15 months
24 conditions x 5 = 120 microarrays

11
Example of scanned slide

12

13
X
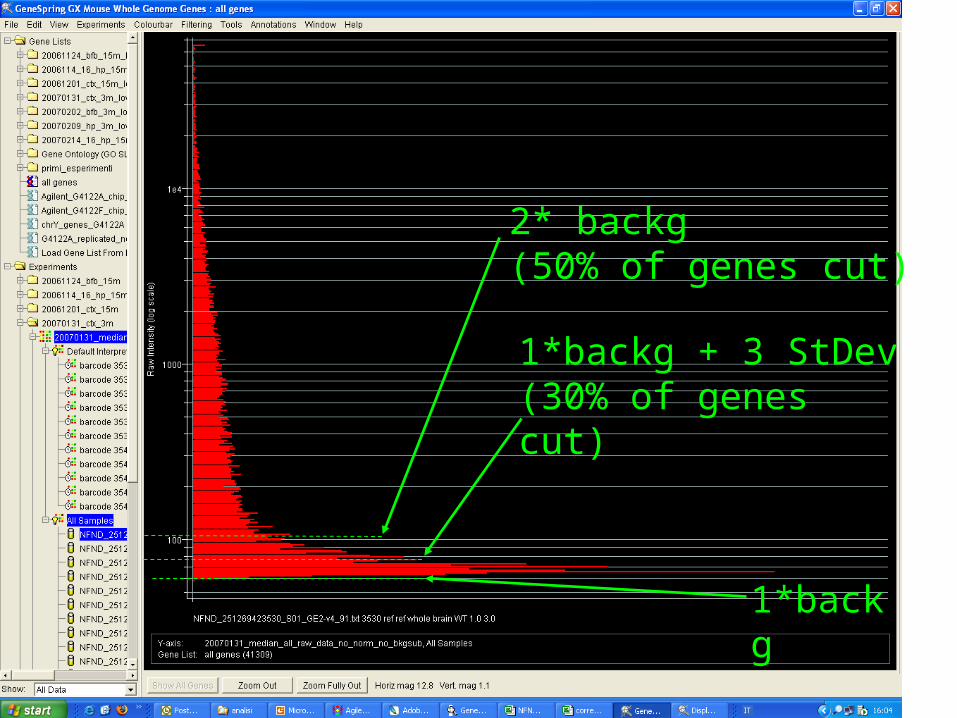
14
1*backg
2* backg (50% of genes cut)
1*backg + 3 StDev(30% of genes cut)

15
Log2(Red/Green)
Intensity =Red x Green
Lowess (Locally Weighted Linear Regression): data shift based on non-linear fitting
Lowess normalization
Intensity =Red x Green
Log2(Red/Green)

16
Clustering samples
A distinction between two subtypes of cancer was discovered by clustering
genes
samples
clustering of samples
(columns)

17
Clustering genes
temporal response of human fibroblast to serum
wound repair
genes
clustering of genes (rows)