Embed Size (px)
Citation preview

1
DNA Methylation DNA Methylation and Cancerand CancerShen-Chih Chang, M.S.Shen-Chih Chang, M.S.
Epi 243Epi 243May 15, 2008May 15, 2008

2
Presentation OutlinePresentation Outline
Epigenetics and DNA methylationEpigenetics and DNA methylation DNA methylation and CancerDNA methylation and Cancer Techniques of measuring DNA methylTechniques of measuring DNA methyl
ationation Methylation-Specific PCR (MSP)Methylation-Specific PCR (MSP) Taqman real-time Methylation AssayTaqman real-time Methylation Assay

3
What is Epigenetic?What is Epigenetic? Classic genetics alone cannot explain the diversity of Classic genetics alone cannot explain the diversity of
phenotypes within a population.phenotypes within a population. Monozygotic twins or cloned animals with identical Monozygotic twins or cloned animals with identical
DNA sequences can have different phenotypes and sDNA sequences can have different phenotypes and susceptibilities to disease.usceptibilities to disease.
EpigeneticEpigenetic provides additional instructions on how, provides additional instructions on how, where, and when the genetic information should be where, and when the genetic information should be used. used.
It is defined as “The changes in gene expression thaIt is defined as “The changes in gene expression that are not due to any alteration in the DNA sequence”.t are not due to any alteration in the DNA sequence”.
Common mechanisms includes (but not limited to)Common mechanisms includes (but not limited to) DNA methylationDNA methylation Chromatin structure modulationChromatin structure modulation X-chromosome inactivation (embryonic development) X-chromosome inactivation (embryonic development)

4
DNA MethylationDNA Methylation
DNA methylation is a type of chemical modification DNA methylation is a type of chemical modification of DNA which involves the addition of a methyl grouof DNA which involves the addition of a methyl group to the number 5 carbon of the cytosine, to convert p to the number 5 carbon of the cytosine, to convert cytosine to 5-methylcytosine.cytosine to 5-methylcytosine.
The most well characterized epigenetic mechanism.The most well characterized epigenetic mechanism. In humans, DNA methylation occurs in cytosines thIn humans, DNA methylation occurs in cytosines th
at precede guanines (dinucleotide CpGs) (The CpG nat precede guanines (dinucleotide CpGs) (The CpG notation is used to distinguish a cytosine followed by otation is used to distinguish a cytosine followed by guanine from a cytosine base paired to a guanine). guanine from a cytosine base paired to a guanine).

5
CpG Sites and CpG islandsCpG Sites and CpG islands CpG sites are not randomly distributed in the genome - thCpG sites are not randomly distributed in the genome - th
e frequency of CpG sites in human genomes is 1%, which e frequency of CpG sites in human genomes is 1%, which is less than the expected (~4-6%). is less than the expected (~4-6%).
Around 60-90% of CpGs are methylated in mammals. DNAround 60-90% of CpGs are methylated in mammals. DNA methylation frequently occurs in repeated sequences, aA methylation frequently occurs in repeated sequences, and may help to suppress junk DNA and prevent chromosnd may help to suppress junk DNA and prevent chromosomal instability. omal instability.
There are regions of the DNA that have a higher concentrThere are regions of the DNA that have a higher concentration of CpG sites (> 60%), named the CpG islands, which ation of CpG sites (> 60%), named the CpG islands, which tend to be located in the promoter regions of many genes.tend to be located in the promoter regions of many genes.
The CpG islands are usually not methylated.The CpG islands are usually not methylated.

6
Function of DNA Function of DNA MethylationMethylation
In humans, DNA is methylated by three enzymes, DNA In humans, DNA is methylated by three enzymes, DNA methyltransferase 1, 3a, and 3b (DNMT1, DNMT3a, DNmethyltransferase 1, 3a, and 3b (DNMT1, DNMT3a, DNMT3b).MT3b).
DNMT3a and 3b are the DNMT3a and 3b are the de novode novo methyltransferases th methyltransferases that set up DNA methylation patterns early in developmeat set up DNA methylation patterns early in development. nt.
DNMT1 is the maintenance methyltransferase that is rDNMT1 is the maintenance methyltransferase that is responsible for copying DNA methylation patterns to thesponsible for copying DNA methylation patterns to the daughter strands during DNA replication. e daughter strands during DNA replication.
DNA methylation is important in:DNA methylation is important in: Transcriptional gene silencingTranscriptional gene silencing Maintain genome stabilityMaintain genome stability Embryonic developmentEmbryonic development Genomic imprintingGenomic imprinting X chromosome inactivation (females)X chromosome inactivation (females)
7
DNA Methylation and DNA Methylation and CancerCancer
Hypomethylation – decrease methylation levelsHypomethylation – decrease methylation levels A lower level of DNA methylation in tumors as compA lower level of DNA methylation in tumors as comp
ared to their normal-tissue counterparts was one of tared to their normal-tissue counterparts was one of the first epigenetic alterations to be found in human che first epigenetic alterations to be found in human cancer. (Feinberg AP, et al., 1983). ancer. (Feinberg AP, et al., 1983).
Global hypomethylation of DNA sequences that are nGlobal hypomethylation of DNA sequences that are normally heavily methylated may result inormally heavily methylated may result in
Chromosomal instability Chromosomal instability Increased transcription from transposable elements Increased transcription from transposable elements An elevated mutation rate due to mitotic recombinationAn elevated mutation rate due to mitotic recombination
Promoter region CpG islands demethylation of proto-Promoter region CpG islands demethylation of proto-oncogenes will activate the repressed gene expressiooncogenes will activate the repressed gene expressionn

8
DNA Methylation and DNA Methylation and CancerCancer
Hypermethylation – increase methylation levelsHypermethylation – increase methylation levels Hypermethylation of the CpG islands in the promoter Hypermethylation of the CpG islands in the promoter
regions of tumor-suppressor genes is a major event iregions of tumor-suppressor genes is a major event in the origin of many cancers.n the origin of many cancers.
Hypermethylation of the CpG island promoter can inHypermethylation of the CpG island promoter can inactivate tumor-suppressor genes, affect genes involveactivate tumor-suppressor genes, affect genes involved in the cell cycle, DNA repair, and the metabolism of d in the cell cycle, DNA repair, and the metabolism of carcinogens, all of which are involved in the developcarcinogens, all of which are involved in the development of cancer. ment of cancer.
The profiles of hypermethylation of the CpG islands iThe profiles of hypermethylation of the CpG islands in tumor-suppressor genes are specific to the cancer tn tumor-suppressor genes are specific to the cancer type.ype.

9Baylin et al. 2001; Jones et al. 2002

10Laird PW, 1997

11
Esteller M 2008

12
Factors associated with Factors associated with DNA MethylationDNA Methylation
AgingAging Nutrient intakeNutrient intake GeneticGenetic Metal exposureMetal exposure Tobacco SmokingTobacco Smoking Alcohol DrinkingAlcohol Drinking

13
Application of DNA Application of DNA MethylationMethylation
Early diagnosis –Early diagnosis – Detection of CpG-island hypermethylation in Detection of CpG-island hypermethylation in
biological fluids and serumbiological fluids and serum Prognosis –Prognosis –
Hypemethylation of specific genesHypemethylation of specific genes Whole DNA methylation profilesWhole DNA methylation profiles
Prediction –Prediction – CpG island hypermethylation as a marker of CpG island hypermethylation as a marker of
response to chemotherapyresponse to chemotherapy Prevention –Prevention –
Developing DNMTs inhibitors as Developing DNMTs inhibitors as chemopreventive drugs to reactive silenced chemopreventive drugs to reactive silenced genes genes

14
Techniques of Measuring GenTechniques of Measuring Gene-Specific Hypermethylatione-Specific Hypermethylation
•Methylation Specific PCR (MSP)Methylation Specific PCR (MSP)Taqman Real-Time Methylation AssayTaqman Real-Time Methylation Assay

15
Projects of measuring gene-specifiProjects of measuring gene-specific c
DNA hypermethylationDNA hypermethylation Examining Examining promoter hypermethylation status of P16Ipromoter hypermethylation status of P16I
NK4a, MGMT, and GSTP1 in buccal call extracted DNNK4a, MGMT, and GSTP1 in buccal call extracted DNA samples in a population-based case-control study oA samples in a population-based case-control study on lung and head and neck cancer from Los Angeles Cn lung and head and neck cancer from Los Angeles County.ounty.
Examining promoter hypermethylation status of geneExamining promoter hypermethylation status of genes involved in bladder tumorigenesis (including P16INs involved in bladder tumorigenesis (including P16INK4a, P14ARF, APC, CDH1, RASSF1A, MGMT, and GSTK4a, P14ARF, APC, CDH1, RASSF1A, MGMT, and GSTP1) in WBC, NBC, CIS, and, cancer tissues from 73 blaP1) in WBC, NBC, CIS, and, cancer tissues from 73 bladder cancer patients.dder cancer patients.
Examining promoter hypermethylation status of seveExamining promoter hypermethylation status of several genes (ral genes (P16INK4a, P14ARF, APC, CDH1, RASSF1A) P16INK4a, P14ARF, APC, CDH1, RASSF1A) and their associations with dietary factors and genes iand their associations with dietary factors and genes involved in the one-carbon metabolic pathway in a ponvolved in the one-carbon metabolic pathway in a population-based case-control study on esophageal, stopulation-based case-control study on esophageal, stomach, and liver cancer in a Chinese population.mach, and liver cancer in a Chinese population.
16
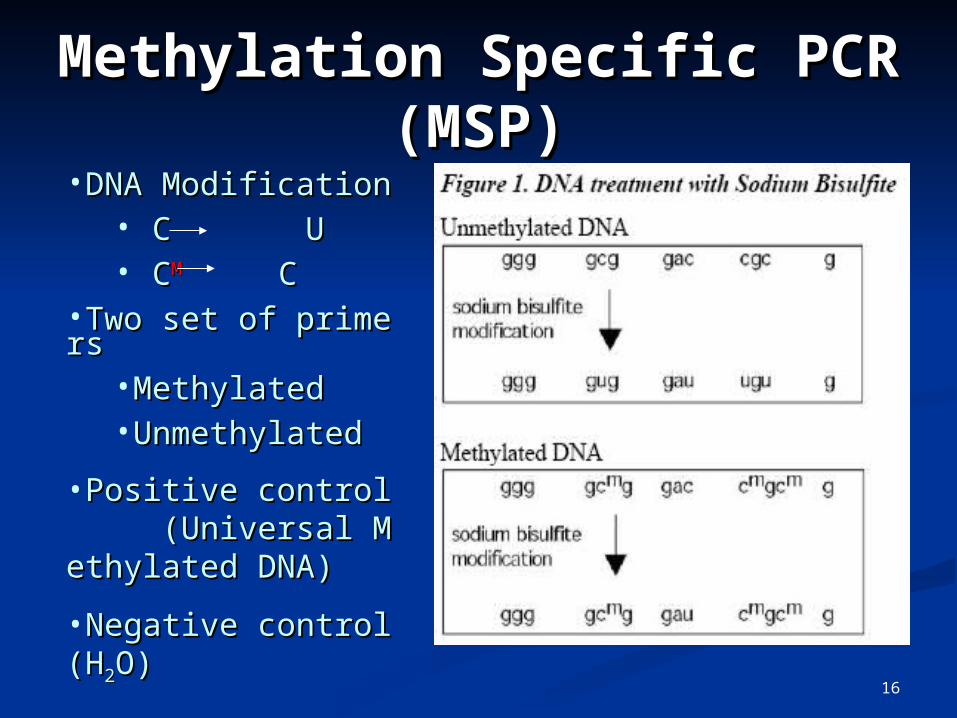
Methylation Specific PCR Methylation Specific PCR (MSP)(MSP)
•DNA ModificationDNA Modification• C UC U• CCMM C C
•Two set of primersTwo set of primers•MethylatedMethylated•UnmethylatedUnmethylated
•Positive control Positive control (Universal Methylate(Universal Methylated DNA)d DNA)•Negative control (HNegative control (H22O)O)

17
Results from the MSPResults from the MSP•p1p1
66
•MGMTMGMT •GSTP1GSTP1

18
Taqman Taqman Real-Time PCR TechnologiesReal-Time PCR Technologies
Taqman is a fluorescent based PCR technique which intTaqman is a fluorescent based PCR technique which integrates traditional PCR-based assays with laser scanninegrates traditional PCR-based assays with laser scanning technology to detect fluorescent PCR-related chemistrg technology to detect fluorescent PCR-related chemistries.ies.
Besides primers, Taqman technology acquires a fluoresBesides primers, Taqman technology acquires a fluoresent probe that contains a reporter dye at the 5´ end and ent probe that contains a reporter dye at the 5´ end and a quencher dye at the 3´ end of the probe.a quencher dye at the 3´ end of the probe.
During the reaction, cleavage of the probe separates the During the reaction, cleavage of the probe separates the reporter dye and the quencher dye, which results in increporter dye and the quencher dye, which results in increased fluorescence of the reporter. reased fluorescence of the reporter.
Accumulation of PCR products is detected directly by mAccumulation of PCR products is detected directly by monitoring the increase in fluorescence of the reporter donitoring the increase in fluorescence of the reporter dye.ye.

19
Probe-Based Assay ChemistryProbe-Based Assay Chemistry

20
Animation of fluorogenic 5' nuclease aAnimation of fluorogenic 5' nuclease assayssay
21

22
Taqman Methylation AssayTaqman Methylation Assay Sodium bisulfate treat DNASodium bisulfate treat DNA Real-Time PCR runsReal-Time PCR runs
Absolute quantificationAbsolute quantification Relative quantificationRelative quantification
Analyze data with SDS and RQ Analyze data with SDS and RQ manager softwaremanager software

23
Real-Time PCRReal-Time PCR Real-time PCR is a PCR-based method
using fluorescent molecules to directly measure the reaction while amplification is taking place.
Data are collected throughout the PCR process rather than the end of the process.
It measures the point in time when amplification of a target is first detected during cycling rather than by the amount of target accumulated at the end of PCR.
Can be used to achieve both qualitative and quantitative measurements.

24
DenaturationPrimer Annealing
Elongation
5’ 3’
5’3’5’ 3’
5’3’
5’ 3’
5’3’5’
5’
Taq
Taq
Repeat
Traditional Standard Traditional Standard PCRPCR
In theory, product accumulation is proportional to 2n, where n is the number of amplification cycle repeats

25
However, in reality...However, in reality...

26
• A linear increase follows exponential
•
Eventually plateaus
Cycle #
Theoretical
Real Life
Log
Targ
et
DN
A
Limitation in standard PCRLimitation in standard PCR
Amplification is exponential, but the Amplification is exponential, but the exponential increase is limited:exponential increase is limited:
Geometric
linear
plateau
27
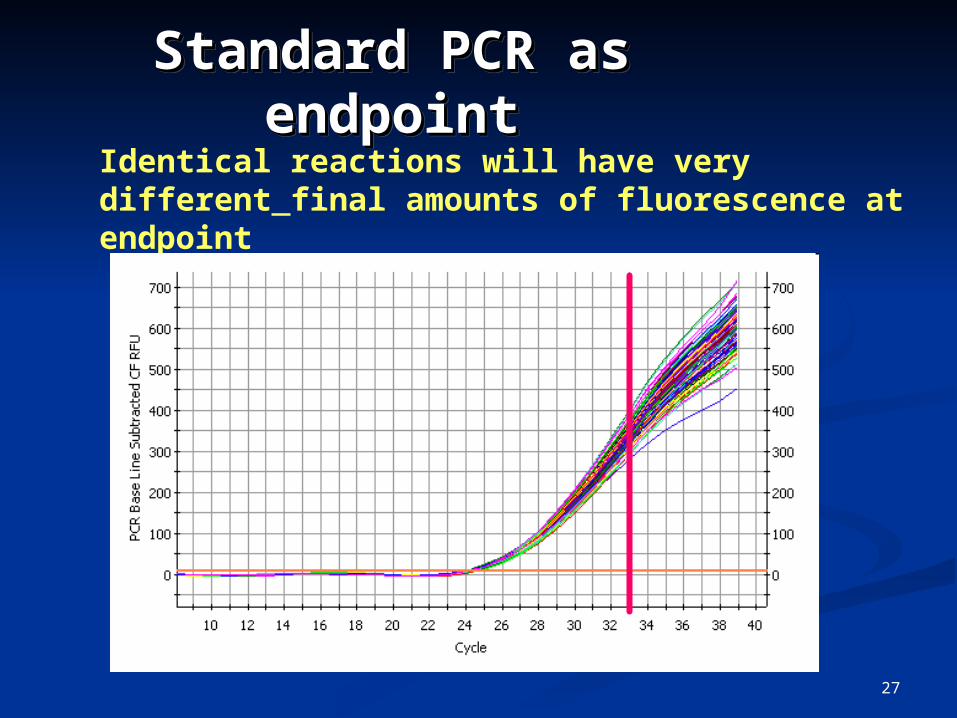
Standard PCR as Standard PCR as endpointendpoint
Standard PCR as Standard PCR as endpointendpoint
Identical reactions will have very different final amounts of fluorescence at endpoint

28
Cycle #
Theoretical Real LifeLo
g T
arg
et
DN
A
Detector
Data Collection in Real-Time Data Collection in Real-Time PCRPCR
Data Collection in Real-Time Data Collection in Real-Time PCRPCR

29
•The point at which the fluorescence rises appreciably above threshold is called CT
•Identical reactions will have identical CT values
Real-Tim PCRReal-Tim PCR
CT
Threshold

30
How to measure DNA How to measure DNA concentration?concentration?

31
How to measure DNA How to measure DNA concentration?concentration?

32
How to measure DNA How to measure DNA concentration?concentration?

33
Absolute quantificationAbsolute quantification--Standard Curve Method----Standard Curve Method--

34
Setup for Absolute QuantificatiSetup for Absolute Quantification for Methylation Assayon for Methylation Assay
Modified DNA as templatesModified DNA as templates Serial dilutions of standardsSerial dilutions of standards Methylation specific sequence forward and backwaMethylation specific sequence forward and backwa
rd primersrd primers Taqman Probes: 5’-FAM---------TEMRA-3’Taqman Probes: 5’-FAM---------TEMRA-3’ Taqman Universal PCR Master MixTaqman Universal PCR Master Mix Negative control contains PCR reagents but without Negative control contains PCR reagents but without
DNA – ddHDNA – ddH22OO Replicate wells -- using three or more replicate reacReplicate wells -- using three or more replicate reac
tions per sample to ensure statistical significance.tions per sample to ensure statistical significance.

35
Setup for Absolute Setup for Absolute QuantificationQuantification
Gene I
Gene II

36
Setup for Absolute Setup for Absolute QuantificationQuantification
Each well is assigned with a marker and a task: U (unknown), S (standard), or N (no templatecontrol). The quantity of each standard is also assigned.

37
Setup for Absolute Setup for Absolute QuantificationQuantification
Times and Temperatures for RT-PCR
Initial Step PCR (Each of 40 cycles)
AmpliTaq Gold DNA Polymerase Avtivation
Melt Anneal/Extend
HOLD CYCLE
10 mins at 95℃ 15 sec at 95℃ 1 min at 60℃

38
Analyzing Absolute Analyzing Absolute Quantification DataQuantification Data
Automatic CT or manual CT: the threshold is set in the exponential phase of the amplification curve.
Automatic baseline or manual baseline: the amplification curve begins after the maximum baseline.

39
The software displays the standard curve for samples designated as standards.
The SDS software calculates the amount of unknown samples by interpolating values from this standard curve.
Analyzing Absolute Analyzing Absolute Quantification DataQuantification Data

40
Analyzing Absolute Analyzing Absolute Quantification DataQuantification Data
•Position
•Sample Name
•Detector (Marker)
•Task (Unknown, Standard,
or Negative Control)
•CT
•Quantity
•Quantity Mean
•Quantity Standard Deviation

41
Relative QuantificationRelative Quantification-- ∆CT Method ---- ∆CT Method --
We only need information on relative We only need information on relative amount rather than exact amountamount rather than exact amount
The method used in our labThe method used in our lab

42
Setup for Relative Setup for Relative QuantificationQuantification
Modified DNA as templatesModified DNA as templates Methylation sequence specific forward and Methylation sequence specific forward and
backward primersbackward primers Taqman Probes: 5’-FAM---------TEMRA-3’Taqman Probes: 5’-FAM---------TEMRA-3’ Taqman Universal PCR Master MixTaqman Universal PCR Master Mix Negative control contains PCR reagents but Negative control contains PCR reagents but
without DNA – ddHwithout DNA – ddH22OO Replicate wells -- using three or more replicaReplicate wells -- using three or more replica
te reactions per sample to ensure statistical ste reactions per sample to ensure statistical significance.ignificance.

43
Setup for Relative Setup for Relative QuantificationQuantification
-- Different from Absolute -- Different from Absolute Quantification --Quantification -- A calibrator -- The sample used as the basis foA calibrator -- The sample used as the basis fo
r comparative results. r comparative results. A universal methylated positive control was used iA universal methylated positive control was used i
n this study as a calibrator. n this study as a calibrator. An endogenous control gene -- A gene present An endogenous control gene -- A gene present
at a consistent expression level in all experimat a consistent expression level in all experimental samples. An endogenous gene is used as ental samples. An endogenous gene is used as an internal control of the difference amount an internal control of the difference amount of input DNA.of input DNA. ACTB gene without CpG dinucleotides was used as ACTB gene without CpG dinucleotides was used as
endogenous control gene in this study.endogenous control gene in this study.

44
Setup for Relative Setup for Relative QuantificationQuantification
Calibrator
Negative control
Endogenous control gene; others are all target genes

45
Setup for Relative Setup for Relative QuantificationQuantification
Times and Temperatures for RT-PCR
Initial Step PCR (Each of 40 cycles)
AmpliTaq Gold DNA Polymerase Avtivation
Melt Anneal/Extend
HOLD CYCLE
10 mins at 95℃ 15 sec at 95℃ 1 min at 60℃

46
Analyzing Relative Analyzing Relative Quantification DataQuantification Data
Automatic CT or manual CT: the threshold is set in the exponential phase of the amplification curve.
Automatic baseline or manual baseline: the amplification curve begins after the maximum baseline.

47
Analyzing Relative Analyzing Relative Quantification DataQuantification Data
∆∆∆∆CCTT Method Method ∆∆CCT T (sample) = C(sample) = CT T (marker)- C(marker)- CT T (ACTB)(ACTB) ∆∆CCT T (calibrator) = C(calibrator) = CT T (marker)- C(marker)- CT T (ACTB)(ACTB) ∆∆∆∆CCTT = ∆C = ∆CT T (sample) - ∆C(sample) - ∆CT T (calibrator) (calibrator) Relative quantification of methylated 5’-cytosiRelative quantification of methylated 5’-cytosi
ne = Ene = E(-∆∆CT)(-∆∆CT) E: efficiency of amplificationE: efficiency of amplification Assumption: E = 2 for both marker and endogenouAssumption: E = 2 for both marker and endogenou
s genes gene

48
Analyzing Relative Quantification Analyzing Relative Quantification DataData
-- Amplification Plot (linear plot of reporter signal vs cycle nu-- Amplification Plot (linear plot of reporter signal vs cycle number) --mber) --
negative control ACTB gene

49
Analyzing Relative Analyzing Relative Quantification DataQuantification Data
-- Amplification plot of positive control---- Amplification plot of positive control--
linear plot of reporter signal vs cycle numberlinear plot of reporter signal vs cycle number logarithmic plot of baseline-corrected reporter signal vs. cycle number

50
Analyzing Relative Quantification Analyzing Relative Quantification DataData
-- Amplification plot of p16 gene hypermethylation---- Amplification plot of p16 gene hypermethylation--
logarithmic plot of baseline-corrected reporter signal vs. cycle number
After adjusting baseline and threshold, software automatically calculates relative quantity (RQ) of the sample compared to the calibrator

51
Compare MSP and TaqmanCompare MSP and TaqmanMethylation Specific PCRMethylation Specific PCR Taqman Methylation assayTaqman Methylation assay
AdvantageAdvantage
•Inexpensive Inexpensive •Easy to performEasy to perform•Less prone to human errorLess prone to human error•Faster, more efficient than MSPFaster, more efficient than MSP•More specific by adding Taqman prMore specific by adding Taqman probe obe
DisadvantageDisadvantage
•Prone to human errorProne to human error•Easily get contaminatedEasily get contaminated•Labor-intensiveLabor-intensive
•Higher expenses for equipment maintHigher expenses for equipment maintenanceenance•If the ACTB assay fails, the whole platIf the ACTB assay fails, the whole plate needed to be reapeatede needed to be reapeated

52
ReferencesReferences
http://www.appliedbiosystems.comhttp://www.appliedbiosystems.com http://pathmicro.med.sc.edu/pcr/realtime-home.hthttp://pathmicro.med.sc.edu/pcr/realtime-home.ht
mm http://www.biorad.comhttp://www.biorad.com Eads CA., et al. MethyLight: a high-throughput assaEads CA., et al. MethyLight: a high-throughput assa
y to measure DNA methylation. Nucleic Acids Res., y to measure DNA methylation. Nucleic Acids Res., 28: e32, 2000.28: e32, 2000.
Zeschniqk M., et al. Zeschniqk M., et al. A novel real-time PCR assay for A novel real-time PCR assay for quantitative analysis of methylated alleles (QAMA): quantitative analysis of methylated alleles (QAMA): analysis of the retinoblastoma locus. Nucleic Acids analysis of the retinoblastoma locus. Nucleic Acids Res., 7: 3125, 2004.Res., 7: 3125, 2004.

53
Selected Results from Lung Selected Results from Lung and Head and Neck Cancer and Head and Neck Cancer
StudyStudyShu-Chun Chuang Ph.D

54
Materials and MethodsMaterials and Methods Study design: a population-based case-control studyStudy design: a population-based case-control study
Subject selection criteria: Cases were newly diagnosed Subject selection criteria: Cases were newly diagnosed and pathologically confirmed. Controls were matched and pathologically confirmed. Controls were matched to cases on age, gender, and neighborhood.to cases on age, gender, and neighborhood.
Eligibility:Eligibility: Current resident of Los Angeles CountyCurrent resident of Los Angeles County 18-65 during the observation period, 1999-200418-65 during the observation period, 1999-2004 either speak English or Spanish or have translators either speak English or Spanish or have translators
availableavailable have no other primary cancers (cases)have no other primary cancers (cases) have no history of lung or head and neck cancers have no history of lung or head and neck cancers
(controls)(controls)
Biological samples: buccal cell samples were collected Biological samples: buccal cell samples were collected during the interviewduring the interview

55
Response RateResponse Rate
Eligible Interviewed (%) Buccal Biospecimen (%)
Control 1540 1040 (67.5) 928 (89.2)
Lung 1577 611 (38.7) 544 (89.0)
Oral 584 303 (51.9) 195 (64.4)
Pharynx 238 100 (42.0) 77 (77.0)
Larynx 226 90 (39.8) 79 (87.8)
Esophagus 316 108 (34.2) 97 (89.8)
Cancer Cases Reason of non-participation
Lung H & N (1) The patients died before we contacted them. 25% 10% (2) Incorrect addresses. 14% 18% (3) The patients were too ill to get interviewed. 5% 4% (4) The patients were not willing to participate. 16% 21% (5) Physicians refused our requests. 1% 1%

56
Main Effect of p16 Main Effect of p16 HypermethylationHypermethylation
P16P16HypermethylatHypermethylat
ionion
ControControlsls
N (%)N (%)
LungLung Head and NeckHead and Neck
N (%)N (%) Crude ORCrude OR(95% CI)(95% CI)
Adjusted Adjusted OROR11
(95% CI)(95% CI)
N (%)N (%) Crude ORCrude OR(95% CI)(95% CI)
Adjusted Adjusted OROR22
(95% CI)(95% CI)
NoNo 769 769 (8(84)4)
433 433 ((8811))
1.001.00 1.001.00 293 293 (8(84)4)
1.001.00 1.001.00
YesYes 146 146 (1(16)6)
100 100 ((1199))
1.22 (0.92-1.22 (0.92-1.61)1.61)
1.31 (0.94-1.31 (0.94-1.83)1.83)
57 57 (1(16)6)
1.03 (0.73-1.03 (0.73-1.43)1.43)
1.03 (0.72-1.03 (0.72-1.48)1.48)
1. Adjusted for age, sex, race, and pack-years of smoking.
2. Adjusted for age, sex, race, pack-years of smoking, and drink-years of alcohol consumption
57
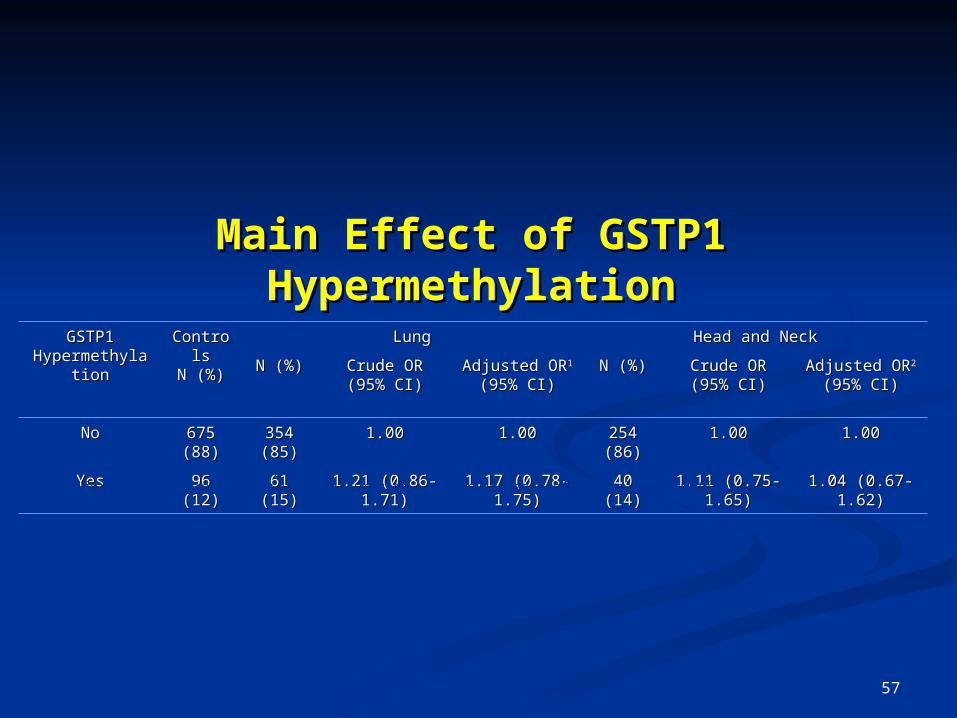
Main Effect of GSTP1 Main Effect of GSTP1 HypermethylationHypermethylation
GSTP1GSTP1HypermethylatiHypermethylati
onon
ControControlsls
N (%)N (%)
LungLung Head and NeckHead and Neck
N (%)N (%) Crude ORCrude OR(95% CI)(95% CI)
Adjusted ORAdjusted OR11
(95% CI)(95% CI)N (%)N (%) Crude ORCrude OR
(95% CI)(95% CI)Adjusted ORAdjusted OR22
(95% CI)(95% CI)
NoNo 675 675 (88)(88)
354 354 (85)(85)
1.001.00 1.001.00 254 254 (86)(86)
1.001.00 1.001.00
YesYes 96 (12)96 (12) 61 (15)61 (15) 1.21 (0.86-1.21 (0.86-1.71)1.71)
1.17 (0.78-1.17 (0.78-1.75)1.75)
40 (14)40 (14) 1.11 (0.75-1.11 (0.75-1.65)1.65)
1.04 (0.67-1.04 (0.67-1.62)1.62)
1.Adjusted for age, sex, race, and pack-years of smoking.2.Adjusted for age, sex, race, pack-years of smoking, and drink-years of alcohol consumption

58
Main Effect of MGMT Main Effect of MGMT HypermethylationHypermethylation
MGMTMGMTHypermethylatiHypermethylati
onon
ControControlsls
N (%)N (%)
LungLung Head and NeckHead and Neck
N (%)N (%) Crude ORCrude OR(95% CI)(95% CI)
Adjusted ORAdjusted OR11
(95% CI)(95% CI)N (%)N (%) Crude ORCrude OR
(95% CI)(95% CI)Adjusted ORAdjusted OR22
(95% CI)(95% CI)
NoNo 721 721 (82)(82)
380 380 (77)(77)
1.001.00 1.001.00 250 250 (76)(76)
1.001.00 1.001.00
YesYes 157 157 (18)(18)
112 112 (23)(23)
1.35 (1.03-1.35 (1.03-1.78)1.78)
1.19 (0.86-1.19 (0.86-1.65)1.65)
78 (24)78 (24) 1.43 (1.05-1.43 (1.05-1.95)1.95)
1.34 (0.96-1.34 (0.96-1.88)1.88)
1.Adjusted for age, sex, race, and pack-years of smoking.2.Adjusted for age, sex, race, pack-years of smoking, and drink-years of alcohol consumption
MGMTMGMTHypermethylatiHypermethylati
onon
ControControlsls
N (%)N (%)
PharynxPharynx
N (%)N (%) Crude ORCrude OR(95% CI)(95% CI)
Adjusted ORAdjusted OR(95% CI)(95% CI)
NoNo 721 721 (82)(82)
38 38 (68)(68)
1.001.00 1.001.00
YesYes 157 157 (18)(18)
18 18 (32)(32)
2.18 (1.21-2.18 (1.21-3.91)3.91)
2.00 (1.09-2.00 (1.09-3.68)3.68)
Adjusted for age, sex, race, pack-years of smoking, and drink-years of alcohol consumption
Stratified by Site

59
MGMT Hypermethylation by SmokingMGMT Hypermethylation by Smoking
ControlsControlsN (%)N (%)
LungLung Head and NeckHead and Neck
N (%)N (%) Crude ORCrude OR(95% CI)(95% CI)
Adjusted ORAdjusted OR11
(95% CI)(95% CI)N (%)N (%) Crude ORCrude OR
(95% CI)(95% CI)Adjusted ORAdjusted OR22
(95% CI)(95% CI)
SmokingSmoking MGMTMGMTHypermethylaionHypermethylaion
00 NoNo 341 (39)341 (39) 68 (14)68 (14) 1.001.00 1.001.00 76 (23)76 (23) 1.001.00 1.001.00
00 YesYes 77 (9)77 (9) 17 (3)17 (3) 1.11 (0.62-1.99)1.11 (0.62-1.99) 1.05 (0.57-1.92)1.05 (0.57-1.92) 24 (7)24 (7) 1.40 (0.83-2.36)1.40 (0.83-2.36) 1.37 (0.80-2.33)1.37 (0.80-2.33)
>0-40>0-40 NoNo 337 (38)337 (38) 198 (40)198 (40) 1.001.00 1.001.00 127 (39)127 (39) 1.001.00 1.001.00
>0-49>0-49 YesYes 71 (8)71 (8) 50 (10)50 (10) 1.20 (0.80-1.79)1.20 (0.80-1.79) 1.20 (0.79-1.82)1.20 (0.79-1.82) 35 (11)35 (11) 1.31 (0.83-2.06)1.31 (0.83-2.06) 1.23 (0.76-2.00)1.23 (0.76-2.00)
>40>40 NoNo 43 (5)43 (5) 114 (23)114 (23) 1.001.00 1.001.00 47 (14)47 (14) 1.001.00 1.001.00
>40>40 YesYes 9 (1)9 (1) 45 (9)45 (9) 1.89 (0.85-4.18)1.89 (0.85-4.18) 2.05 (0.91-4.61)2.05 (0.91-4.61) 19 (6)19 (6) 1.93 (0.79-4.72)1.93 (0.79-4.72) 1.88 (0.72-4.94)1.88 (0.72-4.94)
1.Adjusted for age, sex, and race.2.Adjusted for age, sex, race, and drink-years of alcohol consumption.

60
Main Effect of Multiple Methylated GenesMain Effect of Multiple Methylated GenesNumber ofNumber ofMethylatedMethylated
GenesGenes
ControlsControlsN (%)N (%)
LungLung Head and NeckHead and Neck
N (%)N (%) Crude ORCrude OR(95% CI)(95% CI)
Adjusted ORAdjusted OR11
(95% CI)(95% CI)N (%)N (%) Crude ORCrude OR
(95% CI)(95% CI)Adjusted ORAdjusted OR22
(95% CI)(95% CI)
00 590 (64)590 (64) 313 (59)313 (59) 1.001.00 1.001.00 214 (61)214 (61) 1.001.00 1.001.00
11 262 (29)262 (29) 171 (32)171 (32) 1.23 (0.97-1.56)1.23 (0.97-1.56) 1.18 (0.89-1.56)1.18 (0.89-1.56) 102 (29)102 (29) 1.07 (0.81-1.42)1.07 (0.81-1.42) 1.01 (0.75-1.37)1.01 (0.75-1.37)
2-32-3 64 (7)64 (7) 49 (9)49 (9) 1.44 (0.97-2.15)1.44 (0.97-2.15) 1.41 (0.88-2.25)1.41 (0.88-2.25) 35 (10)35 (10) 1.51 (0.97-2.34)1.51 (0.97-2.34) 1.42 (0.87-2.33)1.42 (0.87-2.33)
ContinuousContinuous 1.19 (1.01-1.39)1.19 (1.01-1.39) 1.16 (0.96-1.40)1.16 (0.96-1.40) 1.15 (0.96-1.38)1.15 (0.96-1.38) 1.11 (0.91-1.36)1.11 (0.91-1.36)
1.Adjusted for age, sex, race, and pack-years of smoking.2.Adjusted for age, sex, race, pack-years of smoking, and drink-years of alcohol consumption

61
Multiple Methylated Genes by Smoking and DrinMultiple Methylated Genes by Smoking and Drinkingking
Number ofNumber ofMethylatedMethylated
GenesGenes
ControlsControlsN (%)N (%)
LungLung Head and NeckHead and Neck Head and Neck without OralHead and Neck without Oral
N (%)N (%) Adjusted ORAdjusted OR11
(95% CI)(95% CI)N (%)N (%) Adjusted ORAdjusted OR22
(95% CI)(95% CI)N (%)N (%) Adjusted ORAdjusted OR22
(95% CI)(95% CI)
SmokingSmoking 11 22 22
00 0-10-1 398 (43)398 (43) 87 (16)87 (16) 1.001.00 94 (27)94 (27) 1.001.00 34 34 (21)(21)
1.001.00
00 2-32-3 32 (4)32 (4) 8 (2)8 (2) 0.97 (0.43-2.23)0.97 (0.43-2.23) 12 (3)12 (3) 1.59 (0.77-1.59 (0.77-3.30)3.30)
6 (4)6 (4) 1.88 (0.68-5.20)1.88 (0.68-5.20)
>0-40>0-40 0-10-1 402 (44)402 (44) 240 240 (45)(45)
1.001.00 160 160 (46)(46)
1.001.00 75 75 (46)(46)
1.001.00
>0-49>0-49 2-32-3 31 (3)31 (3) 24 (5)24 (5) 1.30 (0.74-2.31)1.30 (0.74-2.31) 15 (4)15 (4) 0.97 (0.48-0.97 (0.48-1.95)1.95)
11 (7)11 (7) 1.37 (0.60-3.12)1.37 (0.60-3.12)
>40>40 0-10-1 51 (6)51 (6) 157 157 (29)(29)
1.001.00 62 (18)62 (18) 1.001.00 35 35 (21)(21)
1.001.00
>40>40 2-32-3 1 (0.1)1 (0.1) 17 (3)17 (3) 5.69 (0.73-5.69 (0.73-44.22)44.22)
8 (2)8 (2) 7.32 (0.84-7.32 (0.84-63.8)63.8)
3 (2)3 (2) 2.67 (0.21-33.7)2.67 (0.21-33.7)
DrinkingDrinking 33 33 33
<2<2 0-10-1 715 (78)715 (78) 346 346 (65)(65)
1.001.00 183 183 (52)(52)
1.001.00 81 81 (50)(50)
1.001.00
<2<2 2-32-3 55 (6)55 (6) 38 (7)38 (7) 1.41 (0.86-2.33)1.41 (0.86-2.33) 20 (6)20 (6) 1.42 (0.81-1.42 (0.81-2.49)2.49)
8 (5)8 (5) 1.24 (0.53-2.87)1.24 (0.53-2.87)
22 0-10-1 134 (15)134 (15) 137 137 (26)(26)
1.001.00 133 133 (38)(38)
1.001.00 63 63 (39)(39)
1.001.00
22 2-32-3 9 (1)9 (1) 11 (2)11 (2) 1.01 (0.31-3.24)1.01 (0.31-3.24) 14 (4)14 (4) 1.61 (0.65-1.61 (0.65-4.02)4.02)
11 (7)11 (7) 2.95 (1.08-8.07)2.95 (1.08-8.07)
1.Adjusted for age, sex, and race.2.Adjusted for age, sex, race, and drink-years of alcohol consumption.3.Adjusted for age, sex, race, and pack-years of smoking.

62
Main Effect of Folate Intake from Nature FoMain Effect of Folate Intake from Nature Foodod
FolateFolate IntakeIntake
((g/day)g/day)
ControControlsls
LungLung Head and NeckHead and Neck
N (%)N (%) N (%)N (%) Crude ORCrude OR(95% CI)(95% CI)
Adjusted ORAdjusted OR11
(95% CI)(95% CI)N (%)N (%) Crude ORCrude OR
(95% CI)(95% CI)Adjusted ORAdjusted OR22
(95% CI)(95% CI)
>300>300 102 102 (12)(12)
64 (11)64 (11) 1.001.00 1.001.00 71 (19)71 (19) 1.001.00 1.001.00
200-300200-300 265 265 (31)(31)
165 165 (29)(29)
0.99 (0.69-0.99 (0.69-1.43)1.43)
1.24 (0.79-1.24 (0.79-1.96)1.96)
98 (26)98 (26) 0.53 (0.36-0.53 (0.36-0.79)0.79)
0.79 (0.51-0.79 (0.51-1.21)1.21)
100-200100-200 412 412 (48)(48)
262 262 (46)(46)
1.01 (0.72-1.01 (0.72-1.44)1.44)
0.93 (0.59-0.93 (0.59-1.47)1.47)
162 162 (43)(43)
0.57 (0.40-0.57 (0.40-0.80)0.80)
0.85 (0.55-0.85 (0.55-1.33)1.33)
100100 78 (9)78 (9) 76 (13)76 (13) 1.55 (1.00-1.55 (1.00-2.42)2.42)
0.91 (0.50-0.91 (0.50-1.66)1.66)
48 (13)48 (13) 0.88 (0.55-0.88 (0.55-1.42)1.42)
1.32 (0.72-1.32 (0.72-2.43)2.43)
P for P for trendtrend
0.10330.1033 0.30390.3039 0.34050.3405 0.44280.4428
1.Adjusted for age, sex, race, pack-years of smoking, total energy intake, and BMI.2.Adjusted for age, sex, race, pack-years of smoking, drink-years of alcohol consumption, total energy intake, and BMI

63
Folate Intake by Smoking and DrinkiFolate Intake by Smoking and Drinkingng
ControControlsls
LungLung Head and NeckHead and Neck
N (%)N (%) N (%)N (%) Crude ORCrude OR(95% CI)(95% CI)
Adjusted ORAdjusted OR(95% CI)(95% CI)
N (%)N (%) Crude ORCrude OR(95% CI)(95% CI)
Adjusted ORAdjusted OR(95% CI)(95% CI)
SmokingSmoking FolateFolate((g/dag/da
y)y)
11 22
NeverNever >200>200 183 183 (21)(21)
43 (7)43 (7) 1.001.00 1.001.00 55 (15)55 (15) 1.001.00 1.001.00
NeverNever 200200 219 219 (26)(26)
55 (10)55 (10) 1.07 (0.69-1.07 (0.69-1.67)1.67)
0.76 (0.46-0.76 (0.46-1.27)1.27)
65 (17)65 (17) 0.99 (0.66-0.99 (0.66-1.49)1.49)
1.02 (0.63-1.02 (0.63-1.65)1.65)
EverEver >200>200 184 184 (21)(21)
186 186 (33)(33)
1.001.00 1.001.00 114 114 (30)(30)
1.001.00 1.001.00
EverEver 200200 271 271 (32)(32)
283 283 (50)(50)
1.04 (0.80-1.04 (0.80-1.35)1.35)
0.79 (0.55-0.79 (0.55-1.12)1.12)33
145 145 (38)(38)
0.87 (0.64-0.87 (0.64-1.18)1.18)
1.10 (0.73-1.10 (0.73-1.66)1.66)33
DrinkingDrinking(drinks/(drinks/
day)day)
FolateFolate((g/dag/da
y)y)
33 33
0-20-2 >200>200 303 303 (35)(35)
153 153 (27)(27)
1.001.00 1.001.00 99 (26)99 (26) 1.001.00 1.001.00
0-20-2 200200 428 428 (50)(50)
259 259 (46)(46)
1.20 (0.93-1.20 (0.93-1.54)1.54)
0.77 (0.56-0.77 (0.56-1.05)1.05)
129 129 (34)(34)
0.92 (0.68-0.92 (0.68-1.25)1.25)
0.98 (0.70-0.98 (0.70-1.38)1.38)
22 >200>200 63 (7)63 (7) 76 (13)76 (13) 1.001.00 1.001.00 69 (18)69 (18) 1.001.00 1.001.00
22 200200 61 (7)61 (7) 79 (14)79 (14) 1.07 (0.67-1.07 (0.67-1.72)1.72)
0.87 (0.47-0.87 (0.47-1.59)1.59)
81 (21)81 (21) 1.21 (0.75-1.21 (0.75-1.95)1.95)
1.48 (0.86-1.48 (0.86-2.56)2.56)
1.Adjusted for age, sex, race, total energy intake, and BMI.2.Adjusted for age, sex, race, drink-years of alcohol consumption, total energy intake, and BMI.3.Adjusted for age, sex, race, pack-years of smoking, total energy intake, and BMI.

64
Main Effect for MTHFR C677T Main Effect for MTHFR C677T PolymorphismPolymorphism
MTHFMTHFRR
C677TC677T
ControControlsls
LungLung Head and NeckHead and Neck
N (%)N (%) N (%)N (%) Crude ORCrude OR(95% CI)(95% CI)
Adjusted ORAdjusted OR11
(95% CI)(95% CI)N (%)N (%) Crude ORCrude OR
(95% CI)(95% CI)Adjusted ORAdjusted OR22
(95% CI)(95% CI)
CCCC 391 391 (42)(42)
256 256 (49)(49)
1.001.00 1.001.00 173 173 (46)(46)
1.001.00 1.001.00
CTCT 411 411 (45)(45)
211 211 (40)(40)
0.78 (0.62-0.78 (0.62-0.99)0.99)
0.80 (0.61-0.80 (0.61-1.05)1.05)
160 160 (43)(43)
0.88 (0.68-0.88 (0.68-1.14)1.14)
1.02 (0.77-1.02 (0.77-1.35)1.35)
TTTT 118 118 (13)(13)
59 (11)59 (11) 0.76 (0.54-0.76 (0.54-1.08)1.08)
0.87 (0.57-0.87 (0.57-1.31)1.31)
41 (11)41 (11) 0.79 (0.53-0.79 (0.53-1.17)1.17)
0.97 (0.63-0.97 (0.63-1.49)1.49)
1.Adjusted for age, sex, race, and pack-years of smoking.2.Adjusted for age, sex, race, pack-years of smoking, and drink-years of alcohol consumption.

65
Multiple Methylated Genes byMultiple Methylated Genes byFolate Intake and MTHFR C677TFolate Intake and MTHFR C677T
ControControlsls
LungLung Head and NeckHead and Neck Head and Neck without Head and Neck without OralOral
N (%)N (%) N (%)N (%) Adjusted ORAdjusted OR(95% CI)(95% CI)
N (%)N (%) Adjusted ORAdjusted OR(95% CI)(95% CI)
N (%)N (%) Adjusted ORAdjusted OR(95% CI)(95% CI)
Folate (Folate (g/dag/day)y)
NumbeNumbersrs
11 22 22
>200>200 0-10-1 302 302 (40)(40)
179 179 (36)(36)
1.001.00 108 108 (40)(40)
1.001.00 43 43 (36)(36)
1.001.00
>200>200 2-32-3 27 (4)27 (4) 22 (4)22 (4) 1.18 (0.57-1.18 (0.57-2.42)2.42)
16 (6)16 (6) 1.58 (0.76-1.58 (0.76-3.28)3.28)
10 (8)10 (8) 2.41 (0.96-6.09)2.41 (0.96-6.09)
200200 0-10-1 402 402 (53)(53)
271 271 (55)(55)
1.001.00 131 131 (49)(49)
1.001.00 60 60 (50)(50)
1.001.00
200200 2-32-3 33 (4)33 (4) 23 (5)23 (5) 1.06 (0.54-1.06 (0.54-2.06)2.06)
12 (4)12 (4) 1.09 (0.50-1.09 (0.50-2.39)2.39)
7 (6)7 (6) 1.07 (0.36-3.17)1.07 (0.36-3.17)
MTHFR MTHFR C677TC677T
33 44 44
CCCC 0-10-1 345 345 (38)(38)
229 229 (45)(45)
1.001.00 144 144 (42)(42)
1.001.00 70 70 (45)(45)
1.001.00
CCCC 2-32-3 32 (4)32 (4) 21 (4)21 (4) 0.98 (0.50-0.98 (0.50-1.93)1.93)
15 (4)15 (4) 0.92 (0.42-0.92 (0.42-1.98)1.98)
8 (5)8 (5) 0.52 (0.16-1.68)0.52 (0.16-1.68)
CT/TTCT/TT 0-10-1 485 485 (54)(54)
237 237 (46)(46)
1.001.00 160 160 (47)(47)
1.001.00 66 66 (42)(42)
1.001.00
CT/TTCT/TT 2-32-3 32 (4)32 (4) 26 (5)26 (5) 1.64 (0.86-1.64 (0.86-3.14)3.14)
20 (6)20 (6) 2.05 (1.09-2.05 (1.09-3.85)3.85)
12 (8)12 (8) 3.56 (1.65-7.67)3.56 (1.65-7.67)
1.Adjusted for age, sex, race, pack-years of smoking, total energy intake, and BMI.2.Adjusted for age, sex, race, pack-years of smoking, drink-years of alcohol consumption, total energy intake, and BMI.3.Adjusted for age, sex, race, and pack-years of smoking.Adjusted for age, sex, race, pack-years of smoking, and drink-years of alcohol consumption.

66
Practical Issues on MSPPractical Issues on MSP
Adequate sample?Adequate sample? Need relatively large amount of DNANeed relatively large amount of DNA Can not use amplified DNACan not use amplified DNA ContaminationContamination Time consuming and labor intensiveTime consuming and labor intensive