Embed Size (px)
Citation preview

11
Difficulties in analysing non-Difficulties in analysing non-randomised trials (…and ways randomised trials (…and ways
forward?)forward?)
RCTs in the Social Sciences: challenges and RCTs in the Social Sciences: challenges and prospects. York University, prospects. York University, 13-15 Sept. 13-15 Sept.
20062006
Paul MarchantPaul MarchantLeeds Metropolitan UniversityLeeds Metropolitan [email protected]@leedsmet.ac.uk
(Paul Baxter from Department of Statistics, University of (Paul Baxter from Department of Statistics, University of Leeds is involved in developing some of this work)Leeds is involved in developing some of this work)
22
The Basic PointThe Basic Point My thoughts, My thoughts, If Non_RCTs are used, we need a good If Non_RCTs are used, we need a good
understanding of the system being studied understanding of the system being studied and a quantitative model to work out what and a quantitative model to work out what is lost and what the effect is.is lost and what the effect is.
The effects being sought may be small so The effects being sought may be small so impact of small systematic errors can be impact of small systematic errors can be important.important.
Probably best just to use RCTs, especially Probably best just to use RCTs, especially when policy implications are costly. when policy implications are costly.

33
The problemThe problem In crime research there is a 5 point In crime research there is a 5 point
‘Maryland Scientific Methods Scale’ ‘Maryland Scientific Methods Scale’ which orders trial designs (RCT is the which orders trial designs (RCT is the top )top )
While the ordering may be fine there While the ordering may be fine there is no formal indication of what is lost is no formal indication of what is lost by using a 4 rather than a 5. by using a 4 rather than a 5.
A large potential exists it would seem A large potential exists it would seem of drawing false inference.of drawing false inference.

44
The Randomised Controlled The Randomised Controlled TrialTrial
(A truly marvellous scientific (A truly marvellous scientific invention)invention) Note to avoid ‘bias’:Note to avoid ‘bias’:
Allocation is best Allocation is best made tamper-proof. made tamper-proof. (e.g. use (e.g. use
‘concealment’)‘concealment’) Use multiple Use multiple
blinding of:blinding of: patients, patients, physicians, physicians, assessors, assessors, analysts …analysts …
Population
Take Sample
Randomise to 2 groups
Old Treatment
Compare outcomes (averages) recognising that
these are sample results and subject to sampling variation when applying back to the population
New Treatment

55
Counts of those cured and not Counts of those cured and not cured under the two cured under the two
treatmentstreatmentsCured Not
CuredNew Treatment a b
Control(Standard treatment)
c d
By comparing the ratios of numbers ‘cured’ to ‘not cured’ in the 2 arms of the trial, the CPR= (ad)/(cb), it is possible to tell if the new treatment is better.
66
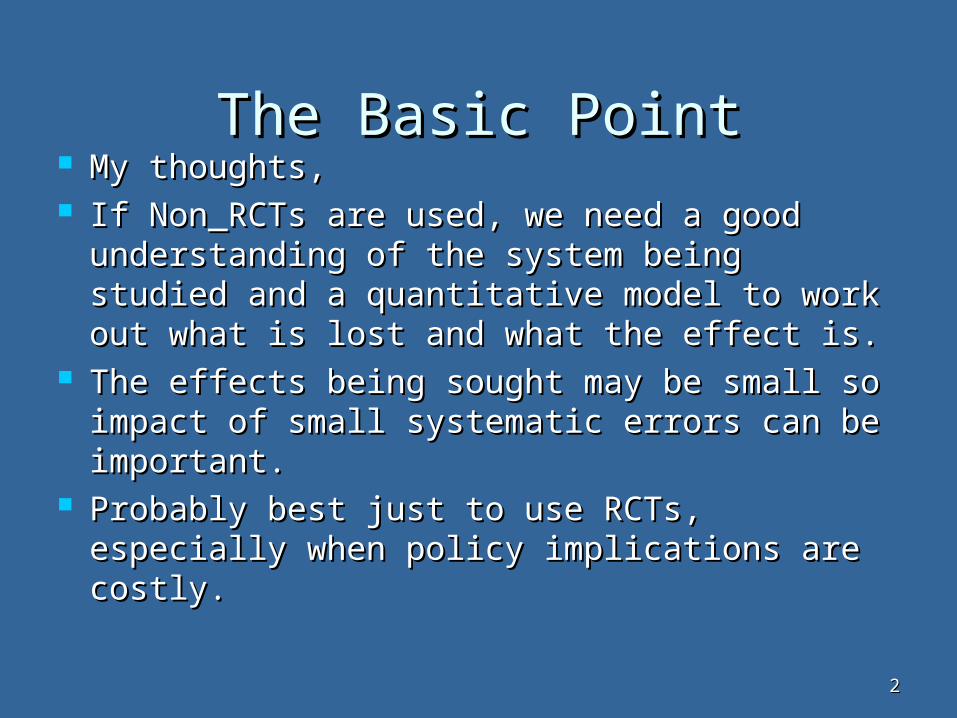
Confidence IntervalsConfidence Intervals However there is However there is sampling variability, sampling variability, because we because we
don’t study everybody of interest; just our don’t study everybody of interest; just our randomrandom samplesample. .
So cannot have perfect knowledge of the effect of So cannot have perfect knowledge of the effect of interest, but only an estimate of it interest, but only an estimate of it within a within a confidence interval (CI)confidence interval (CI). .
Need to know how to calculate the CI appropriately. Need to know how to calculate the CI appropriately. This can be done under assumptions, which seem This can be done under assumptions, which seem reasonable for the case of a clinical RCT and leads reasonable for the case of a clinical RCT and leads to a simple formula for the approximate CI (+/-1.96 to a simple formula for the approximate CI (+/-1.96 standard error) of ln(CPR)standard error) of ln(CPR)(s.e. (ln(CPR)) )(s.e. (ln(CPR)) )22= Var(ln(CPR))= Var(ln(CPR))
== 11 + + 11 + + 11 + + 1 1 a b c d a b c d
77
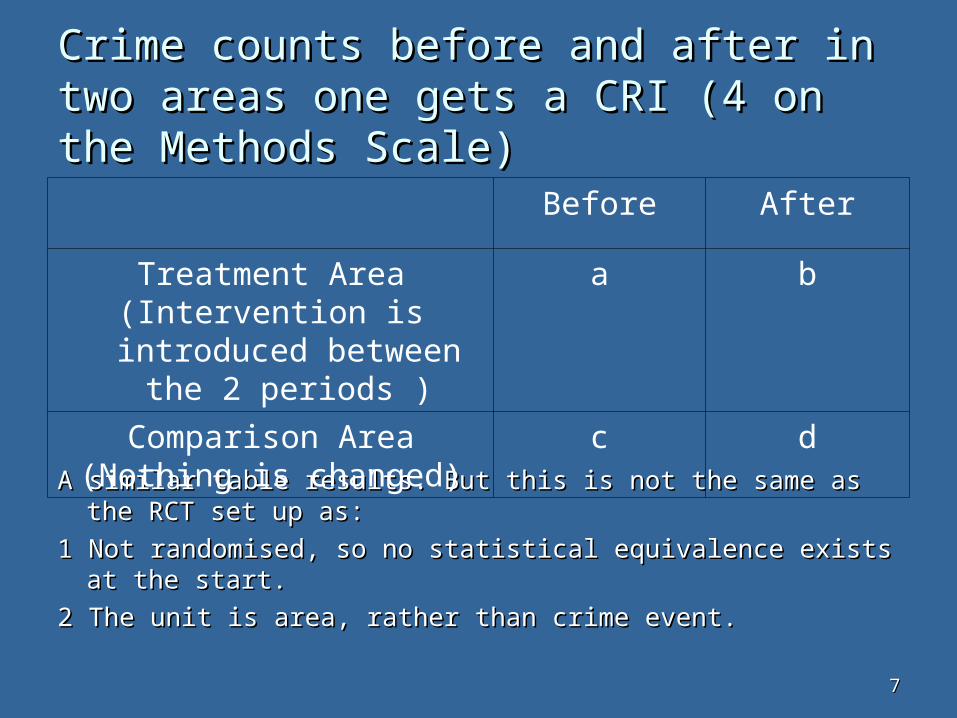
Crime counts before and after in two Crime counts before and after in two areas one gets a CRI (4 on the areas one gets a CRI (4 on the Methods Scale)Methods Scale)
A similar table results. But this is not the same as the RCT set A similar table results. But this is not the same as the RCT set up as: up as:
1 Not randomised, so no statistical equivalence exists at the 1 Not randomised, so no statistical equivalence exists at the start. start.
2 The unit is area, rather than crime event. 2 The unit is area, rather than crime event.
Before After
Treatment Area(Intervention is introduced
between the 2 periods )
a b
Comparison Area(Nothing is changed)
c d

88
Lighting andLighting and crimecrime
There seem to be many ‘theoretical There seem to be many ‘theoretical suggestions’ why lighting might suggestions’ why lighting might increase or decrease crime. increase or decrease crime.
The meta-analysis, HORS251, by The meta-analysis, HORS251, by Farrington and Welsh suggests Farrington and Welsh suggests strongly that lighting beats crime. strongly that lighting beats crime. However my contention is that this However my contention is that this study remains flawed and so we are study remains flawed and so we are ignorant of the effect of lighting on ignorant of the effect of lighting on crime. (Note also HORS252 on CCTV)crime. (Note also HORS252 on CCTV)

99
Forest Plot as HORS 251 Meta-analysisForest Plot as HORS 251 Meta-analysis
reconstructedreconstructed
Odds ratio.156196 1 6.40222
Study % Weight Odds ratio (95% CI)
3.82 (2.28,6.40) Birmingham 0.7
1.72 (1.17,2.52) Stoke 1.8
1.39 (1.04,1.86) Atlanta 3.4
1.44 (1.17,1.77) Dudley 6.6
1.38 (0.97,1.97) Fort Worth 2.3
1.37 (1.06,1.77) Milwaukee 4.4
1.35 (1.23,1.47) Bristol 37.8
1.24 (0.95,1.64) Kansas City 4.2
1.14 (0.62,2.08) Dover 0.9
1.02 (0.75,1.40) Harrisburg 3.5
1.01 (0.89,1.15) New Orleans 21.2
0.94 (0.79,1.12) Portland 11.3
0.75 (0.47,1.18) Indianapolis 1.9
1.23 (1.17,1.31) Overall (95% CI)

1010
But this can’t be right.But this can’t be right. The assumptions for calculating the CIs cannot The assumptions for calculating the CIs cannot
be correct, in this case. Unit is area not crime. be correct, in this case. Unit is area not crime. The events are not statistically independent.The events are not statistically independent.
Too much variation (heterogeneity) exists Too much variation (heterogeneity) exists between individual study results compared between individual study results compared with the uncertainty indicated by confidence with the uncertainty indicated by confidence intervals, (if the lighting has the same effect intervals, (if the lighting has the same effect on crime in every study).on crime in every study).
Note there is great variation in crime counts Note there is great variation in crime counts between periods in the comparison areas, between periods in the comparison areas, where nothing is changed, so the where nothing is changed, so the heterogeneity is inherent to the natural heterogeneity is inherent to the natural variation of crime.variation of crime.

1111
Pointing out the problemPointing out the problem Marchant (2004), 7 page article in the Marchant (2004), 7 page article in the
British Journal of Criminology drawing British Journal of Criminology drawing attention to the problem. The formula for attention to the problem. The formula for the CIs used must be inappropriate (also the CIs used must be inappropriate (also mentioning other short-comings).mentioning other short-comings).
The authors of HORS251 had 20-page The authors of HORS251 had 20-page response on the next page, justifying the response on the next page, justifying the claim that lighting reduces crime. claim that lighting reduces crime.
But I remain unconvinced by the claim.But I remain unconvinced by the claim.

1212
Fixing the Heterogeneity Fixing the Heterogeneity Problem Problem A way of making the problem go away is simply A way of making the problem go away is simply
to increase the uncertainty, i.e. stretch the CIs . to increase the uncertainty, i.e. stretch the CIs . (‘A quasi-Poisson model’).(‘A quasi-Poisson model’).
Here the CIs are stretched by a factor of 2.1. Here the CIs are stretched by a factor of 2.1. (Equivalent to reducing the events counted in (Equivalent to reducing the events counted in every setting by a factor 2.1every setting by a factor 2.12 2 = 4.4. ). This = 4.4. ). This adjustment has been made by the authors.adjustment has been made by the authors.
Problem solved.... or is it? Is such model Problem solved.... or is it? Is such model plausible? Assumes every study should have its CI plausible? Assumes every study should have its CI stretched by the same factor. This cannot be stretched by the same factor. This cannot be guaranteed. guaranteed.
Only relatively few (13) studies.Only relatively few (13) studies. Need sensitivity analysis Need sensitivity analysis

1313
Time Variation in CrimeTime Variation in Crime
It appears that little is known about how It appears that little is known about how crime varies on various scales. crime varies on various scales.
Much more needs to be known about the Much more needs to be known about the occurrence of crime events to know how to occurrence of crime events to know how to analyse them properly to be able find analyse them properly to be able find effects.effects.
Need access to suitable data sets to Need access to suitable data sets to examine this issue. This is on going examine this issue. This is on going research in which myself and colleagues are research in which myself and colleagues are engaged.engaged.
A general point: one needs to have A general point: one needs to have knowledge about the system in order to knowledge about the system in order to understand if an intervention changes understand if an intervention changes things. (And in order to design studies)things. (And in order to design studies)
1414
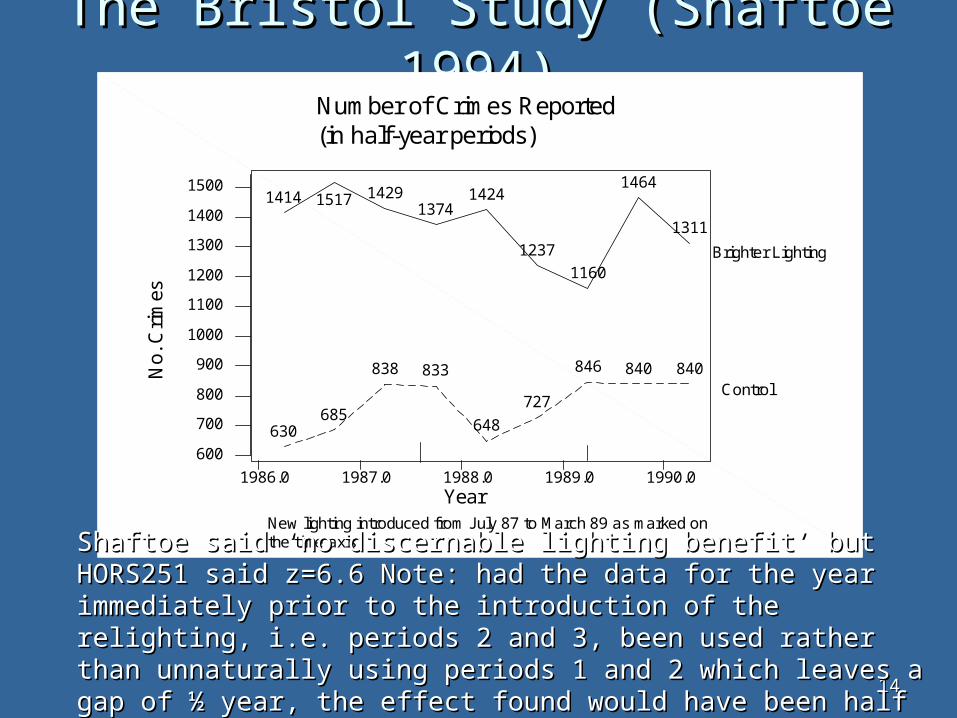
The Bristol Study (Shaftoe The Bristol Study (Shaftoe 1994)1994)
1990.01989.01988.01987.01986.0
1500
1400
1300
1200
1100
1000
900
800
700
600
Year
No.
Cri
mes
1311
1464
1160
1237
14241374
142915171414
840840846
727
648
833838
685630
Number of Crimes Reported(in half-year periods)
Brighter Lighting
Control
New lighting introduced from July 87 to March 89 as marked onthe time axis.
Shaftoe said ‘no discernable lighting benefit’ but HORS251 said Shaftoe said ‘no discernable lighting benefit’ but HORS251 said z=6.6 Note: had the data for the year immediately prior to the z=6.6 Note: had the data for the year immediately prior to the introduction of the relighting, i.e. periods 2 and 3, been used introduction of the relighting, i.e. periods 2 and 3, been used rather than unnaturally using periods 1 and 2 which leaves a rather than unnaturally using periods 1 and 2 which leaves a gap of ½ year, the effect found would have been half of that gap of ½ year, the effect found would have been half of that claimed. (Shows large variability.)claimed. (Shows large variability.)

1515
Household studiesHousehold studies In a couple of instances, instead of just counting In a couple of instances, instead of just counting
recorded crimes a, b, c, d in the 4 cells (before, recorded crimes a, b, c, d in the 4 cells (before, after, intervention, comparison), a household after, intervention, comparison), a household survey before and after of recalled crimes within survey before and after of recalled crimes within the 2 areas (intervention, comparison) is carried the 2 areas (intervention, comparison) is carried out. out.
One problem is that (unrecognised by authors One problem is that (unrecognised by authors Painter and Farrington) spatial correlation Painter and Farrington) spatial correlation between the occurrence of crime needs to between the occurrence of crime needs to considered. Gives rise to a Design Effect familiar considered. Gives rise to a Design Effect familiar in clustered designs. Reduces the precision of the in clustered designs. Reduces the precision of the estimate of effect.estimate of effect.
Other problems, e.g. of differential change of Other problems, e.g. of differential change of composition between periods.composition between periods.
1616
Lack of Equivalence between Lack of Equivalence between AreasAreas
Invariably it is the most crime-ridden Invariably it is the most crime-ridden area that gets the lighting, whereas area that gets the lighting, whereas the relatively crime-free ‘control’ the relatively crime-free ‘control’ area is not re-lit. So there is lack of area is not re-lit. So there is lack of equivalence at the start. One effect equivalence at the start. One effect of this is to allow of this is to allow ‘regression ‘regression towards the mean’towards the mean’ to operate. to operate.
The name The name ‘Control‘Control Area’ is a Area’ is a misnomer. ‘misnomer. ‘ComparisonComparison Area’ is a Area’ is a better name.better name.

1717
Regression towards the Regression towards the meanmean
X The before measurement
Y T
he a
fter
mea
sure
men
t
Cloud ofDataPoints
Line of Equality
0 10050
0
50
100
Line of mean of Y for a given X

1818
The response given to the lack of The response given to the lack of equivalence between the 2 areas. equivalence between the 2 areas. (RTM)(RTM) Farrington and Welsh (2006) claim that RTM is a Farrington and Welsh (2006) claim that RTM is a
not problem because the effect in counted crimes not problem because the effect in counted crimes in 250 Police ‘Basic Command Units’ going from in 250 Police ‘Basic Command Units’ going from 2002/3 to 2003/4 showed only small effect (a few 2002/3 to 2003/4 showed only small effect (a few %). This is hardly surprising as the areas and %). This is hardly surprising as the areas and hence the number of crimes counted are an order hence the number of crimes counted are an order of magnitude larger than in HORS251 so the year of magnitude larger than in HORS251 so the year to year correlation is expected to be higher than to year correlation is expected to be higher than for the small lighting study areas. for the small lighting study areas.
Note Wrigley (1995) “This tendency for correlation Note Wrigley (1995) “This tendency for correlation coefficients to increase in magnitude as the size of coefficients to increase in magnitude as the size of the areal unit involved increases has been known the areal unit involved increases has been known since the work of Gehlke and Biehl (1934)”.since the work of Gehlke and Biehl (1934)”.

1919
Natural Log Burglary Rate in Period 1
Na
tura
l Lo
g B
urg
lary
Ra
te in
Pe
rio
d 2
-1.0-1.5-2.0-2.5-3.0-3.5-4.0
-1.0
-1.5
-2.0
-2.5
-3.0
-3.5
Log crime rates in successive Log crime rates in successive periodsperiods

2020
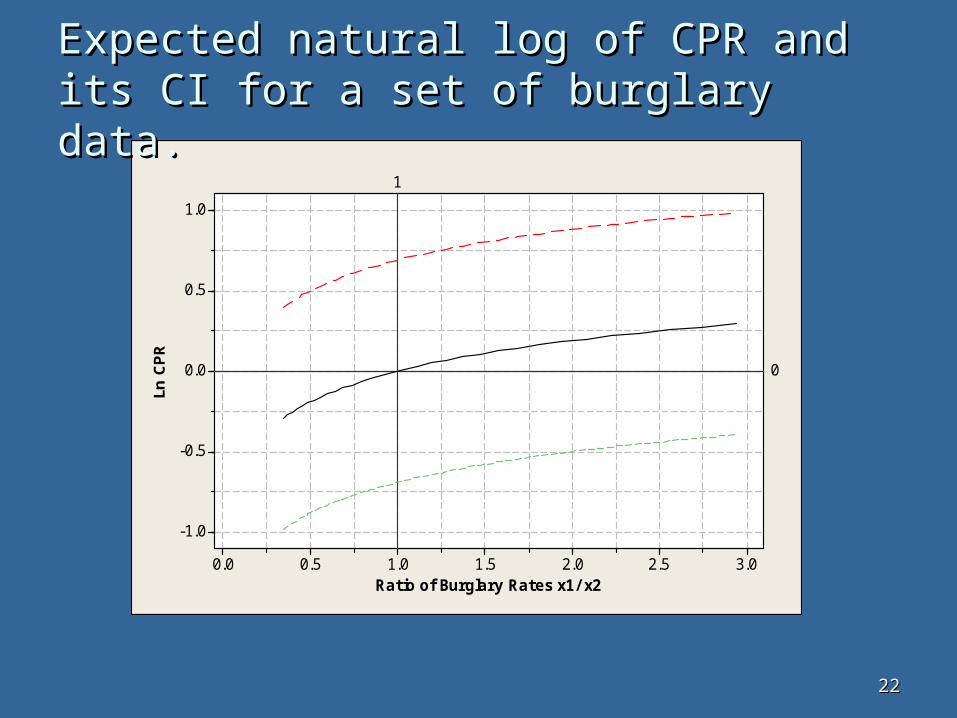
Estimating the effect of RTM Estimating the effect of RTM
On the basis of log normal crime rates it can On the basis of log normal crime rates it can be shown that if the intervention has no be shown that if the intervention has no effect, the expected ln effect, the expected ln CPR CPR = = (1-(1-ρσρσyy//σσxx) ) ln xln x11/x/x2 2
xx11/x/x2 2 is the crime rate ratio; is the crime rate ratio; σσx, x, σσy y the sds on the sds on the log scale and the log scale and ρρ the correlation on the the correlation on the log scalelog scale
variance ln variance ln CPR = CPR = 2 2 σσyy22(1-(1-ρρ22))

2121
Estimation of the effect of RTMEstimation of the effect of RTM The simple model of crime rates suggests that the The simple model of crime rates suggests that the
high year to year correlation typically 0.95 for the BCU high year to year correlation typically 0.95 for the BCU data, would indeed give an effect of a few %. data, would indeed give an effect of a few %.
However the smaller areas used in CRI evaluation However the smaller areas used in CRI evaluation would be expected to have lower correlationwould be expected to have lower correlation
Burglary data from a study of 124 areas has Burglary data from a study of 124 areas has correlation of about 0.8 giving, all else equal, an correlation of about 0.8 giving, all else equal, an expected effect 4 times larger comparable to the expected effect 4 times larger comparable to the claimed lighting effect.claimed lighting effect.
Note: in general we don’t know the correlation nor Note: in general we don’t know the correlation nor rates being compared for the lighting studies. rates being compared for the lighting studies. However, we do know, whereas the household crime However, we do know, whereas the household crime rate ratio at the start was 1.40 for Dudley, that for rate ratio at the start was 1.40 for Dudley, that for Stoke was 2.51 giving a much larger expected RTM Stoke was 2.51 giving a much larger expected RTM effect.effect.
Without better knowledge we can’t be definite about Without better knowledge we can’t be definite about the impact of RTM but the indications are that the bias the impact of RTM but the indications are that the bias could be serious and uncertainty large.could be serious and uncertainty large.
2222
Ratio of Burglary Rates x1/ x2
Ln C
PR
3.02.52.01.51.00.50.0
1.0
0.5
0.0
-0.5
-1.0
1
0
Expected natural log of CPR and its CI Expected natural log of CPR and its CI for a set of burglary data.for a set of burglary data.
2323
Potential consequences of weak Potential consequences of weak methodsmethods
Because there is a tendency to find ‘positive Because there is a tendency to find ‘positive effects’ and probably even more so with less effects’ and probably even more so with less rigorous work, one is likely to end up with an rigorous work, one is likely to end up with an even more distorted research record. even more distorted research record.
This might lead dubious justification through This might lead dubious justification through flimsy cost benefit analyses justifying a bad flimsy cost benefit analyses justifying a bad policy.policy.
While it might be possible to estimate the effect While it might be possible to estimate the effect of the excess variability or the effect of RTM of the excess variability or the effect of RTM discussed, it would seem problematic to be discussed, it would seem problematic to be confident about adequately adjusting for them.confident about adequately adjusting for them.
RCTs would avoid many problems and may be RCTs would avoid many problems and may be very cheap relative to policy costs.very cheap relative to policy costs.
2424
Some conclusionsSome conclusions A ‘Methods Scale’ seems to suggest that designs A ‘Methods Scale’ seems to suggest that designs
weaker than RCTs might suffice, without indicating weaker than RCTs might suffice, without indicating what is lost. what is lost.
I have indicated some of the problems which result.I have indicated some of the problems which result. Need to ‘foster scepticism’ (Gorard 2002)Need to ‘foster scepticism’ (Gorard 2002) I remain to be convinced that the deficiencies can be I remain to be convinced that the deficiencies can be
adequately overcome through estimating adequately overcome through estimating quantitatively the consequences of using a weaker quantitatively the consequences of using a weaker design.design.
Weaker designs Weaker designs mightmight be useful in preliminary be useful in preliminary research but should not be considered as adequate research but should not be considered as adequate when there are expensive consequences.when there are expensive consequences.
RCTs can be problematic enough! (We need RCTs can be problematic enough! (We need registered trials, published protocols, blinding registered trials, published protocols, blinding etc…..)etc…..)
Evaluations of policies need to be done to a high Evaluations of policies need to be done to a high scientific standard.scientific standard.

2525
ReferencesReferences
Farrington D.P. and Welsh B.C. (2002) The Effects of Improved Street Lighting on Crime: A Systematic Review, Home Office Research Study 251, http://www.homeoffice.gov.uk/rds/pdfs2/hors251.pdf
Farrington D.P. and Welsh B.C. (2004) Measuring the Effects of Improved Street Lighting on Crime: A reply to Dr. Marchant The British Journal of Criminology 44 448-467 http://bjc.oupjournals.org/cgi/content/abstract/44/3/448
Farrington D.P. and Welsh B.C. (2006) How Important is Regression to the Mean in Area-Based Crime Prevention Research?, Crime Prevention and Community Safety 8 50
Gorard S (2002) Fostering Scepticism: The Importance of Warranting Claims, Evaluation and Research in Education 16 3 p136
Marchant P.R. (2004) A Demonstration that the Claim that Brighter Lighting Reduces Crime is Unfounded The British Journal of Criminology 44 441-447 http://bjc.oupjournals.org/cgi/content/abstract/44/3/441

2626
References continuedReferences continuedMarchant P.R. (2005) What Works? A Critical Note on the
Evaluation of Crime Reduction Initiatives,Crime Prevention and Community Safety 7 7-13
Painter, K. and Farrington, D. P. (1997) The Crime Reducing Effect of Improved Street Lighting: The Dudley Project, in R.V. Clarke ed., Situational Crime Prevention: Successful case studies 209-226 Harrow and Heston, Guilderland NY.
Shaftoe, H (1994) Easton/Ashley, Bristol: Lighting Improvements, in S. Osborn (ed.) Housing Safe Communities: An Evaluation of Recent Initiatives 72-77, Safe Neighbourhoods Unit, London
Tilley N., Pease K., Hough M. and Brown R. (1999) Burglary Prevention: Early Lessons from the Crime Reduction Programme, Crime Reduction Research series Paper1 London Home Office
Wrigley N., Revisiting the Modifiable Areal Unit Problem and Ecological Fallacy pp49-71 in Gould PR, Hoare AG and Cliff AD Eds Diffusing Geography: Essays for Peter Haggett
2727
The RTM problem The RTM problem The effect of RTM depends on the correlation The effect of RTM depends on the correlation
(the weaker, the bigger) and increases with (the weaker, the bigger) and increases with the size of the initial difference between the size of the initial difference between groups. groups.
Authors attempt to justify no RTM concern Authors attempt to justify no RTM concern with large area crime data which shows only with large area crime data which shows only a small RTM effect. But this is wrong, as a small RTM effect. But this is wrong, as correlation won’t be as high in the smaller correlation won’t be as high in the smaller areas used in the trials. We also don’t know areas used in the trials. We also don’t know the rates in the areas in general for the 2 we the rates in the areas in general for the 2 we do. They are quite different. (1.4X and 2.5X)do. They are quite different. (1.4X and 2.5X)