Embed Size (px)
Citation preview
DIESEL MULTIPLE UNITS IN 21ST CENTURY NORTH AMERICA: 1 A COMPARATIVE SURVEY AND EVALUATION OF SERVICES, DEMAND AND 2 COSTS 3 4 5 David O. Nelson, Corresponding Author 6 Jacobs Engineering Group 7 343 Congress Street 8 Boston, Massachusetts 9 Tel: 617-532-4286; Email: [email protected] 10 11 Tara N. Blakey 12 Jacobs Engineering Group 13 3750 NW 87th Ave 14 Miami, Florida 15 Tel: 305-392-2457; Email: [email protected] 16 17 Katherine K. O’Neil 18 Keolis Commuter Service 19 470 Atlantic Avenue 20
Boston, Massachusetts 21 Tel: (617) 222-8054; Email:[email protected] 22 23 24 Word Count: 4,992 words text + 10 tables/figures x 250 words (each) = 7,492 words25 26 27 Submission Date of July 31, 2016 28 Revised November 1, 2016 29
Nelson, Blakey, O'Neil 2
ABSTRACT 30 US officials working with finite resources to build and operate new fixed guideway transit 31 services grow more creative every year, finding ways to offer new and expanded services with 32 fixed or declining resources. One creative approach to the development of new urban passenger 33 rail services has been to operate on tracks shared with light density freight services. Most 34 services have used conventional commuter rail passenger rollingstock for these services, but in 35 some circumstances this relatively heavy equipment has been inappropriate, forcing officials to 36 consider sharing freight tracks with lighter shorter trains. Some of these trains have been 37 conventional electric light rail cars, but since the turn of the 21st century, five new US services 38 have opened using self-powered diesel rail cars (commonly called DMUs) to offer new travel 39 options in Texas, California, New Jersey and Oregon. The Federal Transit Administration (FTA) 40 has termed these new shared track DMU services “Hybrid Rail.” This paper reviews the 41 circumstances and conditions that gave rise to the development of these hybrid DMU systems. It 42 then uses federally reported data to conduct a comparative survey and evaluation of these 43 services compared with electric light rail and conventional commuter rail services. The analysis 44 finds that the new DMU systems tend to function in a new service stratum between commuter 45 and light rail, serving markets that neither traditional mode is well suited to address. 46 47 Keywords: Commuter Rail, Light Rail, DMU, Hybrid Rail, NTD 48
Nelson, Blakey, O'Neil 3
OBJECTIVES 49 In the 15 years between 2001 and 2016, seven new North American rail transit systems have 50 opened using self-powered diesel rail cars (historically called diesel multiple units or DMUs) to 51 provide passenger service on tracks shared with freight trains. These systems synergistically 52 leverage existing freight rail lines to offer new high frequency passenger service in addition to 53 freight services. The new services fill a unique niche between conventional lower frequency 54 commuter rail and higher frequency light rail services. This paper provides an overview of the 55 circumstances giving rise to these services then uses federally reported data on five of these 56 “hybrid rail” DMU services to report on their operations and performance compared with 43 57 existing commuter and light rail systems. The statistical analysis finds that the new hybrid DMU 58 systems fill a unique service stratum between light and commuter railroad services. 59 60 BACKGROUND 61 There are a wide variety of passenger rail transport technologies. Each is designed to deliver 62 different types of services to different markets. Generally, the technologies range along a speed, 63 size and capacity continuum, with long, heavy intercity trains at the fast end of the spectrum to 64 street cars at the short, light and slow end. 65 66 In the US, intercity rail service is generally offered at speeds of 80 (sometimes up to 135) mph 67 with a long string of 50-ton cars propelled by one or more 125-ton locomotives. Commuter and 68 regional rail service uses similar technology to offer shorter trips with more frequent stops. Both 69 intercity and commuter rail generally operate on track shared with freight service moving cargo 70 vehicles weighing up to 143 tons. Trains at this end of the speed and size continuum have 71 priority overall automobiles at roadway crossings. Most highway crossings have gates, bells and 72 flashers that warn motorists of approaching trains. 73 74 Lighter vehicles are used for systems that offer much more frequent service with higher station 75 densities. Rail rapid transit services generally operate at top speeds approaching 60 mph making 76 station stops every 2,500 to 7,500 feet with as few as 3 minutes between trains. Rail rapid transit 77 almost always operates on an exclusive right of way shared with no other services and free from 78 pedestrian and highway crossings. Most services operate trains of six to ten cars. 79 80 Light rail services generally operate at top speeds less than 50 mph using dedicated tracks on 81 surface rights of way. Roads and pedestrians cross the tracks at selected locations. Light rail 82 trains may, or may not, have exclusive priority over automobile traffic. Some crossings can have 83 gates and flashers. Light rail trains may be governed by traffic signals at other crossings. Most 84 services operate two or three-car trains. 85 86 Street car trolley services use lighter cars and use tracks embedded in the pavement of streets 87 shared with automobile traffic. Speeds seldom exceed 25 mph; traffic is generally controlled by 88 traffic lights. Most trolleys operate single car trains. 89 90 In North America, “hybrid rail” systems have been emerging since the start of the 21st century 91 using short DMU trains to offer urban services on tracks shared with freight trains. The new 92 services offer economies by sharing track with pre-existing freight services and by avoiding the 93 expense of building and maintaining electric catenary systems. 94
Nelson, Blakey, O'Neil 4
95 Passenger Safety 96 Each of the various rail transport technologies have well developed regimes to ensure passenger 97 safety. North American services where passenger trains share tracks with freight operations are 98 regulated by the Federal Railroad Administration (FRA) and Transport Canada. Both use safety 99 parameters focused on both crashworthiness and collision-avoidance. Their operating paradigm 100 is commonly called the “conventional railroad” or the “general railroad system”. Under FRA 's 101 crashworthiness standards cars operating on the conventional railroad, must provide “buff 102 strength” that withstands 800,000 pounds of pressure without permanent deformation, 103 Passengers are presumed protected if the vehicle rigidly resist impacts. Compliant cars are 104 relatively bulky and heavy due to the weight of their structure. 105 106 Rail rapid transit, light rail and street cars have not been historically subject to federal safety 107 regulation. Subject to state regulations, they have developed similar tools to avoid and survive 108 vehicle collisions. Since these trains are generally lighter, slower and shorter and do not share 109 track with heavy freight trains the structural crashworthiness standards can be lower. 110 111 In recent years, manufacturers of lighter cars for the European and Asian passenger markets have 112 been focusing on crash-energy management (CEM) technology to improve safety in the event of 113 a collision. The new CEM trains, many of which are too lightly built for North American 114 conventional railway standards, are proving to offer occupant safety equivalent to, or greater 115 than, that offered by standards focusing on “buff strength” (1). In the US, CEM is presently 116 gaining currency for commuter and intercity rail rollingstock. 117 118 Shared Corridor and Shared Track Services 119 As interest in expanding passenger rail services has grown across the US and around the world, 120 planners have found existing freight rail corridors to be attractive locations for new passenger 121 rail services. With the evolution of US freight railroad operations (greater concentration on a 122 few main lines and less intensive use of branch lines) many urban corridors have capacity for a 123 new passenger rail service operating in synergy with freight operations. 124 125 Various concepts of operation have developed in the last three decades to meet the safety, 126 infrastructure and service requirements of passenger and freight operators in these “shared use” 127 corridors. Many new shared track passenger operations used conventional commuter railroad 128 equipment fully compliant with FRA regulations. In these cases, there are no restrictions on 129 sharing track with freight operations. But in other cases, circumstances have favored lighter rail 130 vehicles that do not comply with FRA standards. Here elaborate safeguards are required to 131 eliminate opportunities for collision between the two classes of vehicles. There are several 132 reasons to consider lighter vehicles: 133 134 Urban street running on part of the route, requiring an ability to negotiate very sharp curves 135
and operate with short stopping distances. 136 Service integration allowing the same train that collects passengers on a suburban line-haul 137
rail corridor to also deliver them to urban destinations by running on city streets. 138 Service designs that require the operation of frequent short trains. Conventional rail 139
equipment is not well suited for operation in short trains with frequent short station stops. 140
Nelson, Blakey, O'Neil 5
Greater community acceptance of lighter, shorter trains making less noise and emissions as 141 they run through residential neighborhoods. 142
Ability to economically meet “level-boarding” stipulations of the Americans with Disabilities 143 Act. The lighter cars have generally lower floors that allow level boarding to and from 144 passenger platforms. The high floor FRA compliant cars require high platforms that pose 145 potential conflict with freight operations 146
147 San Diego was the first modern US system to share track, operating electric light rail cars on 148 track shared with a lightly used freight branch line. The service, opened in 1981, ran 13 miles 149 southward from downtown San Diego. The service shares a very lightly used freight branch line 150 that had been purchased by the local government and rehabilitated for shared track joint use. At 151 the time of its implementation, federal safety regulation was less stringent (2, 7, 8). No formal 152 waiver of federal regulations was required or sought. Years later, the FRA required the agency to 153 apply for a formal waiver. 154 155 In the ensuing decade, no similar US systems were built, but planners considered the San Diego 156 model to save money by sharing track with freight operations. 157 158 Overseas during this same period, European transit officials developed systems where various 159 types of passenger and freight trains shared suburban tracks to extend local tram systems outside 160 the city core. The most renowned of these synergistic systems was the Karlsruhe Stadtbahn 161 which combined street railway lines in the city of Karlsruhe with railway lines in the surrounding 162 countryside to directly serve the entire region. By the early 90’s Karlsruhe had seized the 163 imagination of US planners and transit officials, leading to the landmark study “Joint Operations 164 of Light Rail Transit or Diesel Multiple Unit Vehicles with Railroads” (2). The study focused on 165 the North American feasibility of shared track between railroads (typically locomotive-hauled 166 trains) and rail transit (light rail cars, etc.). By this time, US planners were not just interested in 167 electric light rail operations, but were interested in further economies possible from running 168 “cordless light rail” services using one or two car DMU trains with light European designs. 169 Diesel traction obviated the need for overhead wire for motive power, further reducing costs for 170 construction and maintenance. 171 172 DMUs had a brief heyday in the US during the early 1950’s just before the post-war demise of 173 US passenger rail service during the automotive boom. The Boston and Maine and the New 174 Haven railroads both invested in large fleets of Rail Diesel Cars (RDCs) built by Philadelphia’s 175 Budd Company. They used the new technology extensively on their suburban and regional 176 networks to replace steam locomotive services. Other railroads experimented with RDCs for 177 their light density services. But by the 1960’s, with the rise of the interstate highway system and 178 increasing use of private automobiles, most of these services were abandoned. Today all the 179 remaining services that had been run with RDCs are now run with diesel locomotive hauled 180 push-pull rollingstock. 181 182 The mid 1970’s brought the first “Energy Crisis” and rising disaffection with urban extensions of 183 the interstate highway network, leading to increased interest in reviving US urban rail transit 184 networks. In the ensuing years, commuter rail services sharing track with freight service have 185 been created in ten US cities that had no previous commuter railroad services. In other cities 186
Nelson, Blakey, O'Neil 6
facing different circumstances, locomotive hauled push-pull commuter rail service was clearly 187 not the appropriate solution. In some of those instances planners, influenced by the track sharing 188 that made San Diego’s system possible and inspired by Karlsruhe, pursued projects that would 189 put electric light rail or light diesel multiple units on urban and suburban tracks shared with light 190 density local freight services. Federal agencies funded several more influential studies to 191 evaluate the safety implications and to support the planning efforts (3,7,8). 192 193 Electric light rail transit services on tracks shared with freight trains were expanded in San Diego 194 and were integral to the light rail system opened to the support Salt Lake’s 2002 Winter 195 Olympics. In 2000, a very short extension of the Newark City Subway light rail network opened 196 sharing track with local freight deliveries. 197 198 Seven North American services using DMU’s on track shared with low density freight services 199 were developed between 2001 and 2016. 200 201 Trillium Line - In 2001, Ottawa opened a 5-mile DMU service on track shared with local 202
freight services. The Trillium Line uses a fleet of 3 two-car trains manufactured in France to 203 carry approximately 10,000 passengers on 180 trips each weekday. 204
RiverLINE–In 2004, New Jersey Transit opened a 34-mile line operated on 20 route miles 205 of track shared with local freight trains. The RiverLINE uses a fleet of 21 light DMU’s 206 manufactured in Switzerland to serve nearly 10,000 boardings on 105 trains each weekday 207 between 17 stations. In addition to sharing tracks with local freight trains it also circulates 208 the streets of downtown Camden like a street car. 209
Sprinter - In 2008, the North County Transit District in California opened a DMU service 210 operating over 19 route miles of track shared with local freight trains. The Sprinter carries 211 8,500 passengers on a typical weekday with a fleet of 6 two-car German designed trains 212 making 66 weekday trips. 213
Westside Express (WES) – In 2009, Portland Oregon’s TriMet opened a DMU service on 214 15 route miles of track shared with local freight. WES uses a fleet of six vehicles of US 215 design and manufacture that comply with all FRA standards, to carry approximately 1,700 216 passengers on 32 weekday trains. 217
Capital MetroRail – In 2010, the Capital Metro in Austin, Texas opened a 32-mile DMU 218 service network including 27 miles shared with freight services. MetroRail operates a fleet 219 of six single-car Swiss trains to carry ~2,500 passengers each weekday. MetroRail operates 220 for more than a mile of street-running in downtown Austin. 221
A-Train – In 2011, the Denton County Transit Authority opened a 21-mile DMU service 222 sharing 14 miles with local freight trains. The A-Train operates a fleet of 11 Swiss rail cars 223 to carry ~2,000 passengers on 60 weekday trains. 224
UP Express – In 2105, Toronto opened a new airport to downtown service making the 15-225 mile trip in 25 minutes making two intermediate stops. The service operates 18 Japanese 226 DMUs designed to FRA standards. Most of the route is shared with freight and push-pull 227 commuter trains. 228
229 Five of these new systems, use European rollingstock that does not meet FRA standards for 230 unrestricted use on the conventional railroad system. These “non-compliant” systems all 231 required waivers from the FRA. The waivers focused extensively on preventing and mitigating 232
Nelson, Blakey, O'Neil 7
collisions between freight trains and the new DMU’s. Most operate under a strict regime of 233 temporal separation between the two classes of transit with freight service limited to overnight 234 windows of operation. 235 236 The A-Train’s 2011 waiver was facilitated by a prospective shift in federal regulations 237 recognizing that many lighter vehicles from overseas, by virtue of the extensive CEM capacity 238 inherent in their designs, offer equivalent safety to FRA compliant rollingstock. In 2011, it 239 appeared that full Federal recognition of “alternative compliance” was imminent (1,8). During 240 the ensuing five years, the federal “rulemaking” process has proceeded more slowly than 241 expected, but it’s understood that a Notice of Proposed Rulemaking is planned for 2017. (In 242 2016, it seems that the collision avoidance provided by the 2008 national mandate for Positive 243 Train Control (PTC) may facilitate acceptance of light DMU services on shared track but the 244 literature and industry have been generally silent on this prospect.) 245 246 DMU PASSENGER SERVICES: HYBRID RAIL 247 These seven North American shared track DMU systems represent an emerging hybrid between 248 light rail and commuter rail investments (8). These systems combine light rail service 249 frequencies with the commuter rail cost economies available from diesel propulsion and shared 250 use of existing railway infrastructure. On some of these systems, the shared track vehicle 251 provides a one-seat ride for many more passenger trips to the downtown since it circulates on 252 downtown streets as a light rail car. This attractive service feature is not available with 253 commuter rail. This ‘hybrid’ mode is available in corridors where an existing rail line has freight 254 traffic densities that are amenable with a shared track operation. Where a railroad line exists 255 along a corridor with a sustained density of urban development that is higher than typical for a 256 commuter rail service, it is clearly possible to introduce a high frequency rail service that mimics 257 the service quality of a light rail project, with capital cost characteristics more like commuter 258 rail. 259 260 After five or more years of operation, comparable data on the five US DMU systems (excluding, 261 Ontario’s Trillium Line and UP-Express services) are now available from the FTA’s National 262 Transit Database (NTD). The balance of this paper explores that data to see how these new 263 hybrid systems compare to established light rail and commuter rail services in the US urban 264 transportation milieu. 265 266 The NTD is a reporting structure for transit agencies receiving FTA funding. It serves as a 267 common repository for many valuable US transit data vectors and statistics. Data collected and 268 stored by the NTD include service statistics (including route mile, fleet size, track miles, stations 269 and revenue train miles), demand data (boardings and passenger miles) and cost information 270 (including costs for transport services and mechanical maintenance). Key NTD information for 271 each of the five systems is summarized in Table 1. 272 273 274
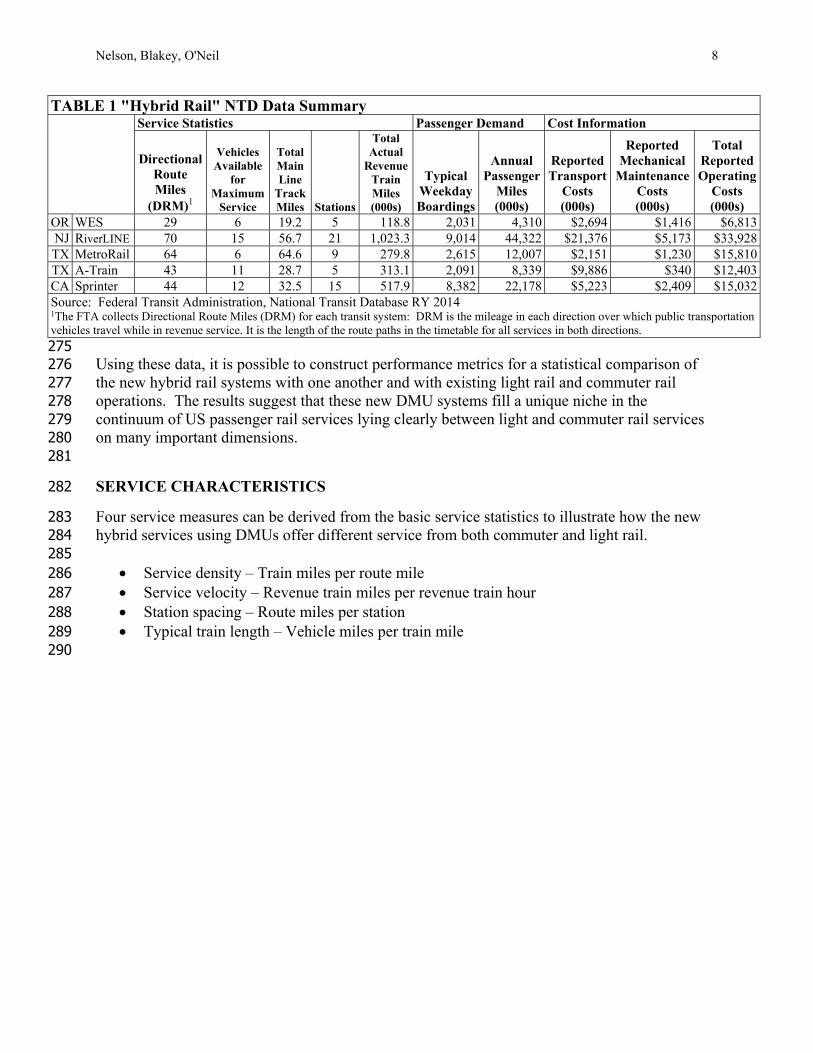
Nelson, Blakey, O'Neil 8
TABLE 1 "Hybrid Rail" NTD Data Summary Service Statistics Passenger Demand Cost Information
Directional Route Miles
(DRM)1
Vehicles Available
for Maximum
Service
Total Main Line
Track Miles Stations
Total Actual
Revenue Train Miles (000s)
Typical Weekday Boardings
Annual Passenger
Miles (000s)
Reported Transport
Costs (000s)
Reported Mechanical
Maintenance Costs (000s)
Total Reported Operating
Costs (000s)
OR WES 29 6 19.2 5 118.8 2,031 4,310 $2,694 $1,416 $6,813NJ RiverLINE 70 15 56.7 21 1,023.3 9,014 44,322 $21,376 $5,173 $33,928TX MetroRail 64 6 64.6 9 279.8 2,615 12,007 $2,151 $1,230 $15,810TX A-Train 43 11 28.7 5 313.1 2,091 8,339 $9,886 $340 $12,403CA Sprinter 44 12 32.5 15 517.9 8,382 22,178 $5,223 $2,409 $15,032Source: Federal Transit Administration, National Transit Database RY 2014 1The FTA collects Directional Route Miles (DRM) for each transit system: DRM is the mileage in each direction over which public transportation vehicles travel while in revenue service. It is the length of the route paths in the timetable for all services in both directions.
275 Using these data, it is possible to construct performance metrics for a statistical comparison of 276 the new hybrid rail systems with one another and with existing light rail and commuter rail 277 operations. The results suggest that these new DMU systems fill a unique niche in the 278 continuum of US passenger rail services lying clearly between light and commuter rail services 279 on many important dimensions. 280 281
SERVICE CHARACTERISTICS 282
Four service measures can be derived from the basic service statistics to illustrate how the new 283 hybrid services using DMUs offer different service from both commuter and light rail. 284 285
Service density – Train miles per route mile 286 Service velocity – Revenue train miles per revenue train hour 287 Station spacing – Route miles per station 288 Typical train length – Vehicle miles per train mile 289
290
Nelson, Blakey, O'Neil 9
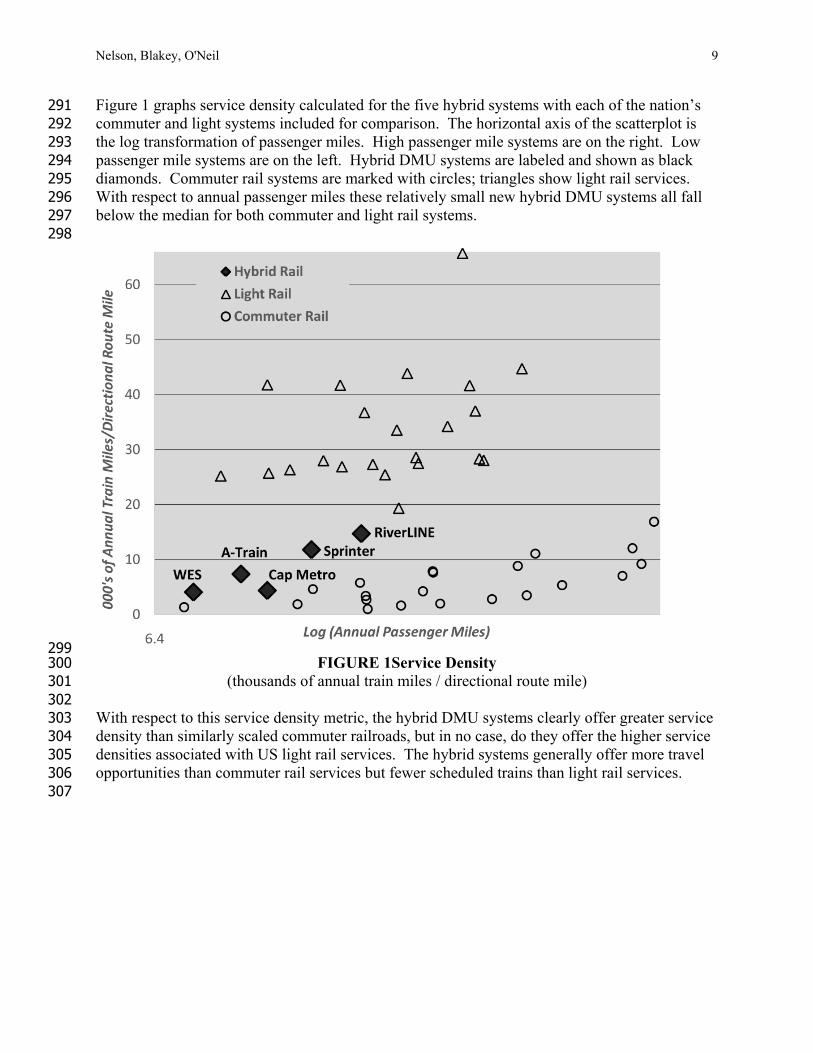
Figure 1 graphs service density calculated for the five hybrid systems with each of the nation’s 291 commuter and light systems included for comparison. The horizontal axis of the scatterplot is 292 the log transformation of passenger miles. High passenger mile systems are on the right. Low 293 passenger mile systems are on the left. Hybrid DMU systems are labeled and shown as black 294 diamonds. Commuter rail systems are marked with circles; triangles show light rail services. 295 With respect to annual passenger miles these relatively small new hybrid DMU systems all fall 296 below the median for both commuter and light rail systems. 297 298
299 FIGURE 1Service Density 300
(thousands of annual train miles / directional route mile) 301 302 With respect to this service density metric, the hybrid DMU systems clearly offer greater service 303 density than similarly scaled commuter railroads, but in no case, do they offer the higher service 304 densities associated with US light rail services. The hybrid systems generally offer more travel 305 opportunities than commuter rail services but fewer scheduled trains than light rail services. 306 307
Nelson, Blakey, O'Neil 10
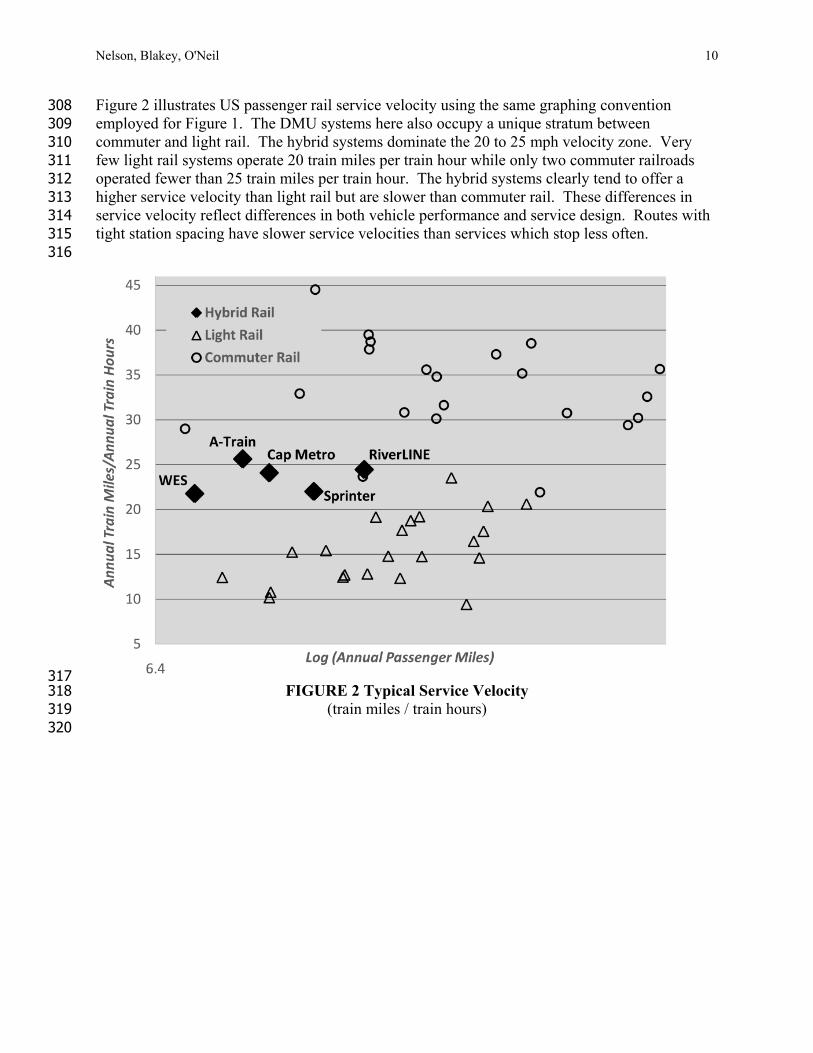
Figure 2 illustrates US passenger rail service velocity using the same graphing convention 308 employed for Figure 1. The DMU systems here also occupy a unique stratum between 309 commuter and light rail. The hybrid systems dominate the 20 to 25 mph velocity zone. Very 310 few light rail systems operate 20 train miles per train hour while only two commuter railroads 311 operated fewer than 25 train miles per train hour. The hybrid systems clearly tend to offer a 312 higher service velocity than light rail but are slower than commuter rail. These differences in 313 service velocity reflect differences in both vehicle performance and service design. Routes with 314 tight station spacing have slower service velocities than services which stop less often. 315 316
317 FIGURE 2 Typical Service Velocity 318
(train miles / train hours) 319 320
Nelson, Blakey, O'Neil 11
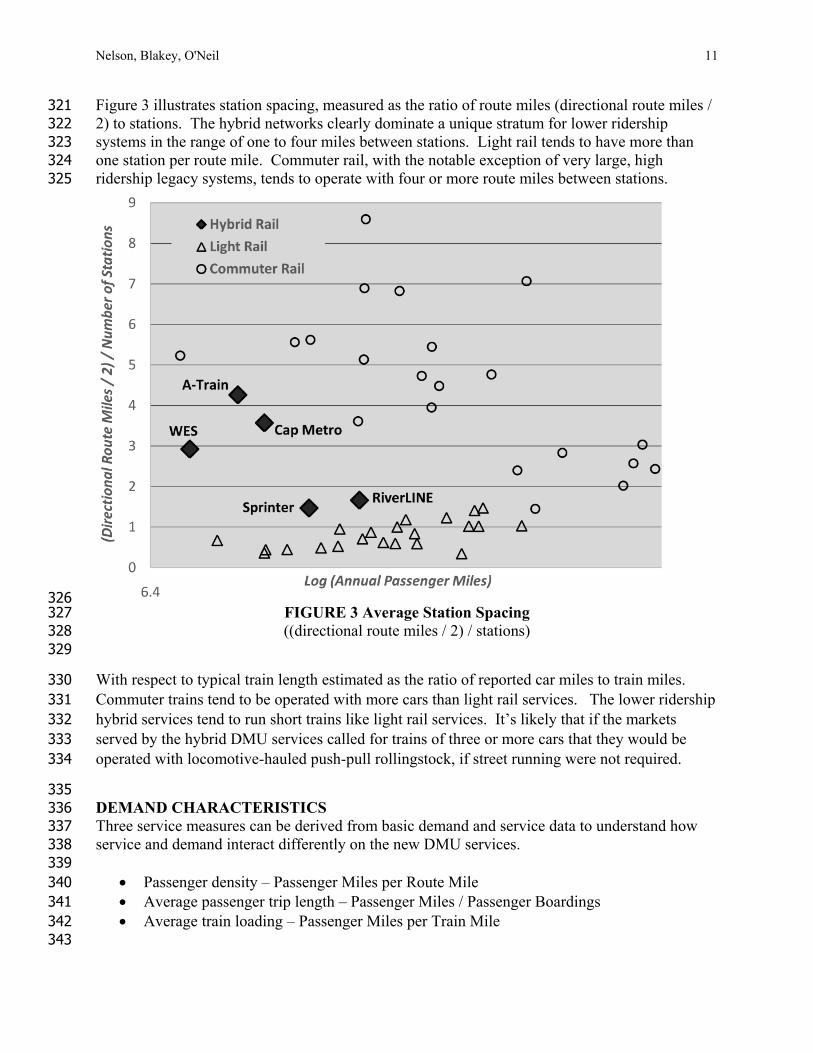
Figure 3 illustrates station spacing, measured as the ratio of route miles (directional route miles / 321 2) to stations. The hybrid networks clearly dominate a unique stratum for lower ridership 322 systems in the range of one to four miles between stations. Light rail tends to have more than 323 one station per route mile. Commuter rail, with the notable exception of very large, high 324 ridership legacy systems, tends to operate with four or more route miles between stations. 325
326 FIGURE 3 Average Station Spacing 327 ((directional route miles / 2) / stations) 328
329
With respect to typical train length estimated as the ratio of reported car miles to train miles. 330 Commuter trains tend to be operated with more cars than light rail services. The lower ridership 331 hybrid services tend to run short trains like light rail services. It’s likely that if the markets 332 served by the hybrid DMU services called for trains of three or more cars that they would be 333 operated with locomotive-hauled push-pull rollingstock, if street running were not required. 334
335 DEMAND CHARACTERISTICS 336 Three service measures can be derived from basic demand and service data to understand how 337 service and demand interact differently on the new DMU services. 338 339
Passenger density – Passenger Miles per Route Mile 340 Average passenger trip length – Passenger Miles / Passenger Boardings 341 Average train loading – Passenger Miles per Train Mile 342
343
Nelson, Blakey, O'Neil 12
Figure 4 shows that the DMU services attract passenger densities below nearly all light rail 344 systems. Instead their passenger densities are more comparable to the smaller commuter rail 345 enterprises. As these services mature it is certainly hoped that their passenger densities will rise 346 with the development of the environs surrounding their stations. 347
348 FIGURE 4 Passenger Density 349
(millions of annual passenger miles / directional route mile) 350 351
Nelson, Blakey, O'Neil 13
Figure 5 shows average passenger trip length. Average trip length for commuter railroads tends 352 to be 20+ miles. No US light rail network reports average trip lengths longer than ten miles. 353 The hybrid DMU systems clearly service a stratum between the two modes with typical trip 354 lengths in range of ten to 15 miles per passenger. 355
356 FIGURE 5 Average passenger trip distance 357
(passenger miles / passenger boardings) 358
Nelson, Blakey, O'Neil 14
Figure 6 plots typical train loadings measured by the ratio of passenger miles to train miles. 359 Typical train loadings for nearly all commuter railroads exceed 100 passengers. Typical 360 passenger loads for the light rail systems tend to be 50. The hybrid systems with short trains also 361 tend to average 50 passenger miles per train mile. 362
363 FIGURE 6 Average Train Loading 364
(passenger miles / train miles) 365 366 COST CHARACTERISTICS 367 Three cost measures can be derived from the basic financial, demand and service data to 368 understand how the financial performance of the new DMU hybrid services compares with other 369 passenger rail modes. 370 371
Transportation Operations Cost per Train Mile 372 Mechanical Maintenance Expense per Vehicle Mile 373 Total Operating Expense per Train Mile 374
375 376
Nelson, Blakey, O'Neil 15
Figure 7 plots the reported transport operating costs (crews, fuel, and train supervision) on a train 377 mile basis. Transport costs for the DMU services generally range between $10 and $20 per train 378 mile (The $30 per train mile for the A-Train should probably be discounted as a reporting error.). 379 Costs in the range of $10 to $20 per train mile are well below nearly all the reported costs for 380 commuter rail services. The DMU transport costs are generally in line with transport costs for 381 light rail. 382
383 FIGURE 7 Reported Train Operating Cost / Train Mile 384
385 386
Nelson, Blakey, O'Neil 16
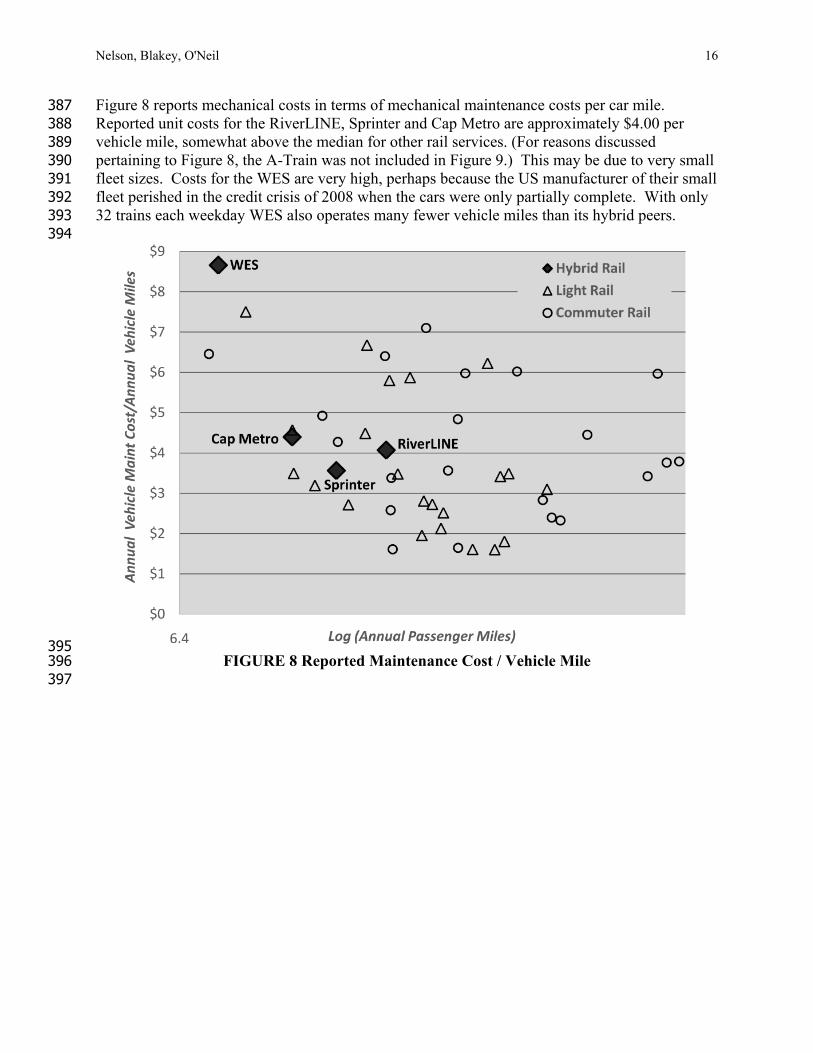
Figure 8 reports mechanical costs in terms of mechanical maintenance costs per car mile. 387 Reported unit costs for the RiverLINE, Sprinter and Cap Metro are approximately $4.00 per 388 vehicle mile, somewhat above the median for other rail services. (For reasons discussed 389 pertaining to Figure 8, the A-Train was not included in Figure 9.) This may be due to very small 390 fleet sizes. Costs for the WES are very high, perhaps because the US manufacturer of their small 391 fleet perished in the credit crisis of 2008 when the cars were only partially complete. With only 392 32 trains each weekday WES also operates many fewer vehicle miles than its hybrid peers. 393 394
395 FIGURE 8 Reported Maintenance Cost / Vehicle Mile 396
397
Nelson, Blakey, O'Neil 17
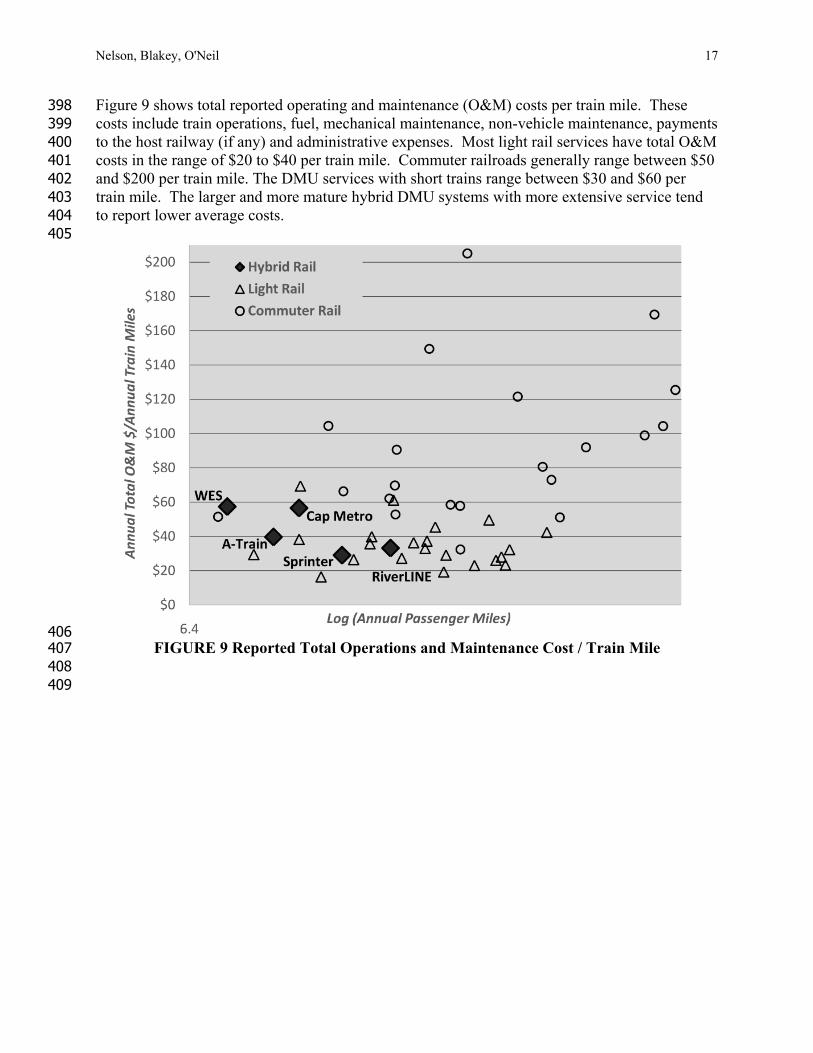
Figure 9 shows total reported operating and maintenance (O&M) costs per train mile. These 398 costs include train operations, fuel, mechanical maintenance, non-vehicle maintenance, payments 399 to the host railway (if any) and administrative expenses. Most light rail services have total O&M 400 costs in the range of $20 to $40 per train mile. Commuter railroads generally range between $50 401 and $200 per train mile. The DMU services with short trains range between $30 and $60 per 402 train mile. The larger and more mature hybrid DMU systems with more extensive service tend 403 to report lower average costs. 404 405
406 FIGURE 9 Reported Total Operations and Maintenance Cost / Train Mile 407
408 409
Nelson, Blakey, O'Neil 18
SUMMARY AND CONCLUSIONS 410 The review of the five new US hybrid DMU systems compared the service, demand and cost 411 characteristics of this service mode with traditional commuter and light rail. 412 413 1. Service Characteristics- The hybrid DMU systems offer more frequent service with greater 414
station density than traditional commuter rail and less frequent service with lower station 415 density compared to light rail. 416 417
2. Demand Characteristics – Demand for these new hybrid DMU services is consistent with 418 their service characteristics. As the hybrid DMU systems offer less frequent service with 419 lower station density than light rail, the hybrid systems attract fewer passengers who travel 420 longer distances compared with light rail riders. Compared with commuter rail, the hybrid 421 DMU passengers take shorter trips at a density that is consistent with the smaller commuter 422 railroads. As these new services mature their passenger densities might rise with increase 423 development surrounding their stations. 424 425
3. Cost Characteristics –In terms of the total O&M costs per train mile, the hybrid DMU 426 services with short trains range between $30 and $60 per train mile while the larger and more 427 mature hybrid DMU systems tend to have lower average costs. Most light rail services 428 operate at $20 to $40 per train mile. Commuter railroads tend to range between $50 and 429 $200. 430 431 While the emerging hybrid DMU services exhibit direct train operating costs generally 432 comparable to light rail services and below nearly all commuter rail services, the reported 433 mechanical unit costs are somewhat above the median for commuter rail and light rail 434 services. This greater unit cost may reflect their small fleet sizes, however, it highlights that 435 the current differences in total O&M per train mile are attributable to operational savings as 436 opposed to maintenance costs. 437 438
The analysis finds that the new hybrid DMU systems tend to function in a new service stratum 439 between commuter and light rail serving markets that neither traditional mode is well suited to 440 address. Combined with relatively low operating costs, the infrastructure sharing features and 441 higher density service offerings associated with DMUs makes them a unique and attractive 442 technology for some new passenger rail services. In the future, advances in the coverage of 443 Positive Train Control and greater acceptance of CEM may increase the number of potential 444 applications for this emerging mode. 445
Nelson, Blakey, O'Neil 19
446
REFERENCES 1. U.S. Department of Transportation Federal Railroad Administration. Technical
Criteria and Procedures for Evaluating the Crashworthiness and Occupant Protection Performance of Alternatively Designed Passenger Rail Equipment for Use in Tier I Service. Office of Railroad Policy and Development Office of Safety, Washington, D.C., 2011.
2. Phraner, S. D., R. T. Roberts, P. K. Stangas, K. A. Korach, J. H. Shortreed, and G. J. Thompson. Transit Cooperative Research Program Report 52, Joint Operation of Light Rail Transit or Diesel Multiple Unit Vehicles with Railroads. Transportation Research Board of the National Academies, Washington, D.C., 1999. Bing, A. J., T. Tsai, D. O. Nelson, and R. A. Mayville. Safety of Noncompliant Passenger Rail Equipment. In Transportation Research Circular E-C112. Transportation Research Board of the National Academies, Washington, D.C., 2007.
3. Lu, A., and D. O. Nelson. Business Case for Shared-Track Operations. Presented at TRB Session 613 (P07-0663), Recent Investigations into Shared Railroad Corridors and Facilities, 2007.
4. Lu, A., and D. O. Nelson. Shared Track in North America. Presented at TRB Session 613 (P07-0663), Recent Investigations into Shared Railroad Corridors and Facilities, 2007.
5. Booz Allen Hamilton, Jacobs-Edwards &Kelcey, ICF Consulting, and New Jersey Institute of Technology. Transit Cooperative Research Program Report 130, Shared Use of Railroad Infrastructure with Noncompliant Public Transit Rail Vehicles: A Practitioner's Guide. Transportation Research Board of the National Academies, Washington, D.C., 2009.
6. Bing, A., E. W. Beshers, M. Chavez, D. P. Simpson, E. S. Horowitz, and W. E. Zullig. National Cooperative Highway Research Program Report 657: Guidebook for Implementing Passenger Rail Service on Shared Passenger and Freight Corridors. Transportation Research Board of the National Academies, Washington, D.C., 2010.
7. FRA issues alternative-design vehicle waiver to Denton County Transportation Authority. Progressive Railroading, June 2012. http://www.progressiverailroading.com/passenger_rail/article/FRA-issues-alternative-design- vehicle-waiver-to-Denton-County-Transportation-Authority--31230. Accessed July 28, 2016.
8. ENSCO, Inc, ICFConsulting, Edwards&Kelcey, Booz Allen and Hamilton and New Jersey Institute of Technology ITS Technologies for Integrated Rail Corridors Volumes 1, 2 and 3US DOT, Federal Railroad Administration, Office of Research & Development Washington, DC 20590November 1, 2006