Embed Size (px)
Citation preview

1
Demand for Health Insurance
2
Which Investment will you pick
Expected Value
$2600
$2600Choice 2
$5000
-$1000
0.6
0.4
Choice 1
$5000
$1000
0.4
0.6
3
Attitude towards risk
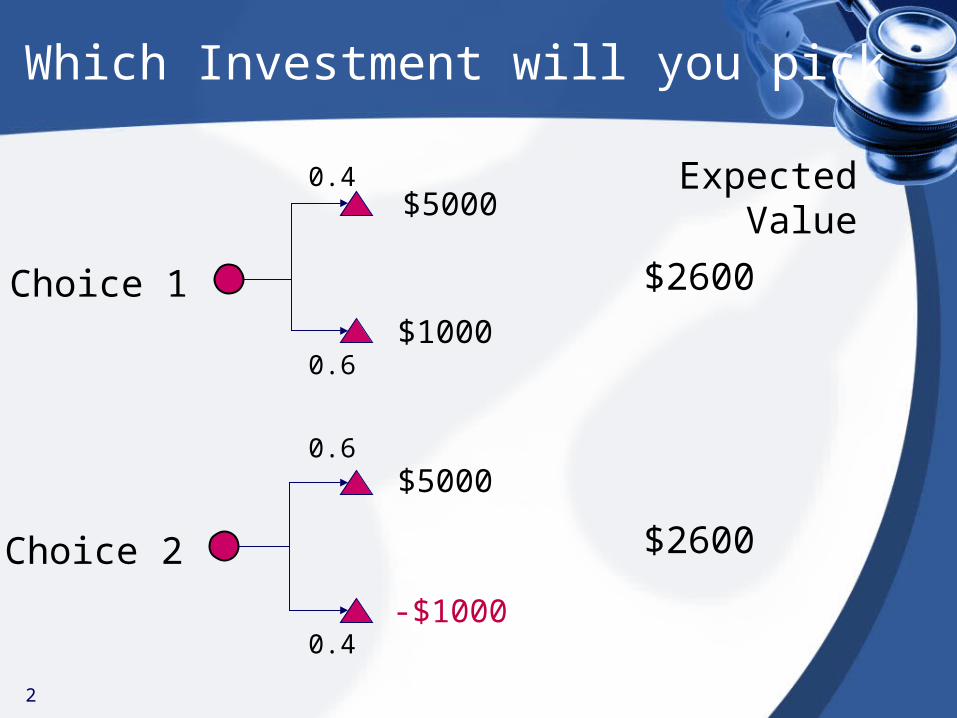
• In the absence of any objective criteria, how an individual or organization deals with uncertainty depends ultimately on their attitude towards risk and whether they are risk averse, risk neutral or a risk taker.
4
Attitude towards risk
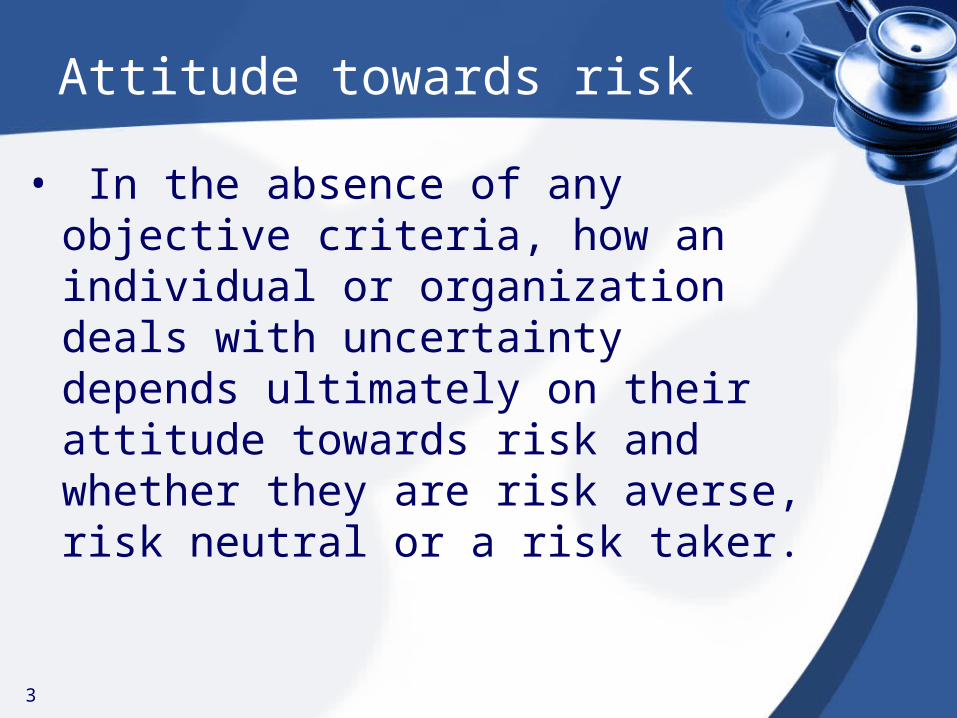
• Someone who would prefer, for example, the certainty of $1,000 rather than a 50% probability of $3,000.
• Someone who is indifferent, for example, between the certainty of $1,000 rather than a 50% probability of $2,000.
• Someone who would prefer, for example, the 50% probability of $5,000 rather than the certainty of $3,000.
Risk averse
Risk neutral
Risk taker
5
Different Approaches to Risk:
• Expected Value
• Maximin
• Maximax
• Hurwicz alpha index rule

6
Payoff Matrix
First Choice
Probability 0.2 0.7 0.1
Payoff -1000 1000 10,000
Second Choice
Probability 0.1 0.6 0.3
Payoff 0 1000 3,000
2 Choices for investment:
7
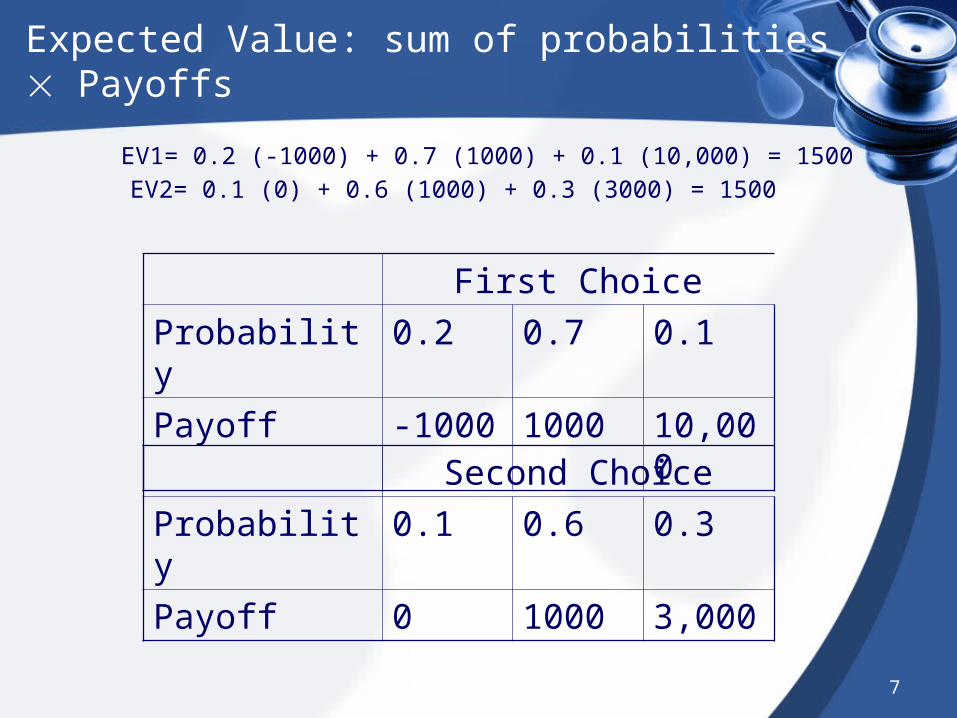
Expected Value: sum of probabilities Payoffs
First Choice
Probability 0.2 0.7 0.1
Payoff -1000 1000 10,000
Second Choice
Probability 0.1 0.6 0.3
Payoff 0 1000 3,000
EV1= 0.2 (-1000) + 0.7 (1000) + 0.1 (10,000) = 1500
EV2= 0.1 (0) + 0.6 (1000) + 0.3 (3000) = 1500
8
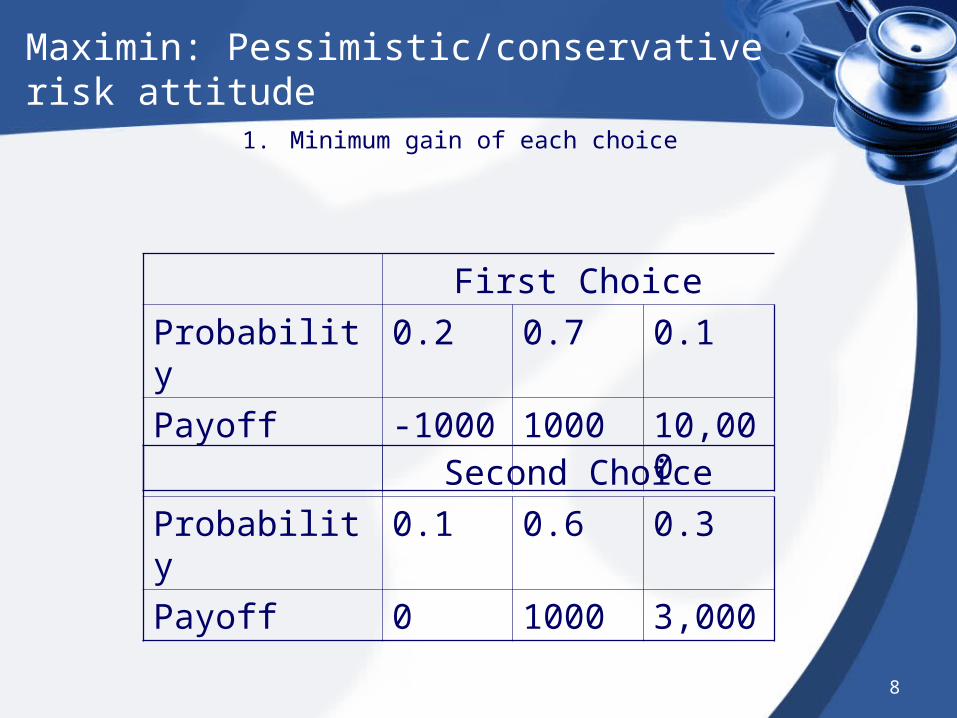
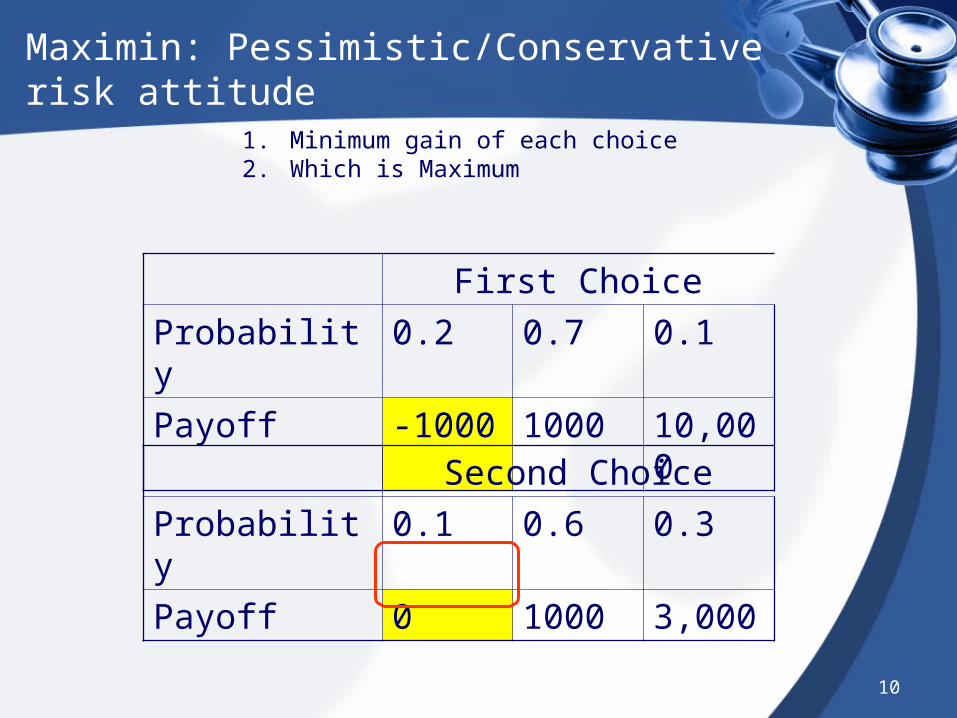
Maximin: Pessimistic/conservative risk attitude
First Choice
Probability 0.2 0.7 0.1
Payoff -1000 1000 10,000
Second Choice
Probability 0.1 0.6 0.3
Payoff 0 1000 3,000
1. Minimum gain of each choice
9
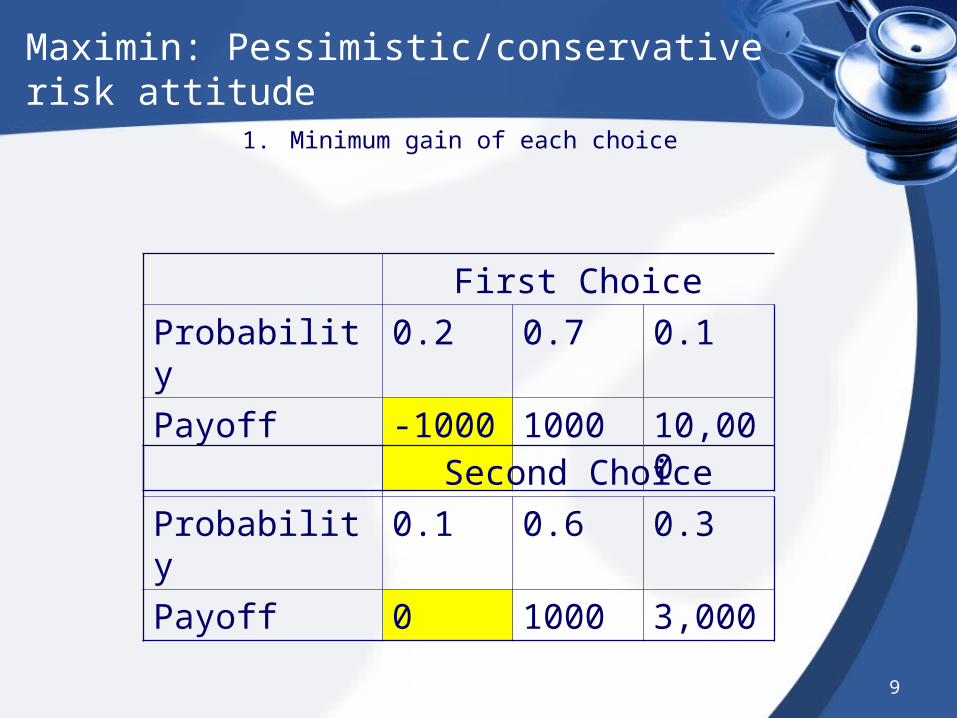
Maximin: Pessimistic/conservative risk attitude
First Choice
Probability 0.2 0.7 0.1
Payoff -1000 1000 10,000
Second Choice
Probability 0.1 0.6 0.3
Payoff 0 1000 3,000
1. Minimum gain of each choice
10
Maximin: Pessimistic/Conservative risk attitude
First Choice
Probability 0.2 0.7 0.1
Payoff -1000 1000 10,000
Second Choice
Probability 0.1 0.6 0.3
Payoff 0 1000 3,000
1. Minimum gain of each choice2. Which is Maximum

11
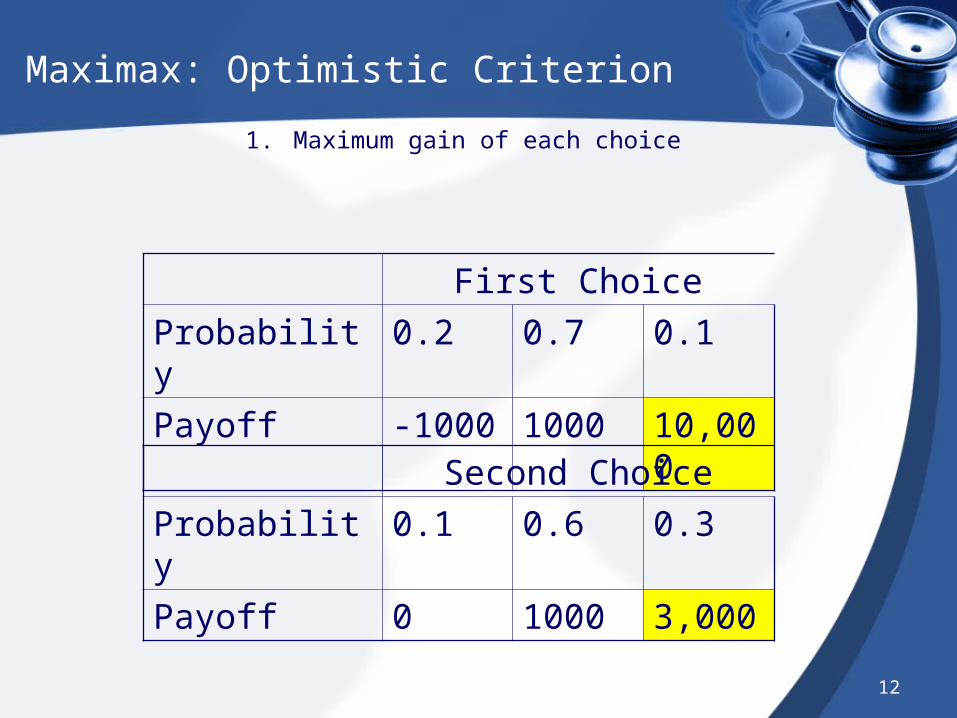
Maximax: Optimistic Criterion
First Choice
Probability 0.2 0.7 0.1
Payoff -1000 1000 10,000
Second Choice
Probability 0.1 0.6 0.3
Payoff 0 1000 3,000
1. Maximum gain of each choice
12
Maximax: Optimistic Criterion
First Choice
Probability 0.2 0.7 0.1
Payoff -1000 1000 10,000
Second Choice
Probability 0.1 0.6 0.3
Payoff 0 1000 3,000
1. Maximum gain of each choice
13
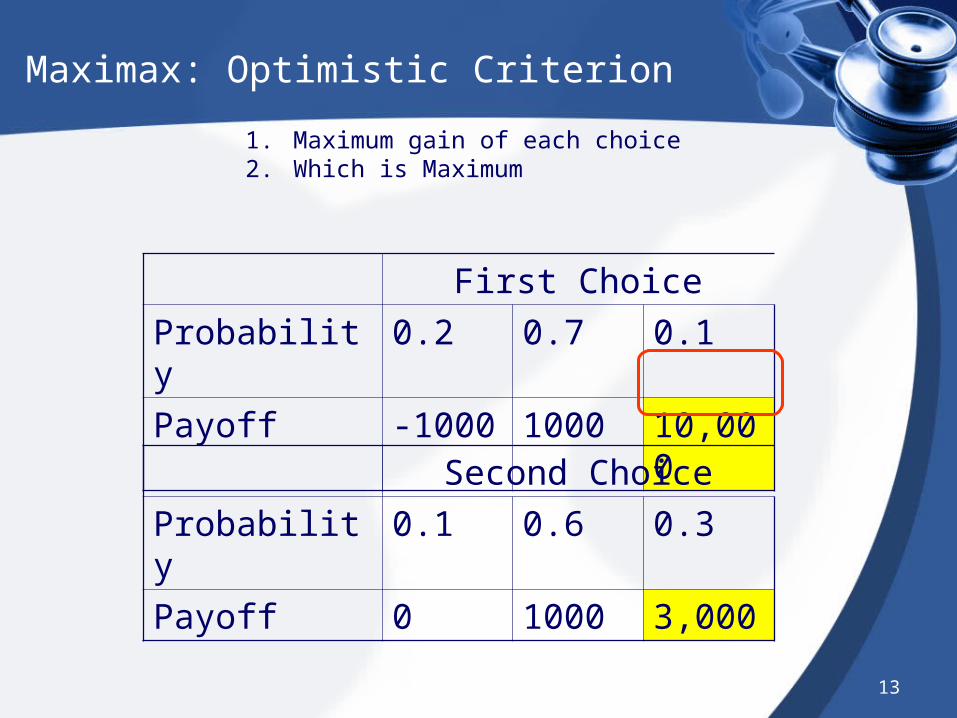
Maximax: Optimistic Criterion
First Choice
Probability 0.2 0.7 0.1
Payoff -1000 1000 10,000
Second Choice
Probability 0.1 0.6 0.3
Payoff 0 1000 3,000
1. Maximum gain of each choice2. Which is Maximum
14
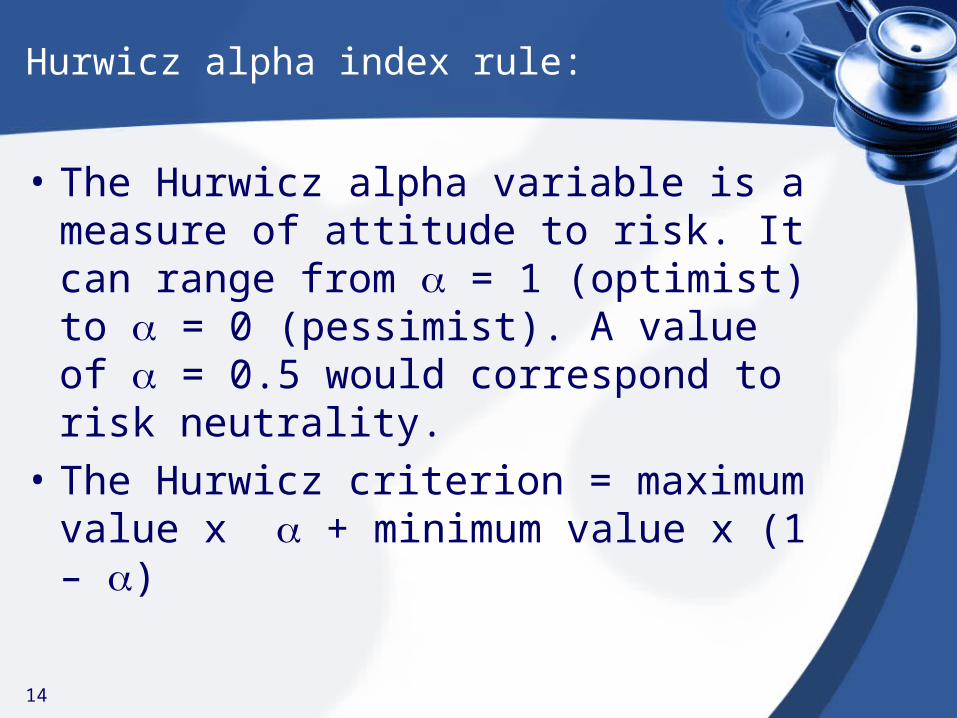
Hurwicz alpha index rule:
• The Hurwicz alpha variable is a measure of attitude to risk. It can range from = 1 (optimist) to = 0 (pessimist). A value of = 0.5 would correspond to risk neutrality.
• The Hurwicz criterion = maximum value x + minimum value x (1 – )
15
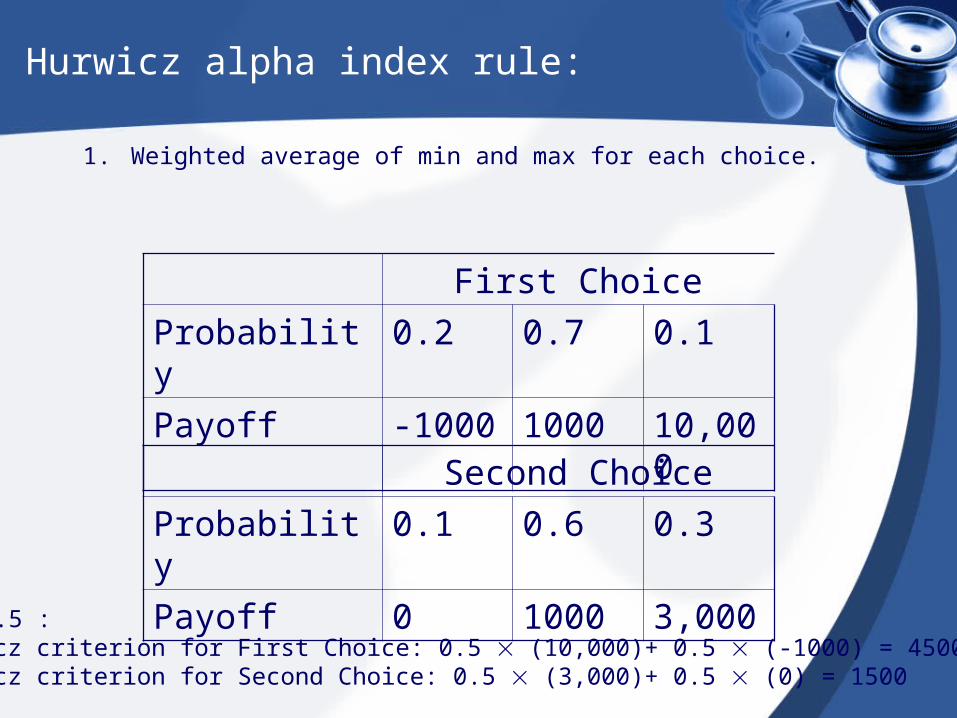
Hurwicz alpha index rule:
First Choice
Probability 0.2 0.7 0.1
Payoff -1000 1000 10,000
Second Choice
Probability 0.1 0.6 0.3
Payoff 0 1000 3,000
1. Weighted average of min and max for each choice.
For = 0.5 :The Hurwicz criterion for First Choice: 0.5 (10,000)+ 0.5 (-1000) = 4500The Hurwicz criterion for Second Choice: 0.5 (3,000)+ 0.5 (0) = 1500
16
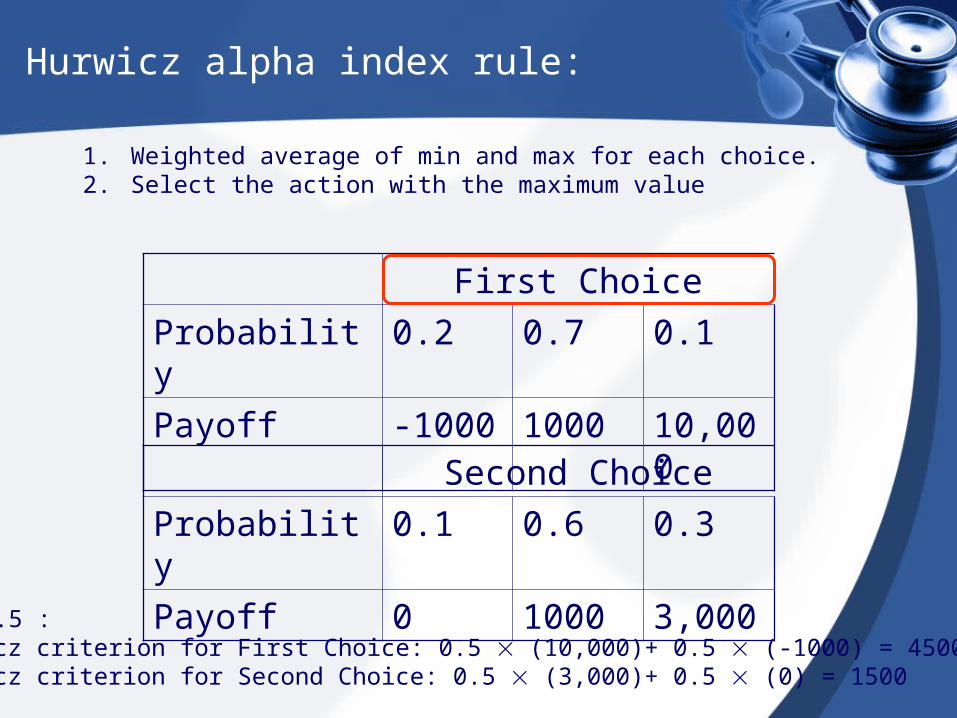
Hurwicz alpha index rule:
First Choice
Probability 0.2 0.7 0.1
Payoff -1000 1000 10,000
Second Choice
Probability 0.1 0.6 0.3
Payoff 0 1000 3,000
1. Weighted average of min and max for each choice. 2. Select the action with the maximum value
For = 0.5 :The Hurwicz criterion for First Choice: 0.5 (10,000)+ 0.5 (-1000) = 4500The Hurwicz criterion for Second Choice: 0.5 (3,000)+ 0.5 (0) = 1500

17
Hurwicz alpha index rule:
First Choice
Probability 0.2 0.7 0.1
Payoff -1000 1000 10,000
Second Choice
Probability 0.1 0.6 0.3
Payoff 0 1000 3,000
1. Weighted average of min and max for each choice. 2. Select the action with the maximum value
For = 0.1 :The Hurwicz criterion for First Choice: 0.1 (10,000)+ 0.9 (-1000) = 100The Hurwicz criterion for Second Choice: 0.1 (3,000)+ 0.9 (0) = 300
18
Hurwicz alpha index rule:
• The maximin strategy equates to the Hurwicz approach with a value of = 0.
• The maximax strategy corresponds to = 1.
Insurance Logic
• The consumer pays insurer a premium to cover medical expenses in coming year.– For any one consumer, the premium will
be higher or lower than medical expenses.
• But the insurer can pool or spread risk among many insurees.– The sum of premiums will exceed the sum
of medical expenses.
Characterizing Risk Aversion
• Recall the consumer maximizes utility, with prices and income given.– Utility = U (health, other goods)– health = h (medical care)
• Insurance doesn’t guarantee health, but provides $ to purchase health care.
• We assumed diminishing marginal utility of “health” and “other goods.”
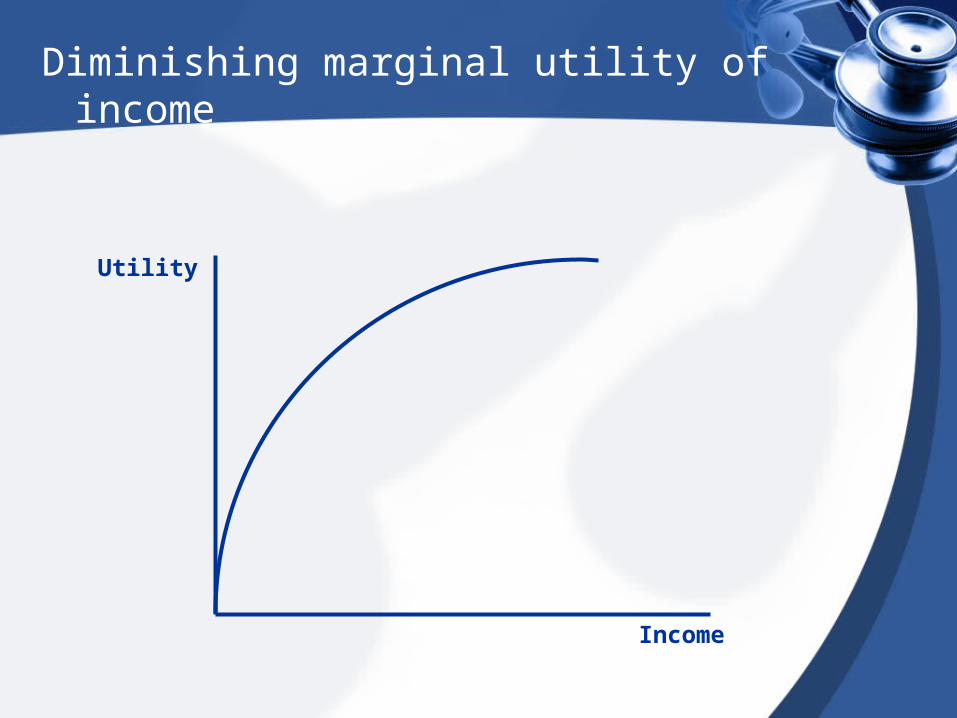
Diminishing marginal utility of income
Utility
Income
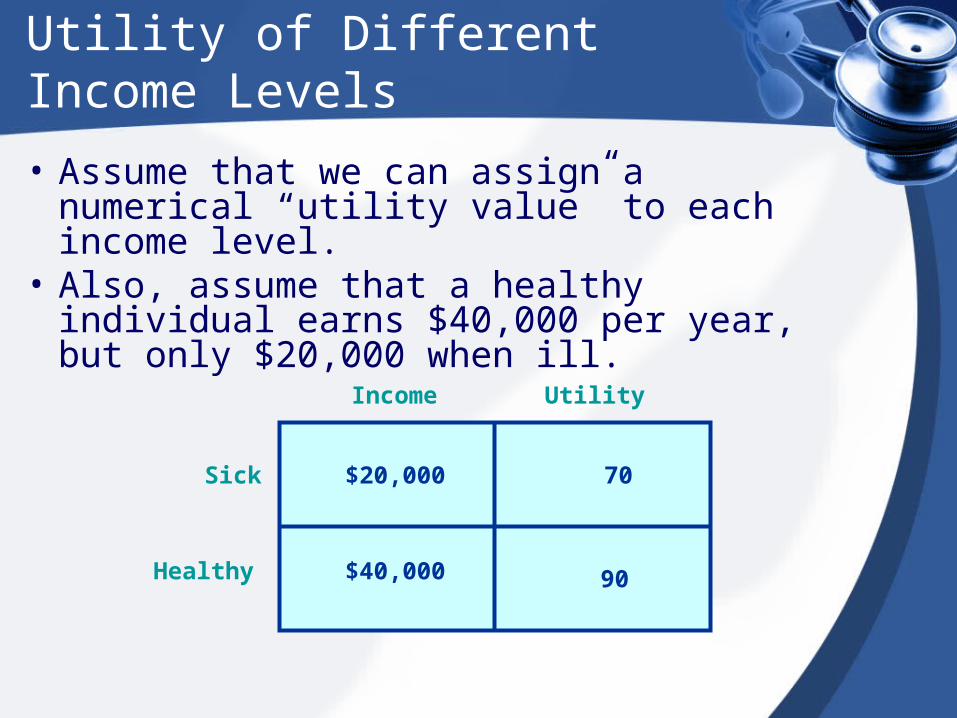
Utility of Different Income Levels
• Assume that we can assign a numerical “utility value” to each income level.
• Also, assume that a healthy individual earns $40,000 per year, but only $20,000 when ill.
$20,000
$40,000
70
90
Income Utility
Sick
Healthy

Utility
Income$20,000 $40,000
90
70
Utility when healthy
Utility when sick
A
B
Utility of Different Income Levels
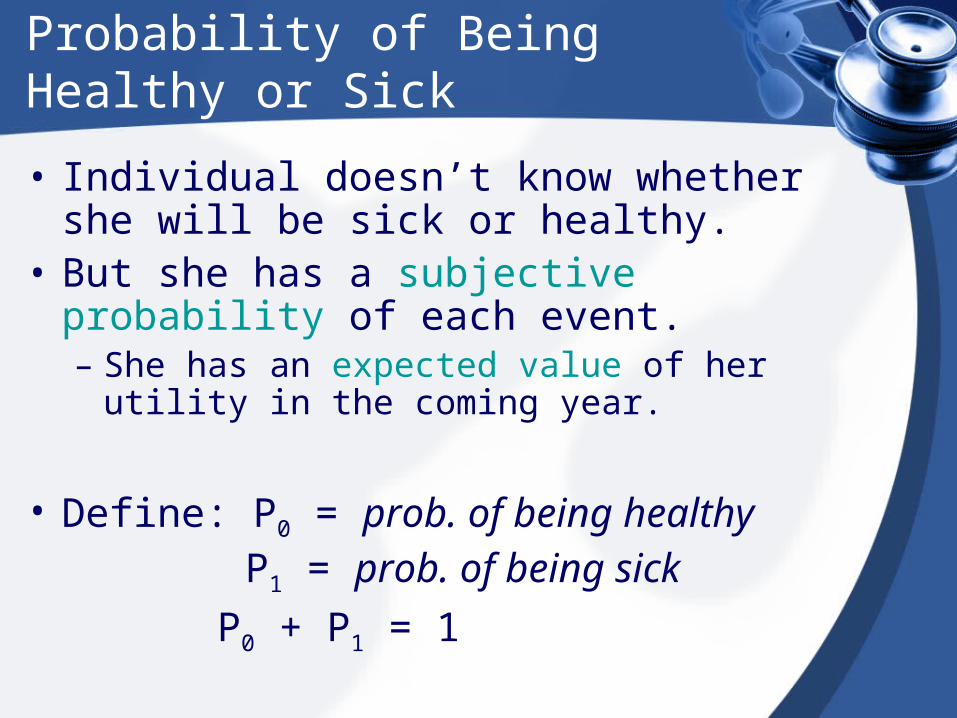
Probability of Being Healthy or Sick
• Individual doesn’t know whether she will be sick or healthy.
• But she has a subjective probability of each event.– She has an expected value of her utility in the
coming year.
• Define: P0 = prob. of being healthy P1 = prob. of being sick
P0 + P1 = 1
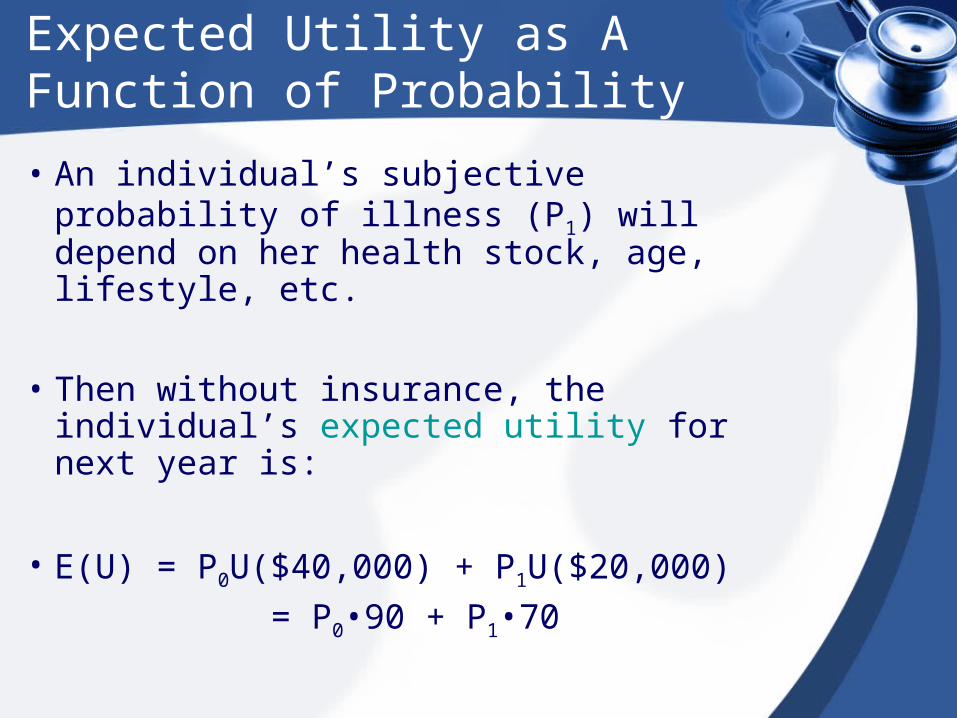
Expected Utility as A Function of Probability
• An individual’s subjective probability of illness (P1) will depend on her health stock, age, lifestyle, etc.
• Then without insurance, the individual’s expected utility for next year is:
• E(U) = P0U($40,000) + P1U($20,000)
= P0•90 + P1•70
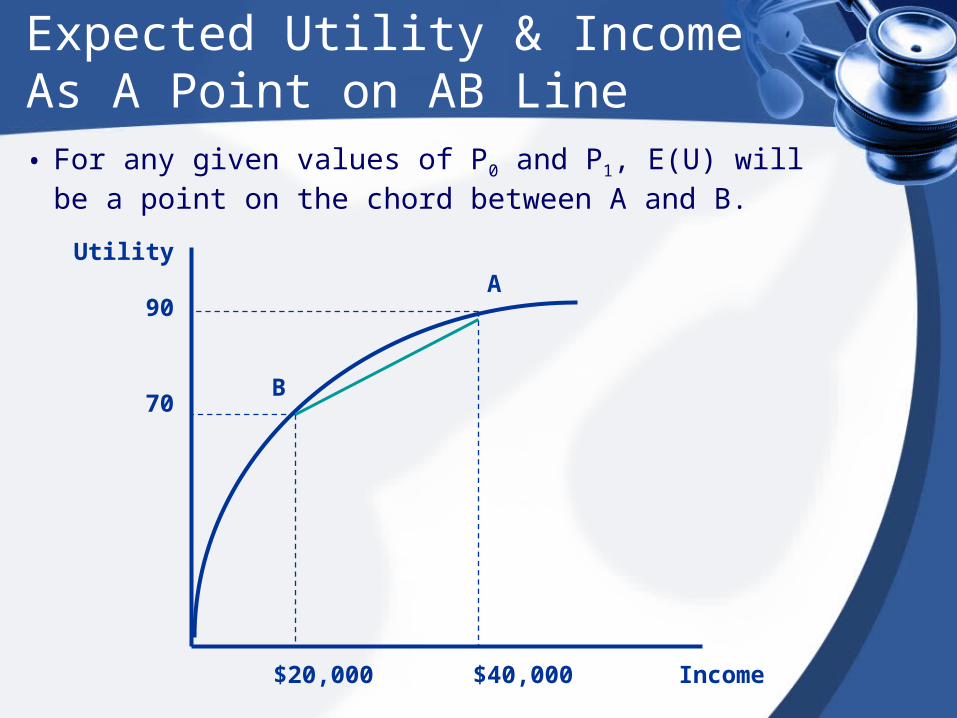
Expected Utility & Income As A Point on AB Line
• For any given values of P0 and P1, E(U) will be a point on the chord between A and B.
Utility
Income$20,000 $40,000
70
90A
B
Expected Utility & Income As A Point on AB Line
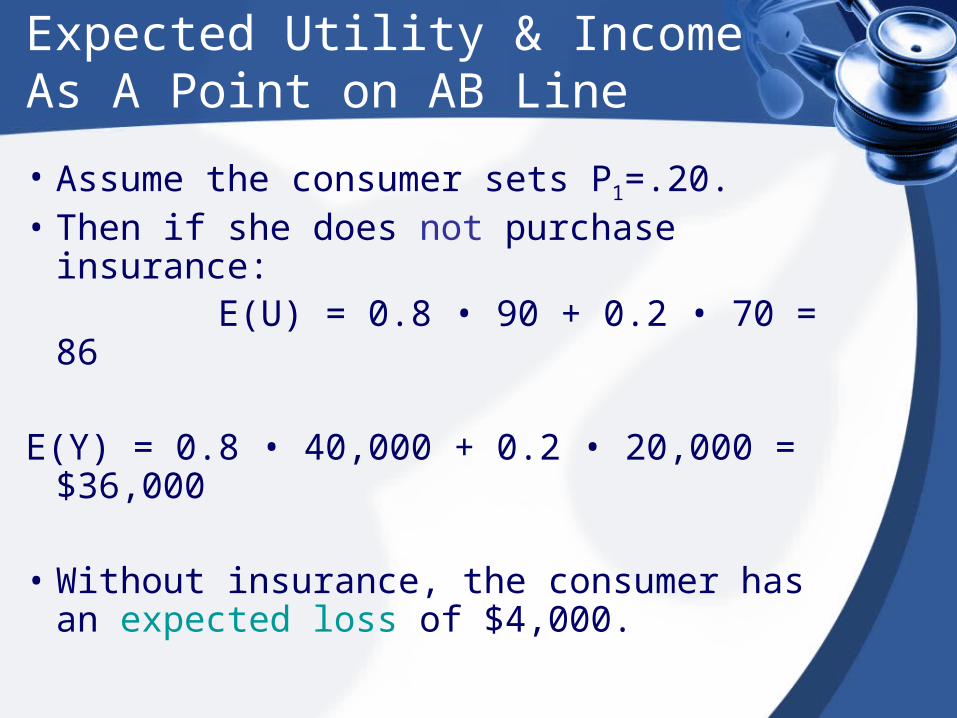
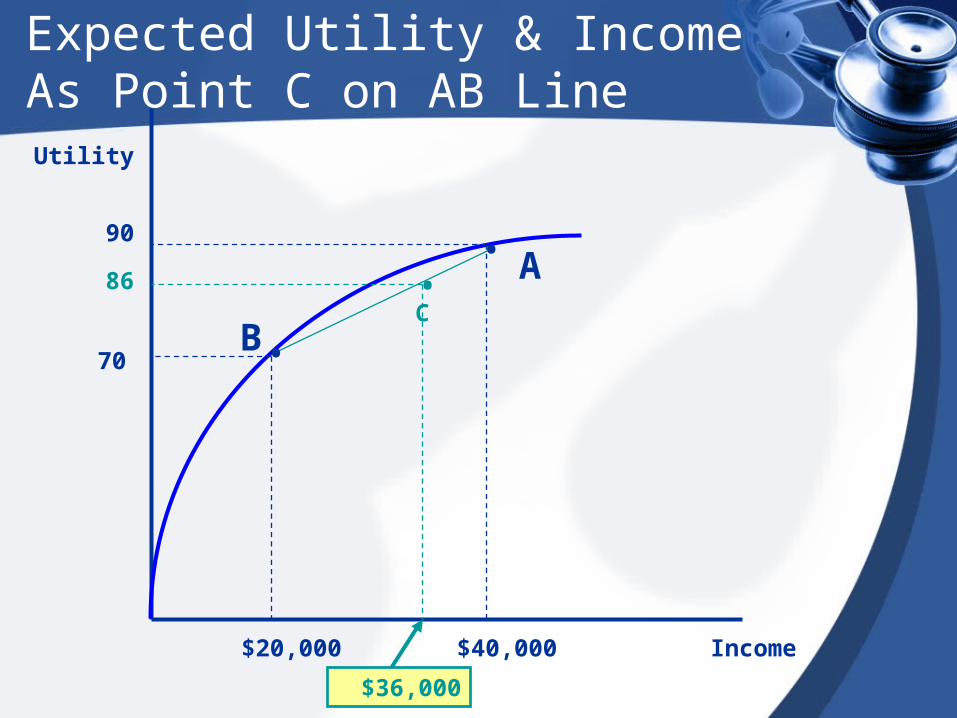
• Assume the consumer sets P1=.20.• Then if she does not purchase insurance: E(U) = 0.8 • 90 + 0.2 • 70 = 86
E(Y) = 0.8 • 40,000 + 0.2 • 20,000 = $36,000
• Without insurance, the consumer has an expected loss of $4,000.
Utility
Income$20,000 $40,000
90
70
A
B
$36,000
C•
•
•86
Expected Utility & Income As Point C on AB Line
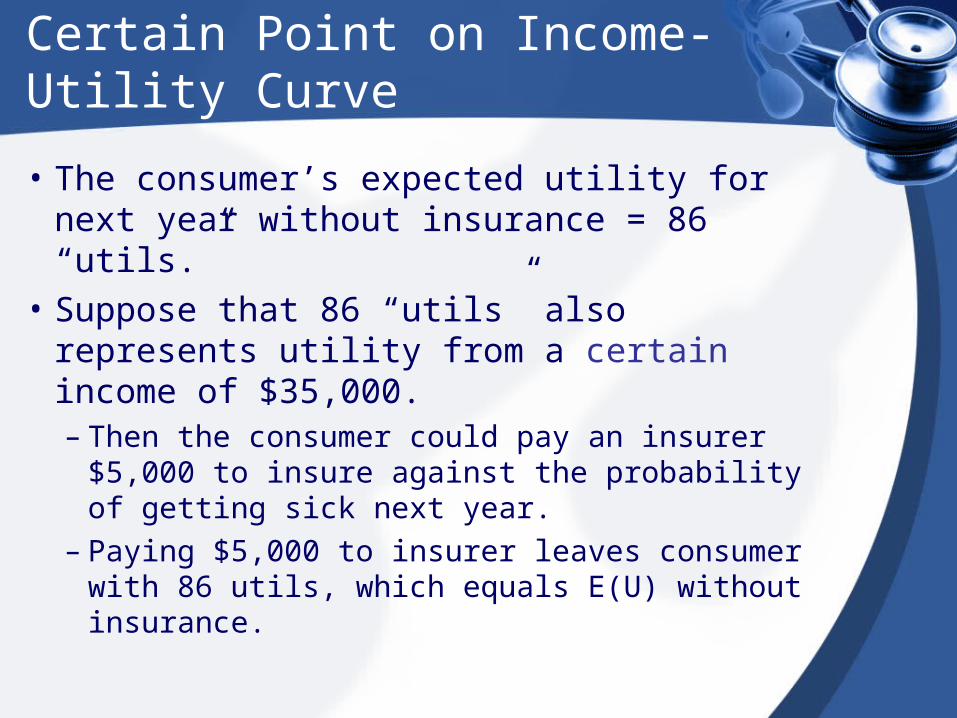
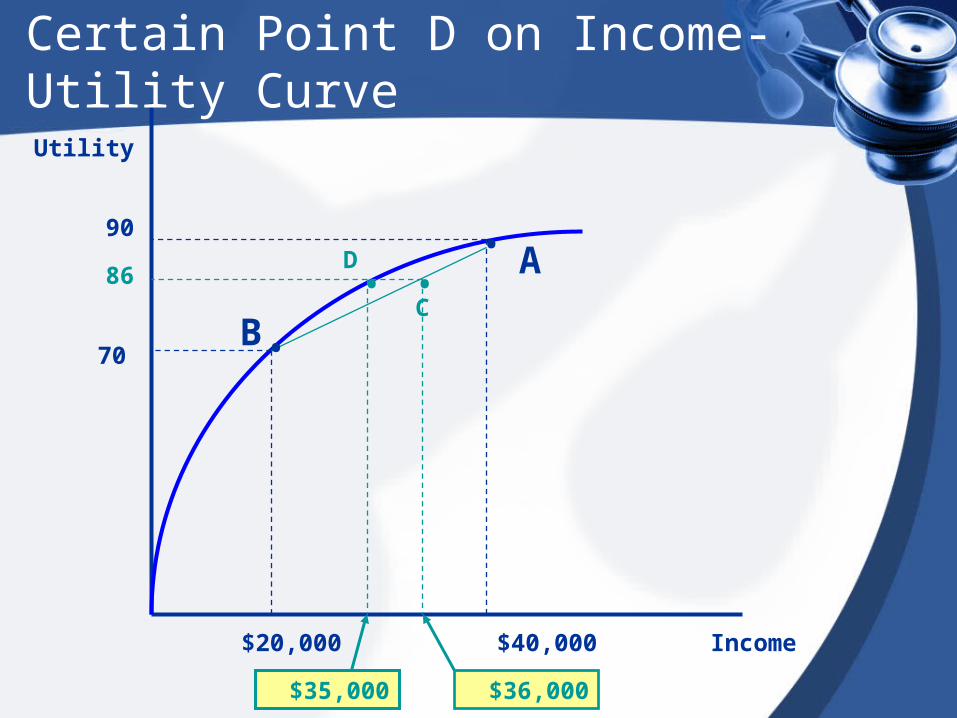
Certain Point on Income-Utility Curve
• The consumer’s expected utility for next year without insurance = 86 “utils.”
• Suppose that 86 “utils” also represents utility from a certain income of $35,000.– Then the consumer could pay an insurer
$5,000 to insure against the probability of getting sick next year.
– Paying $5,000 to insurer leaves consumer with 86 utils, which equals E(U) without insurance.
Utility
Income$20,000 $40,000
90
70
A
B
$36,000
C•
•
•86
$35,000
•D
Certain Point D on Income-Utility Curve

Price of Insurance and Loading Fee
• At most, the consumer is willing to pay $5,000 in insurance premiums to cover $4,000 in expected medical benefits.
• $1,000 loading fee price of insurance
• Covers– profits
– administrative expenses
– taxes

Thank You !Any Question ?