Embed Size (px)
Citation preview

1
Data analysis and bioinformatics
Vito Di GesùUniversity of Palermo, ItalyDipartimento di Matematica ed ApplicazioniVia Archirafi 34 - 90123 [email protected]
2
Summary
o Data analysis methods and techniques are revisited in the case of biological data sets.
o Particular emphasis is given to clustering and mining issues. Data mining adds to clustering the complications of very large data-sets with many attributes of different types. And this is a typical situation in biology.
o Some cases studies are described.
PREMI’ 2007 – 18-22 December ISI - Kolkata

3
o Bio-informatics is a new discipline devoted to the solution of biological problems.o techniques include:
- applied mathematics - statistics - computer science - artificial intelligence.
o Main results:- sequence alignment - gene finding
- genome assembly - protein structure alignment and prediction
- prediction of gene expression - protein-protein interactions - the modeling of evolution
PREMI’ 2007 – 18-22 December ISI - Kolkata

4
The data
Databases:- proteins - small molecules- metabolic and regulatory networks
1D large sequences (e.g. 106 genes)
PREMI’ 2007 – 18-22 December ISI - Kolkata

5
3D structures
DNA phosphate model
2D large structures
105106 spots on DNA chips
PREMI’ 2007 – 18-22 December ISI - Kolkata

6
Graphs, networks
expression profiles, phylogenetic trees
PREMI’ 2007 – 18-22 December ISI - Kolkata

7
Mining biological dataKernel methods for classification of microarray time series data
Applications in medicine and pharmacogenomics:
•disease diagnosis, •drug response prediction •disease outcome prognosis• individualized medical treatment
Graph kernels representations of proteins to retrieve structure and bio-chemical information and protein function prediction.
Feature graphs to represent potential docking sites and to retrieve activity maps from 3D protein databases.
PREMI’ 2007 – 18-22 December ISI - Kolkata

8
Mining biological data
Descriptive data mining
- pattern recognition problem TOUCAN, Hidden Markov Model
- Search techniquePattern matching
Approximate string matching on large DNA sequences Graph matching to measure structure similarity of two proteins
PREMI’ 2007 – 18-22 December ISI - Kolkata

9
Mining 3D structures
PREMI’ 2007 – 18-22 December ISI - Kolkata

10
Mining 3D structures
PREMI’ 2007 – 18-22 December ISI - Kolkata

11
Mining biological data
Predictive miningto explore large amount of data finding:
- consistent patterns - systematic relationships between variables- statistical modelsExploratory data analysis
Model building and validation
Deployment the application of the model to new data
PREMI’ 2007 – 18-22 December ISI - Kolkata

12
Clustering and bioinformatics
Clustering is the process of grouping data objects into a set of disjoint classes so that objects within a class have high similarity, while objects in separate classes are more dissimilar.
Clustering is part of exploratory data analysis, where rules are eventually found as a creative induction scheme that implies the need for experimental and theoretical models validations.
PREMI’ 2007 – 18-22 December ISI - Kolkata

13
K-means has been applied on gene expression data, finding clusters that contain a significant portion of genes with similar functions. Moreover, upstream sequences of DNA-genes within the same cluster allowed to extract 18 motifs, which are promising candidates for novel cis-regulatory elements.
K-means has some drawbacks:
- setting of number of clusters- it produces a large number of outliers
K-medoids uses an element closest to the center of a cluster as the representative (medoid) such that the total distance between the K selected medoids and the other elements is minimized. It is more robust to outliers.
PREMI’ 2007 – 18-22 December ISI - Kolkata

14
Other algorithms control the coherence of clusters: - Maximal similarity between two separate cluster centroids
- Minimal similarity between an element and its cluster centroid
- Cluster diameter constrains (compact clusters);
Adapt_Cluster assigns an element to a given cluster if the assignment has a higher probability than a given threshold.
Only clusters with qualified coherence from the data set are extracted and users do not need to input the number, K, of clusters.
PREMI’ 2007 – 18-22 December ISI - Kolkata

15
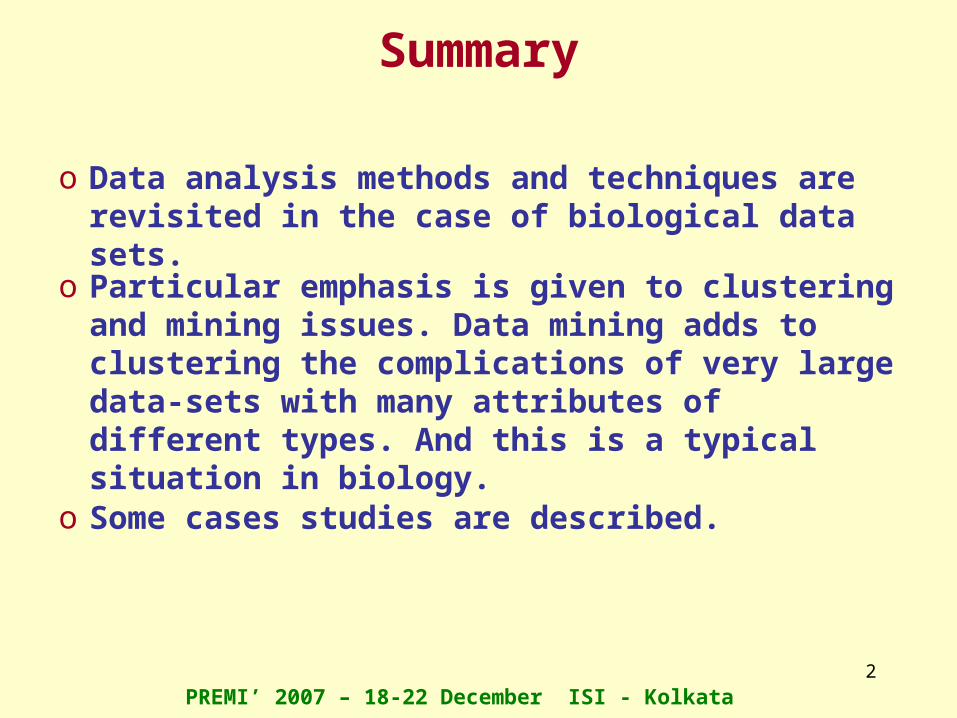
Self-Organizing Maps (SOM) have been developed on the basis of a single layered neural network.
PREMI’ 2007 – 18-22 December ISI - Kolkata
16
Each data acts as a training sample that directs the movement of the reference vectors towards the denser areas of the input vector space
When the training is completed, clusters are identified by mapping all data points to the output neurons.
One of the remarkable features of SOM is that it allows one to impose partial structure on the clusters, and arranges similar patterns as neighbors in the output neuron map.
SOM requires the number of clusters, which is typically unknown in advance for gene expression data.
PREMI’ 2007 – 18-22 December ISI - Kolkata

17
In Tamayo et all. (1999) SOM algorithm is applied to study hematopoietic differentiation.
The expression patterns of 1,036 human genes are mapped to a 64 SOM grid.
Genes are organized into biologically relevant clusters that suggest novel hypotheses about hematopoietic differentiation.
SOMBRERO (Self-Organizing Map for Biological Regulatory Element Recognitionand Ordering). (Department of Information Technology - NationalUniversity of Ireland)
SOMBRERO finds regulatory binding sites by using SOM to find over-represented motifs in a set of DNA sequences.
It includes a prior knowledge in the initialization phase that significantly improves accuracy.PREMI’ 2007 – 18-22 December ISI - Kolkata

18
The data set is assumed to come from a mixture of underlying probability distributions, with each component corresponding to a different cluster. The goal is to estimate the parameters
MBA (Model Based Algorithms)
|1 and |1 ;1ii ri k i k r n
such that max
1 1
,
;
;
;
;
.
k nir i r i
i r
r
ir r i
i r i
number of elements number of components
gene expression profile
probability that belongs to the cluster
density function o
L f x
n k
x
x C
f in compof ne tx Cn
PREMI’ 2007 – 18-22 December ISI - Kolkata

19
Hidden Markov model (HMM)
HMM's can be used to represent the alignment of multiple sequences or sequence segments by attempting to capture common patterns of residue conversion.
They are widely used in the analysis of biological sequences to take in account for the dependencies in time-series bio-data.
PREMI’ 2007 – 18-22 December ISI - Kolkata

20
GBA (Graph Based Algorithm)
GBA's are weighted undirected graphs: nodes represent gene expressions, arcs represent similarity measures
• Minimum Cut• Minimum Spanning Tree• Maximum Cliques• Highly Connected
Components
PREMI’ 2007 – 18-22 December ISI - Kolkata

21
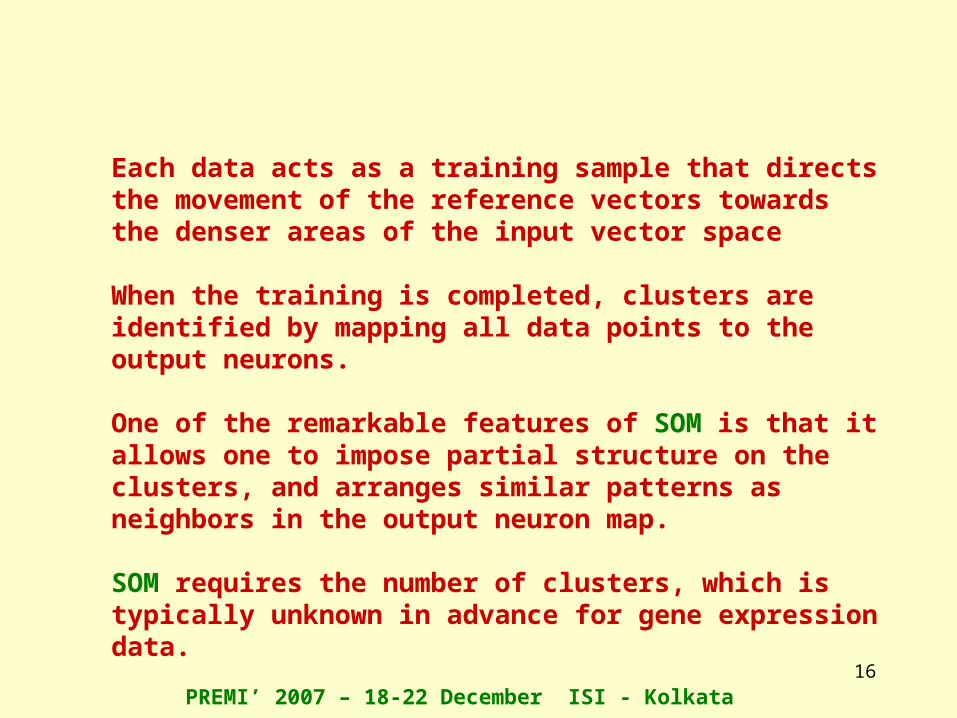
HA's (Hierarchical Algorithms) Agglomerative (bottom-up approach): initially each data object is regarded as an individual cluster. Agglomerative approaches merge, at each step, the closest pair of clusters until all the groups are merged into one cluster.
Divisive (top-down approach): starts with one cluster containing all the data objects. Iteratively clusters are splited until each cluster contains only one data object or certain stop criterion is met (CAST, E-CAST)
For divisive approaches, the essential problem is to decide how to split clusters at each step.
PREMI’ 2007 – 18-22 December ISI - Kolkata
22
1 43250
1
2
3
4
Agglomerative (Dendograms)
32
1 4
325
1 4325
PREMI’ 2007 – 18-22 December ISI - Kolkata

23
Divisive
PREMI’ 2007 – 18-22 December ISI - Kolkata

24
PBCA (Pattern-based Clustering Algorithms)
Have been proposed to capture coherence exhibited by a subset of genes on a subset of attributes. It takes in account the fact that in molecular biology any cellular process may take place only in a subset of the attributes (samples or time points).Biclustering was introduced to finds a partition of vectors and a subset of the dimensions such that the projections along those directions of the vectors in each cluster are close to one another. Then the problem requires to cluster vectors and features simultaneously, thus the name biclustering.Multi-objective evolutionary clustering (Sushmita et al. 2006) for gene expression data. A set of solutions, which are all optimal and involving trade-offs between conflicting objectives, are considered.
PREMI’ 2007 – 18-22 December ISI - Kolkata

25
ECA (Evolutive Clustering Algorithms)Have been recently proposed to analyze biological data and overcome both the computational complexity of greedyalgorithms and to improve the space solution scan.GenClust (Genetic Clustering) (Di Gesù et al. 2005) for clustering of gene expression data. Features:
- a novel coding of the search space that is simple, compact and easy to update;
- it can be naturally used in conjunction with data driven internal validation methods.
GIFC (Genetic Integrated Fuzzy Classifier) (Di Gesù, Lo Bosco 2005) Here schemes are controlled by a genetic optimization procedure. Two versions of integration are proposed and validated by experiments on real data biological data.
PREMI’ 2007 – 18-22 December ISI - Kolkata

26
IGKA (Incremental Genetic K-means Algorithm ) (Lu et al. 2004) It is an extension of previously proposed genetic algorithm to improve the computation of K-means algorithm. The main idea of IGKA is to calculate the objective value Total Within-Cluster Variation and to cluster centroids incrementally whenever the mutation probability is small. IGKA always converges to the global optimum.
Experiments indicate that IGKA algorithm has a faster convergence when the mutation probability decreases to some point.
PREMI’ 2007 – 18-22 December ISI - Kolkata

27
Case studies
PREMI’ 2007 – 18-22 December ISI - Kolkata

28
An evolutive algorithm: GenClust(Di Gesù, Giancarlo, Lo Bosco, Scaturro2005)
Is a genetic variant of ISODATA, the main feature consists in the generated solution space. Solutions represent the assignment of each element, x, instead of coding the whole partition of the data set.
PREMI’ 2007 – 18-22 December ISI - Kolkata

29
Scketch of GenClust
1 2
0
1
, ,...,dt K
t temp t
t
X C C C
At each stage, , GenClust performs the partition
of the data set, :
is generated by random assignment to classes
or through anot
P
P
P
her c
P
lustering algorithm.
P EO SEL
2
1
1
1( , )
max ,
( ) ( )
( )
dj j
j jj
t t
xfitness x
d x
VAR P VAR P
VAR P
where EO cross - over,mutation
SEL selection with suitable fitness function
Note that, there is no guarantee that ,
where denotes the internal partition variance.
PREMI’ 2007 – 18-22 December ISI - Kolkata

30
Validation
2
1
1
1( , ) ,
,
,
i
K
k
k x C
m
e
k
FOM e K R x e m en
FOM K FOM e K
K
m
R x e
m e k
where:
number of cluster
number of features
gene expression
average gene expression in cluster
PREMI’ 2007 – 18-22 December ISI - Kolkata

31
Validation
RYCC – K=5Method AdjustedRand
FOM
GenClust random 0.446 10.60Min kmeans-random 0.359
10.69Max kmeans-random 0.49
10.69Cast 0.49 10.84Kmeans-Avlink 0.469 10.73Avlink 0.46
11.50GenClust-Avlink 0.518 10.80
PBM: Pheripheral Blood MonocytesRPBM: Reduced Pheripheral Blood MonocytesRCNS: Central Nervous System RatRYCC: Reduced Yeast Cell CycleYCC: Yeast Cell Cycle
PREMI’ 2007 – 18-22 December ISI - Kolkata

32
Analysis of Genes Expressions
Analyzing coherent gene expression patterns is an important task in bioinformatics research, because coexpressed genes may belong to the same or similar functional categories and indicate co-regulated families, while coherent patterns may characterize important cellular processes and suggest the regulating mechanism in the cells.
PREMI’ 2007 – 18-22 December ISI - Kolkata

33
An example GeneX (Gene eXplorer)(mining coherent expression patterns)
- preprocessing module to perform to estimate missing values, logarithmic transformation and standardization of each gene expression profile.
- pattern manager module to explore coherent patterns in the data set and save/load the coherent patterns.
- working zone to integrates parallel coordinates, coherent pattern index graphs, tree views.
PREMI’ 2007 – 18-22 December ISI - Kolkata

34
GeneX (Gene eXplorer simulator)
UMass Boston Computer Science Department
PREMI’ 2007 – 18-22 December ISI - Kolkata

35
• Explore a sample gene: - Explore the correspondence between DNA, pre-mRNA, mature mRNA, and protein - Map the functional elements of a gene.
• Create mutations in a gene and explore their effects. • Design a gene of their own and see how it is
expressed.
• Computes different sequences as follows: - Starts with a DNA sequence. - Finds the promoter (TATAA). - Transcribes the pre-mRNA until it reaches a terminator (GGGGG). - Removes the introns from the pre-mRNA
(GUGCG ...... CAAAG). - Adds a poly A tail. - Translates the mature mRNA from the first AUG to the stop codon.
GeneX (Gene eXplorer simulator)
PREMI’ 2007 – 18-22 December ISI - Kolkata

36
• localization of nucleosomes along DNA
• nucleosoms are basic repeated unitsalong the DNA.
• Their positioning provides useful information about the level of genetic expression in cells.
Finding nucleosome regions in DNA
PREMI’ 2007 – 18-22 December ISI - Kolkata

37
Methods
Probabilistic networks (Hidden Markov Models, Bayesian networks) (Yuan 2003)
Multi-Layers Model (MLM)(Corona, Di Gesù, Yuan, Lo Bosco, Pinello 2007)
PREMI’ 2007 – 18-22 December ISI - Kolkata

38
MLM
Multi-Layers Model (MLM) consists in the generation of several sub-samples from the input signal.
o It is computational efficient.
o It provides a better structural view of the input data.
PREMI’ 2007 – 18-22 December ISI - Kolkata

39
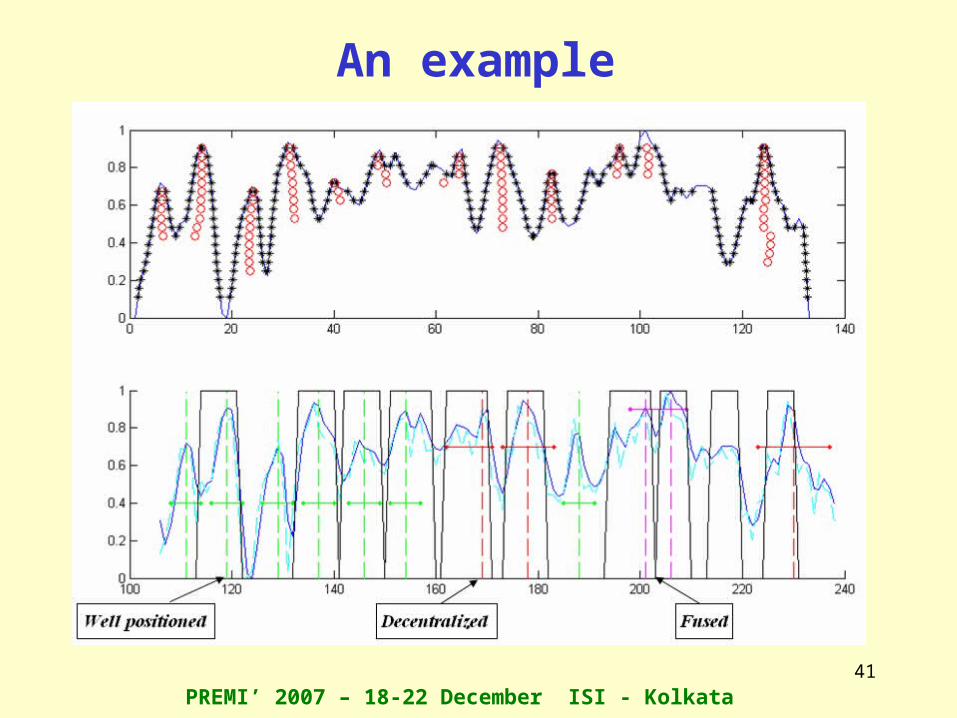
MLM
PREMI’ 2007 – 18-22 December ISI - Kolkata
For example, in the case of input signal fragment, representingthe Saccharomyces cerevisiae microarray data, each value in the x axys represents a spot on the microarray and its intensity is the log ratio Green/Red.
The problem is the identification of particular patterns in the DNA called nucleosome and linker regions.

40
Nuclesome classification
• Well positioned
• Fused
• Decentralized
PREMI’ 2007 – 18-22 December ISI - Kolkata
41
An example
PREMI’ 2007 – 18-22 December ISI - Kolkata

42
• MLM has been validated using synthetic and real data. Nuclesomic regions have been recognized with a percentage of 78%.
• Exepriments on real data show 76% of agreement between MLM and HMM
Method Linker MLM Nucleosome MLM
Linker HMM 0.7880 0.2120
Nucleosome HMM 0.2643 0.7357
MLM Validation
PREMI’ 2007 – 18-22 December ISI - Kolkata
43
Final remarks and perspectives
o Clustering methods still play a considerable role in biological applications, (mining of biological data, gene expression study).
o The need exists to increase research in interdisciplinary directions (biologists, mathematician, physicists, computer scientists).
o Difficulties exists in the validation of new developed
data analysis methods (creation of certified datasets for benchmark).
It is important to address important biological problems.
PREMI’ 2007 – 18-22 December ISI - Kolkata

44
Thank you for your attentionThank you for your attention
PREMI’ 2007 – 18-22 December ISI - Kolkata