Embed Size (px)
Citation preview
1
Cybersecurity ResearchPrepared for
© Harris Interactive
January 2013
Table of Contents
Methodology 3
Questionnaire Design Flow 4
Executive Summary 5
Detailed Findings 9
Appendix 33
© Harris Interactive
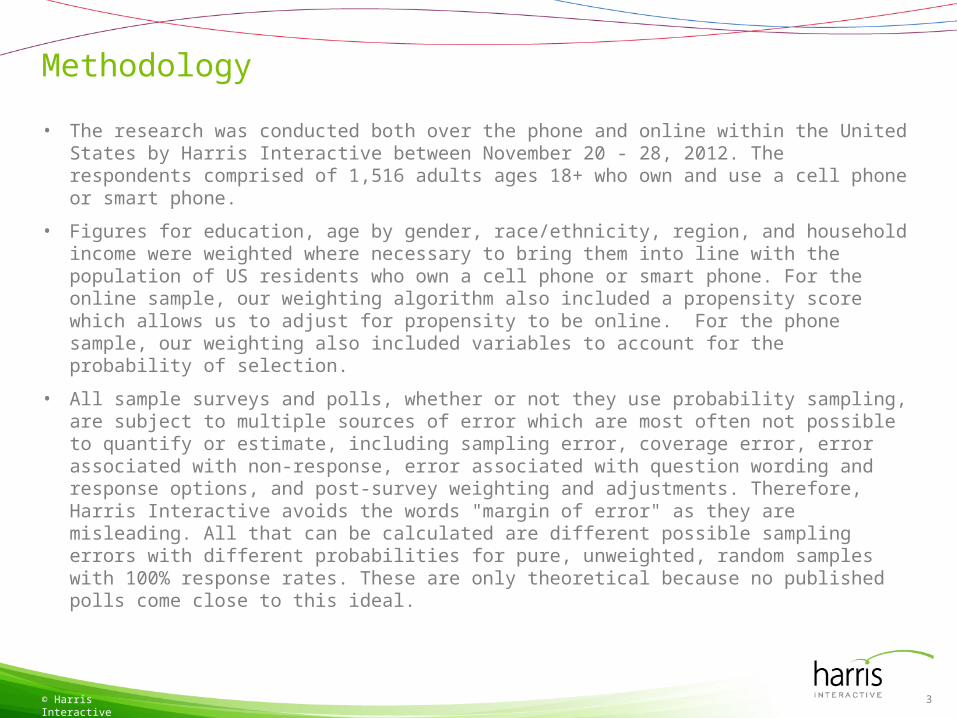
Methodology
• The research was conducted both over the phone and online within the United States by Harris Interactive between November 20 - 28, 2012. The respondents comprised of 1,516 adults ages 18+ who own and use a cell phone or smart phone.
• Figures for education, age by gender, race/ethnicity, region, and household income were weighted where necessary to bring them into line with the population of US residents who own a cell phone or smart phone. For the online sample, our weighting algorithm also included a propensity score which allows us to adjust for propensity to be online. For the phone sample, our weighting also included variables to account for the probability of selection.
• All sample surveys and polls, whether or not they use probability sampling, are subject to multiple sources of error which are most often not possible to quantify or estimate, including sampling error, coverage error, error associated with non-response, error associated with question wording and response options, and post-survey weighting and adjustments. Therefore, Harris Interactive avoids the words "margin of error" as they are misleading. All that can be calculated are different possible sampling errors with different probabilities for pure, unweighted, random samples with 100% response rates. These are only theoretical because no published polls come close to this ideal.
© Harris Interactive 3
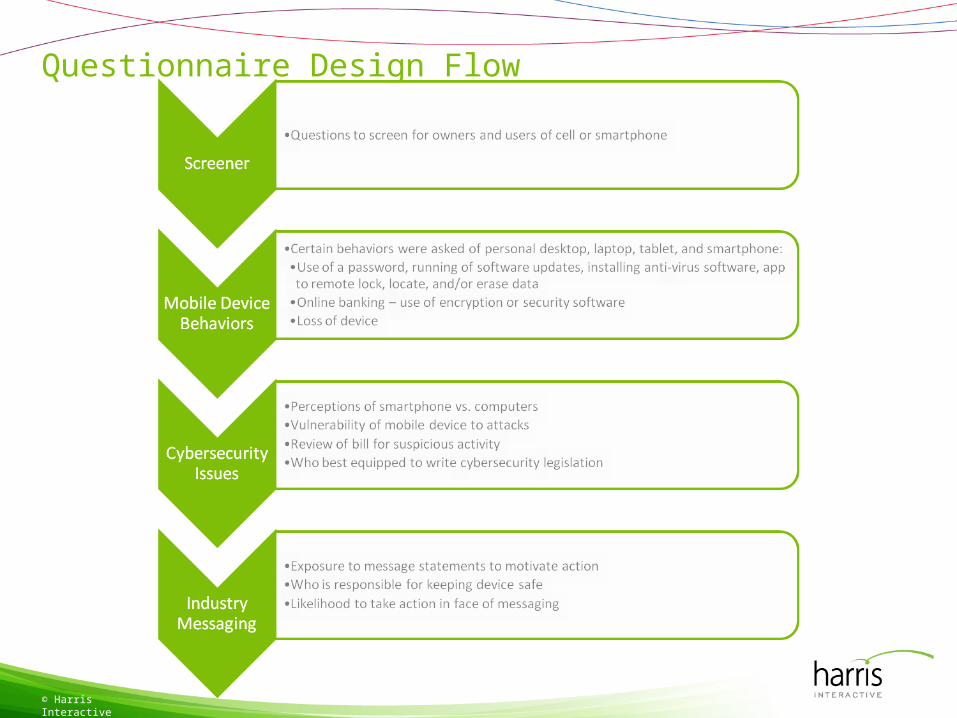
Questionnaire Design Flow
© Harris Interactive
Executive Summary
• Cybersecurity is not a foreign concept for mobile devices but it is viewed differently for mobile devices than with computers.– Consumers overwhelmingly acknowledge that their mobile devices are vulnerable to
cyber attacks. – Monthly they review their wireless bill for suspicious activity. – However since smartphones are not seen as mini computers, cybersecurity is not
viewed the same on both devices. – Nearly three-quarters of consumers access Wi-Fi Networks (which may or may not
be secure) with their smartphone or tablet.
© Harris Interactive 5
Executive Summary• Consumers recognize their responsibility to keep their mobile device safe.
However, many are not taking all possible steps to do so.– Three-quarters of consumers believe the responsibility to keep their mobile device
safe mostly falls to them. – Updates are run as frequently on mobile devices as they are with computers – with
two-thirds running them as they are available.– Approximately half use a password or PIN to access their smartphone or tablet, but
this is much less than with their computers.– Of those that use their mobile device for online banking, only just over half encrypt or
use security software. – Of the small percentage who have lost or had their smartphone stolen, almost half
contacted their provider to suspend service. – Less than half have an app with remote lock, locate, and or erase functions on their
mobile device. – Anti-virus software is the least likely to be installed on mobile devices – with less than
one-third taking this step with their smartphone or tablet. – Consumers are more apt to protect themselves against tangible threats (like the loss
of a mobile device) versus intangible threats (such as hacking, malware, etc.)
© Harris Interactive 6
Executive Summary
• Consumers generally want to do what is needed to protect their mobile devices, but don’t know specifically how.– After being exposed to statements about cybersecurity, consumers are generally
motivated to take action to protect themselves. – However when asked about specific actions (such as adding a password/PIN or
installing anti-virus software) consumers were no more persuaded than before. – Personal stories and apps that remind consumers to update software, change their
PIN, etc. would help to prompt more specific actions.
• Compared to the federal government, consumers view the industry as being the best equipped to write cybersecurity regulations.
© Harris Interactive 7
Executive Summary
• Those who lose or have devices stolen are by definition a vulnerable target for cyber threats. Given this, they should be inclined to take more precautions than those who don’t, but they don’t appear to be.– Those who lose their smartphones or have them stolen are more likely to add a
PIN/password than those that don’t. However they are equally likely to take other precautions (such as app to remote lock/erase or have anti-virus software) than their counterparts.
– They don’t view their device as a mini computer and thus don’t see cybersecurity the same on their smartphone as on their computer.
– They aren’t more likely to recognize their vulnerability and see the responsibility as lying more with the industry than those who don’t lose their smartphones.
– However this audience is very receptive to information on the subject of cybersecurity and are particularly motivated by those that emphasize how much personal information is contained on their mobile device.
© Harris Interactive 8
Cybersecurity is not a foreign concept for mobiledevices but it is viewed differently than with computers.
© Harris Interactive
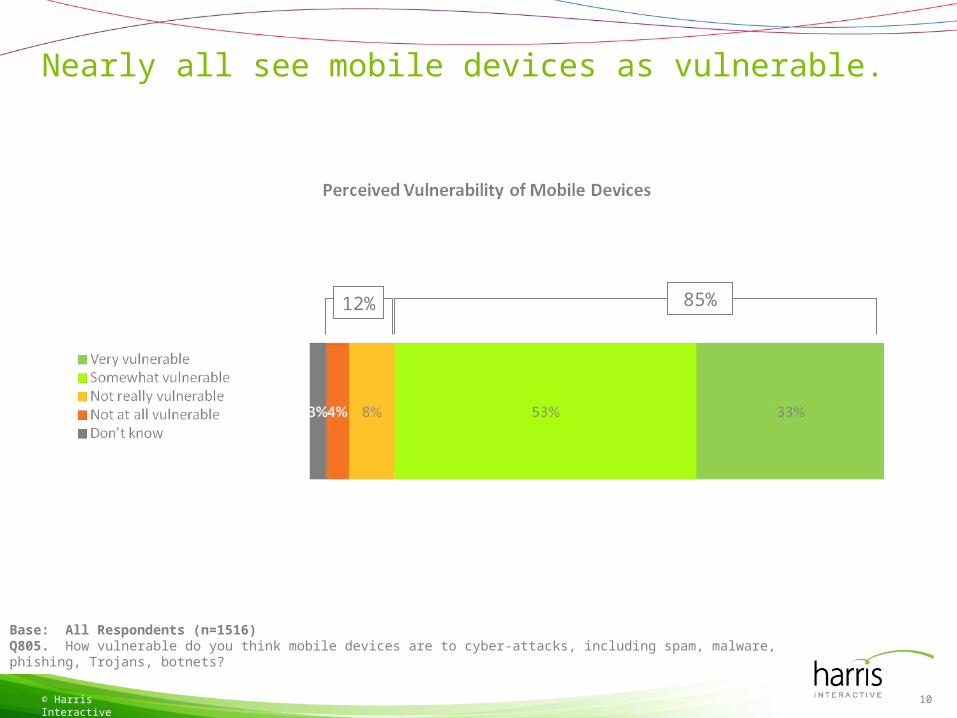
Nearly all see mobile devices as vulnerable.
© Harris Interactive
Base: All Respondents (n=1516)Q805. How vulnerable do you think mobile devices are to cyber-attacks, including spam, malware, phishing, Trojans, botnets?
12% 85%
10
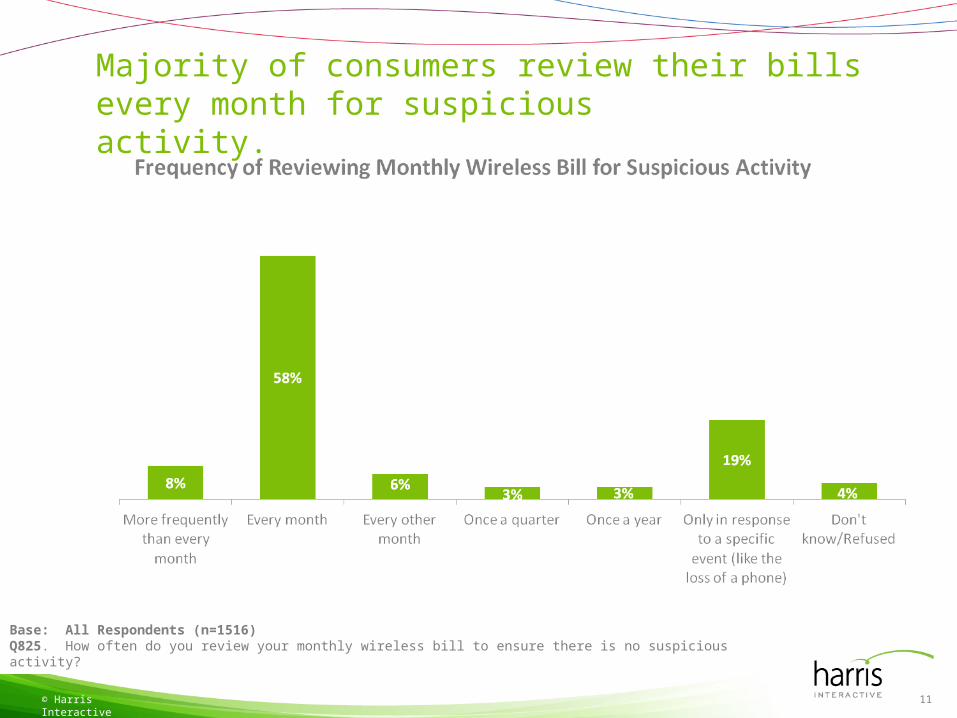
Majority of consumers review their bills every month for suspicious
activity.
© Harris Interactive
Base: All Respondents (n=1516)Q825. How often do you review your monthly wireless bill to ensure there is no suspicious activity?
11
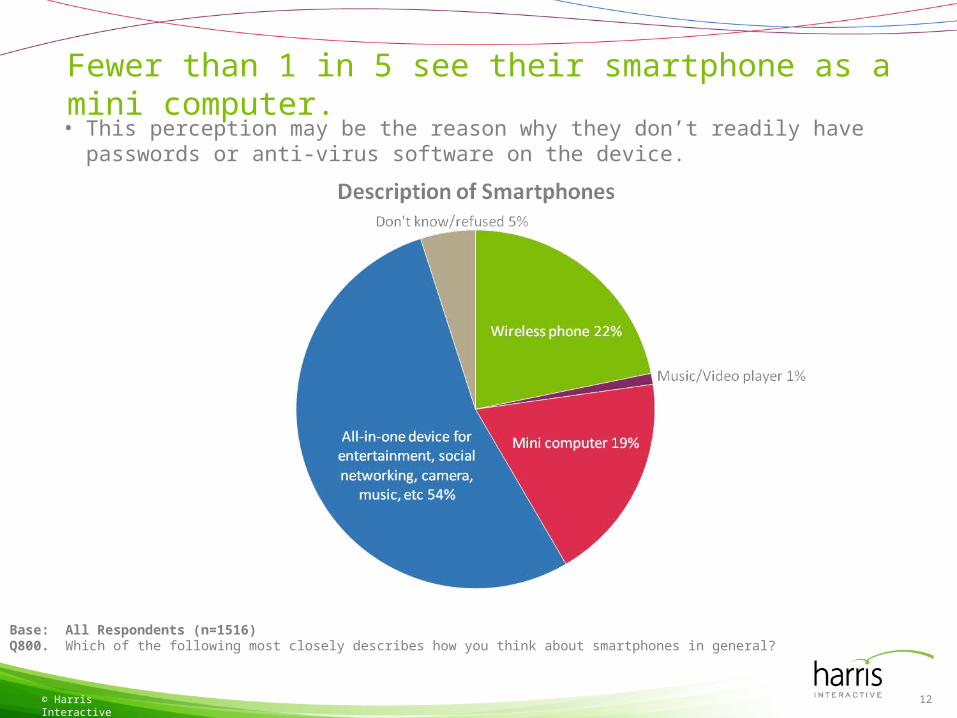
Fewer than 1 in 5 see their smartphone as a mini computer.
© Harris Interactive
Base: All Respondents (n=1516)Q800. Which of the following most closely describes how you think about smartphones in general?
12
• This perception may be the reason why they don’t readily have passwords or anti-virus software on the device.
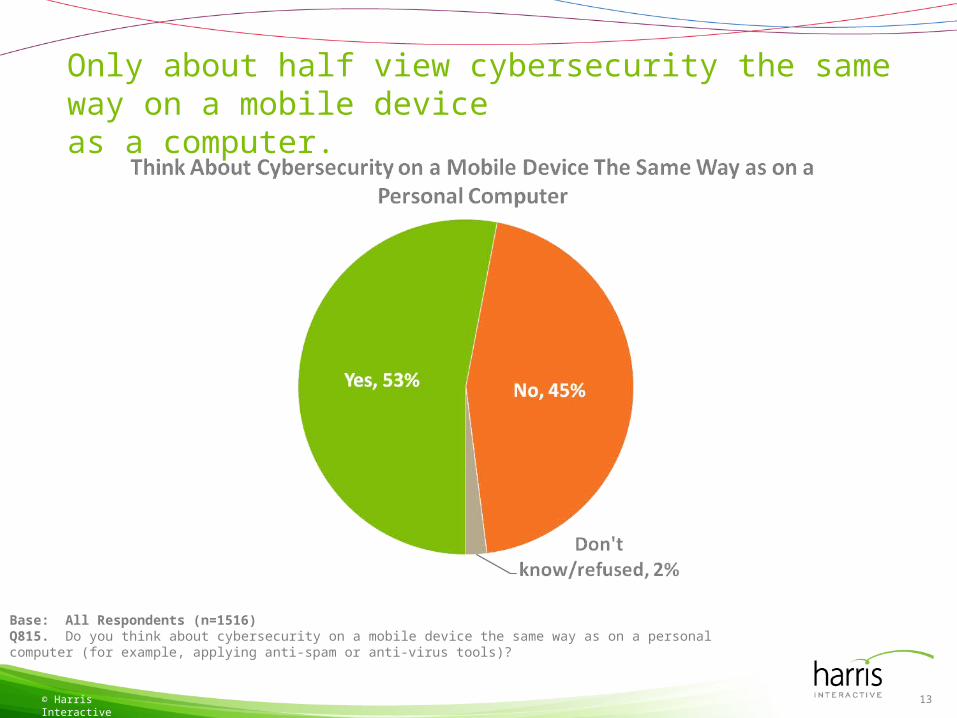
Only about half view cybersecurity the same way on a mobile device as a computer.
© Harris Interactive
Base: All Respondents (n=1516)Q815. Do you think about cybersecurity on a mobile device the same way as on a personal computer (for example, applying anti-spam or anti-virus tools)?
13
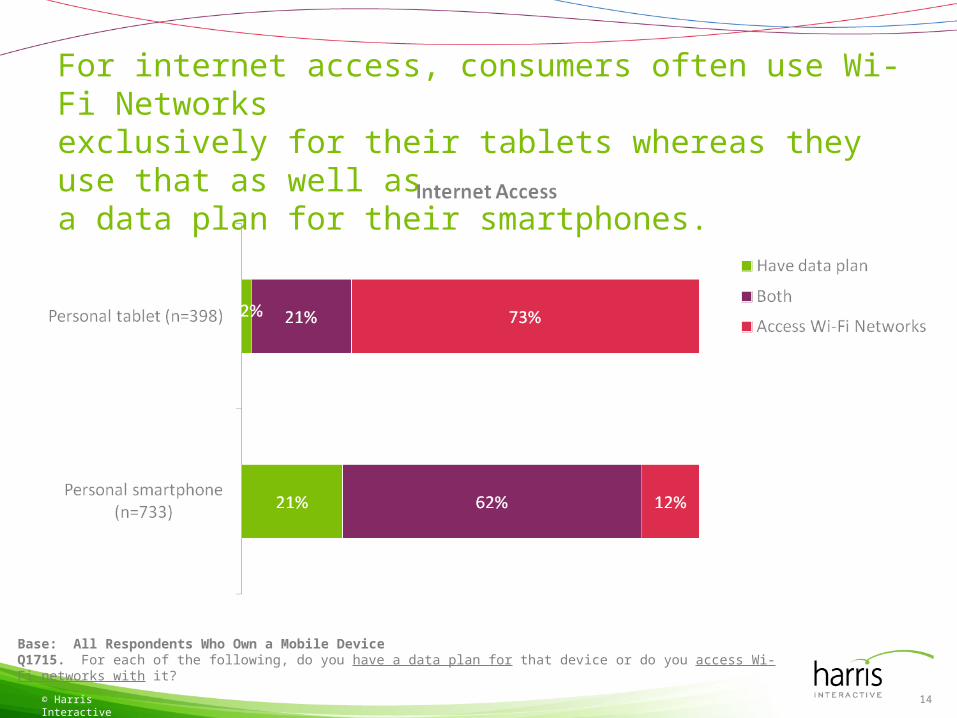
For internet access, consumers often use Wi-Fi Networks exclusively for their tablets whereas they use that as well as a data plan for their smartphones.
© Harris Interactive
Base: All Respondents Who Own a Mobile DeviceQ1715. For each of the following, do you have a data plan for that device or do you access Wi-Fi networks with it?
14
Consumers recognize responsibility but many are not taking all possible steps to protect themselves.
© Harris Interactive
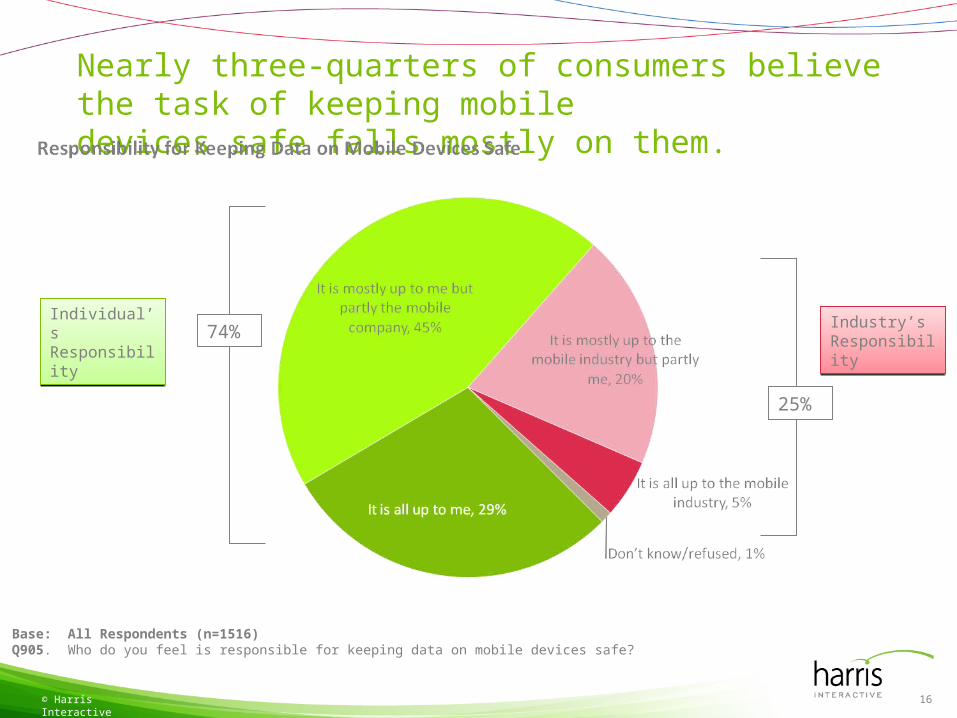
Nearly three-quarters of consumers believe the task of keeping mobiledevices safe falls mostly on them.
© Harris Interactive
Base: All Respondents (n=1516)Q905. Who do you feel is responsible for keeping data on mobile devices safe?
74% Industry’s ResponsibilityIndustry’s Responsibility
Individual’s ResponsibilityIndividual’s Responsibility
25%
16
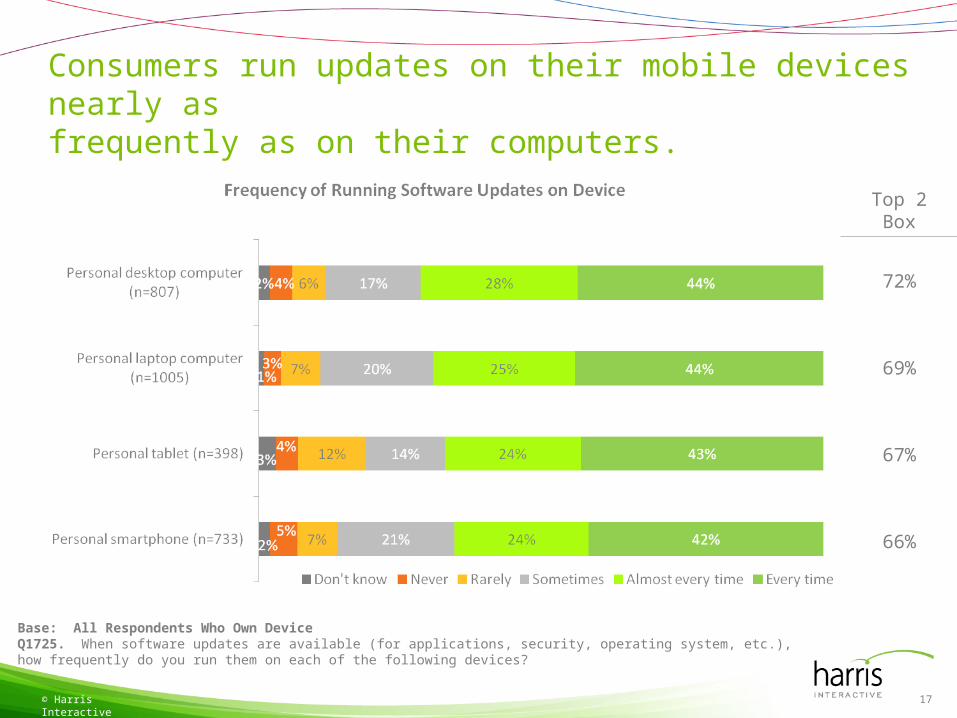
Consumers run updates on their mobile devices nearly as frequently as on their computers.
© Harris Interactive
Base: All Respondents Who Own DeviceQ1725. When software updates are available (for applications, security, operating system, etc.), how frequently do you run them on each of the following devices?
Top 2 Box
72%
69%
67%
66%
17
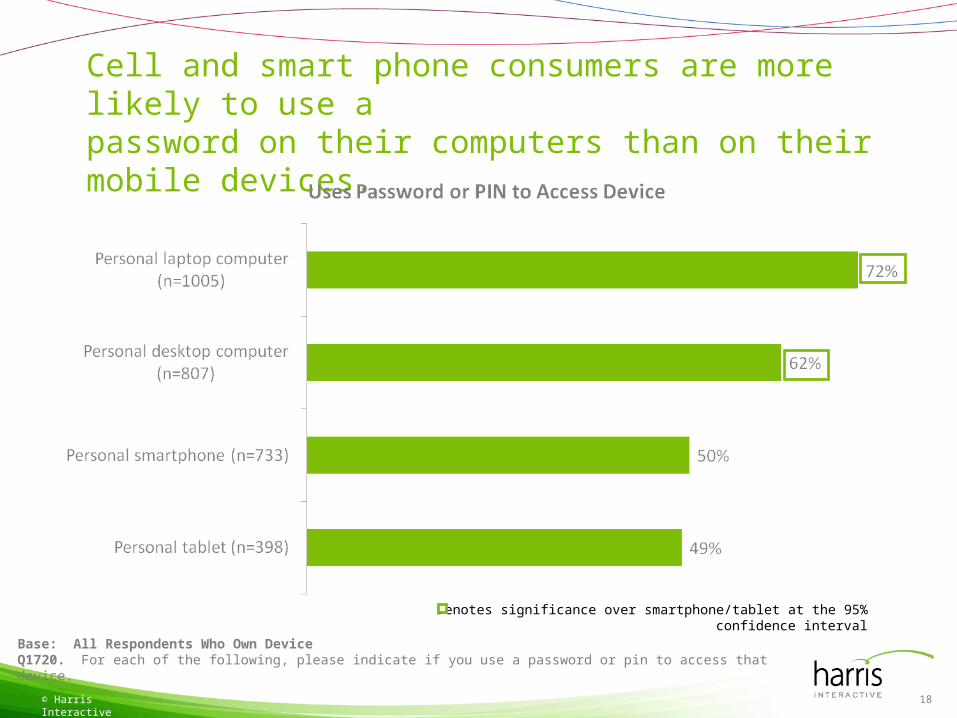
Cell and smart phone consumers are more likely to use a password on their computers than on their mobile devices.
© Harris Interactive
Base: All Respondents Who Own DeviceQ1720. For each of the following, please indicate if you use a password or pin to access that device.
18
Denotes significance over smartphone/tablet at the 95% confidence interval
n=115
n=234
n=619
n=554
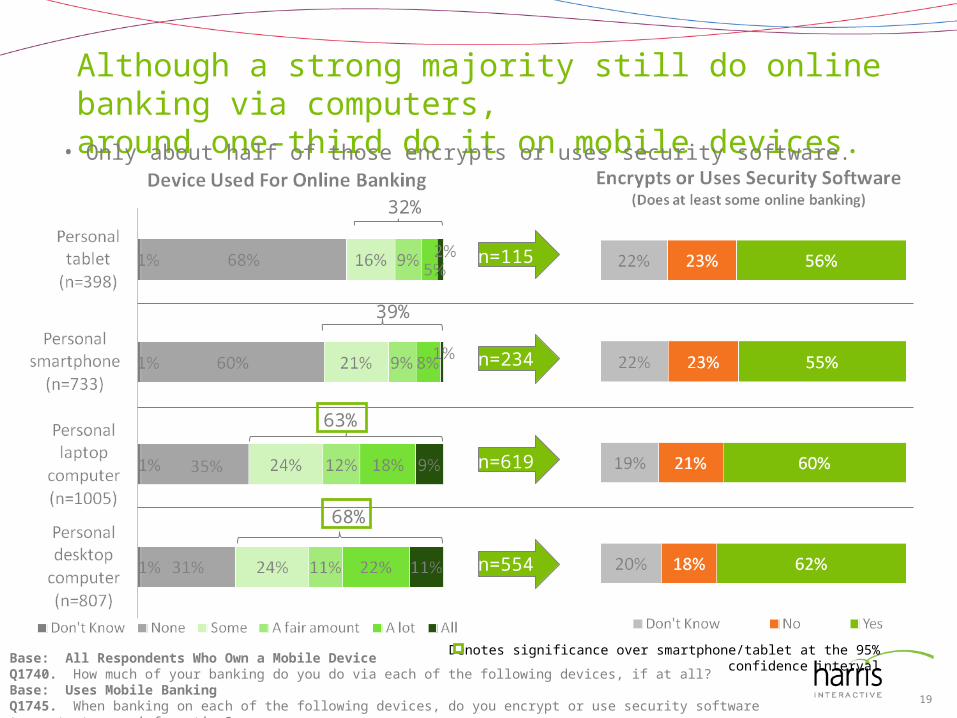
Although a strong majority still do online banking via computers, around one-third do it on mobile devices.
© Harris Interactive
Base: All Respondents Who Own a Mobile DeviceQ1740. How much of your banking do you do via each of the following devices, if at all?Base: Uses Mobile Banking Q1745. When banking on each of the following devices, do you encrypt or use security software to protect your information?
32%
39%
63%
68%
19
• Only about half of those encrypts or uses security software.
Denotes significance over smartphone/tablet at the 95% confidence interval
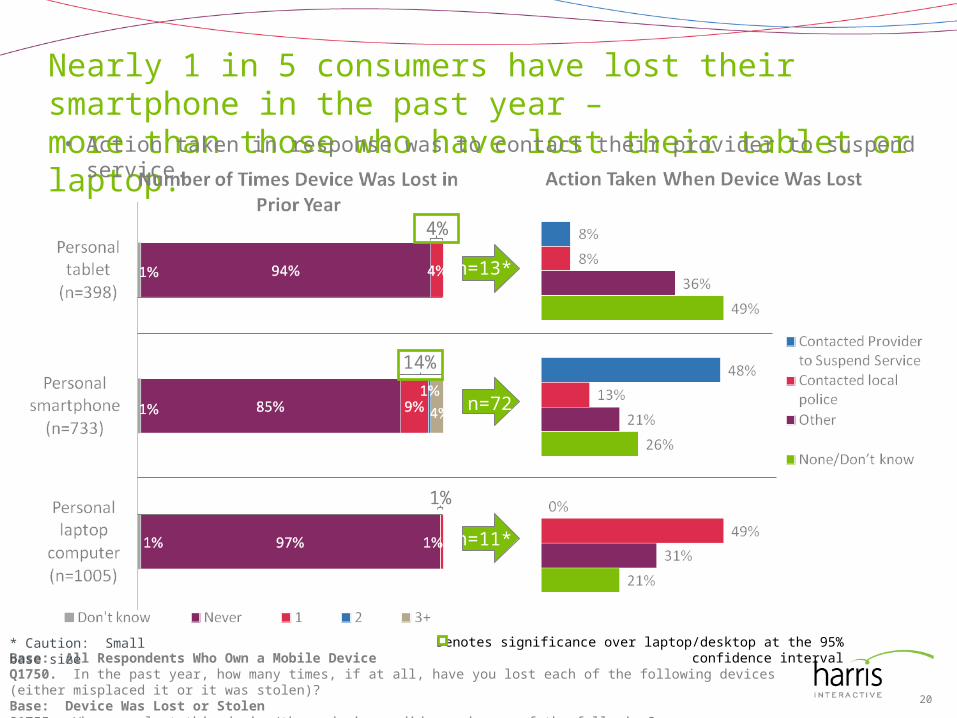
Nearly 1 in 5 consumers have lost their smartphone in the past year – more than those who have lost their tablet or laptop.
© Harris Interactive
Base: All Respondents Who Own a Mobile Device Q1750. In the past year, how many times, if at all, have you lost each of the following devices (either misplaced it or it was stolen)?Base: Device Was Lost or StolenQ1755. When you lost this device/these devices, did you do any of the following?
4%
14%
1%
n=13*
n=72
n=11*
* Caution: Small base size
20
• Action taken in response was to contact their provider to suspend service.
Denotes significance over laptop/desktop at the 95% confidence interval
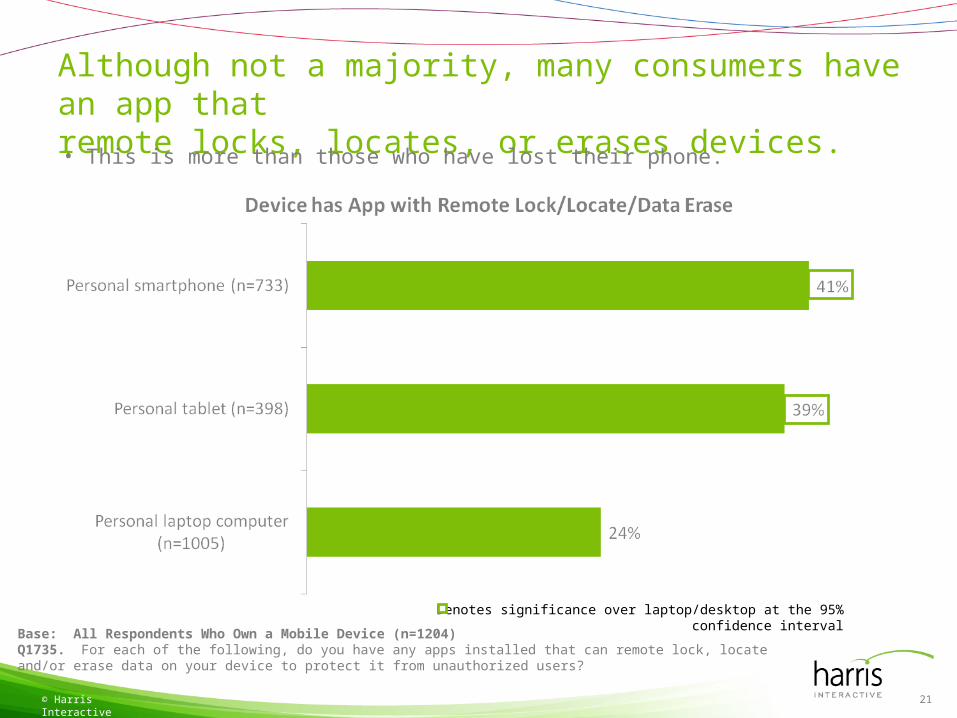
Although not a majority, many consumers have an app that remote locks, locates, or erases devices.
© Harris Interactive
Base: All Respondents Who Own a Mobile Device (n=1204)Q1735. For each of the following, do you have any apps installed that can remote lock, locate and/or erase data on your device to protect it from unauthorized users?
21
• This is more than those who have lost their phone.
Denotes significance over laptop/desktop at the 95% confidence interval
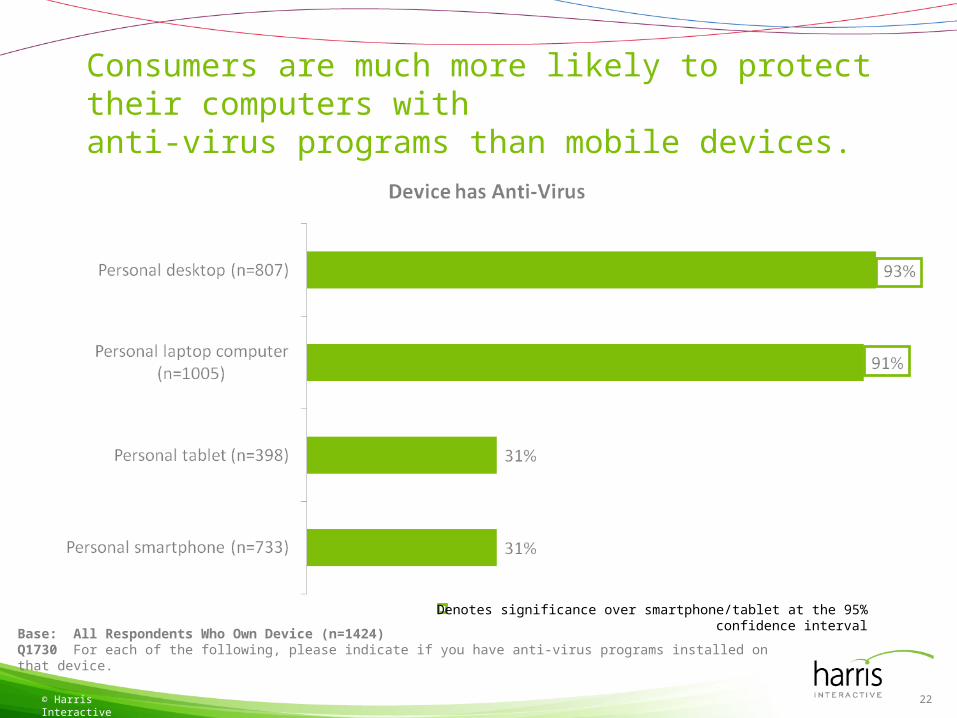
Consumers are much more likely to protect their computers withanti-virus programs than mobile devices.
© Harris Interactive
Base: All Respondents Who Own Device (n=1424)Q1730 For each of the following, please indicate if you have anti-virus programs installed on that device.
22
Denotes significance over smartphone/tablet at the 95% confidence interval
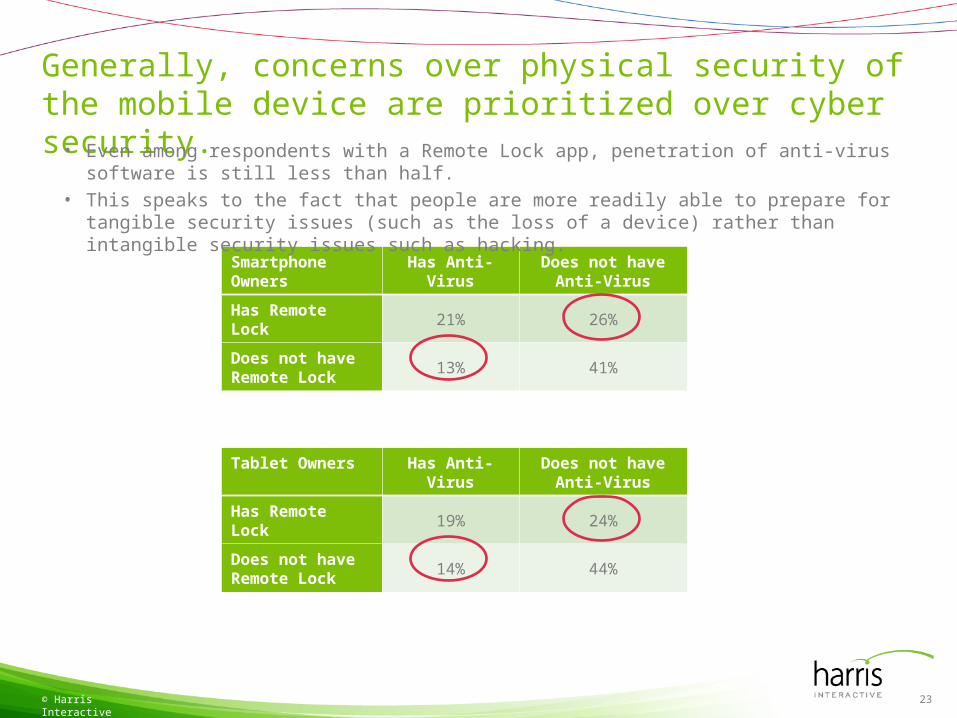
Generally, concerns over physical security of the mobile device are prioritized over cyber security.
© Harris Interactive
Smartphone Owners Has Anti-Virus Does not have Anti-Virus
Has Remote Lock 21% 26%
Does not have Remote Lock 13% 41%
Tablet Owners Has Anti-Virus Does not have Anti-Virus
Has Remote Lock 19% 24%
Does not have Remote Lock 14% 44%
• Even among respondents with a Remote Lock app, penetration of anti-virus software is still less than half.• This speaks to the fact that people are more readily able to prepare for tangible security issues (such as the
loss of a device) rather than intangible security issues such as hacking.
23
Consumers generally want to do what is needed to protect their devices but don’t know specifically how.
© Harris Interactive
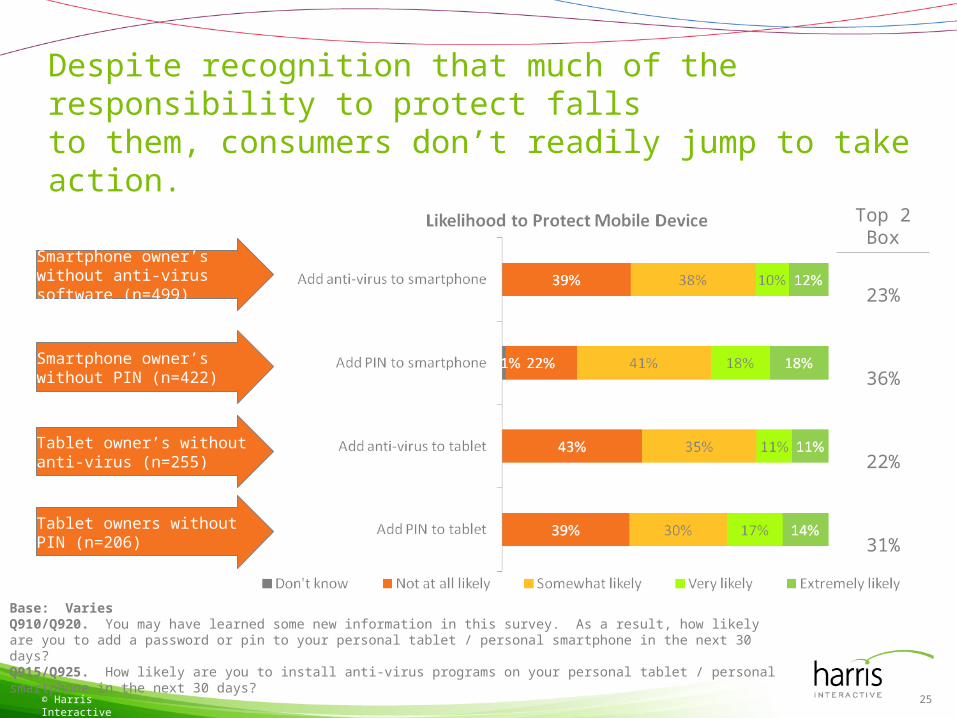
Despite recognition that much of the responsibility to protect fallsto them, consumers don’t readily jump to take action.
© Harris Interactive
Base: Varies Q910/Q920. You may have learned some new information in this survey. As a result, how likely are you to add a password or pin to your personal tablet / personal smartphone in the next 30 days?Q915/Q925. How likely are you to install anti-virus programs on your personal tablet / personal smartphone in the next 30 days?
Smartphone owner’s without anti-virus software (n=499)
Smartphone owner’s without PIN (n=422)
Tablet owner’s without anti-virus (n=255)
Tablet owners without PIN (n=206)
Top 2 Box
23%
36%
22%
31%
25
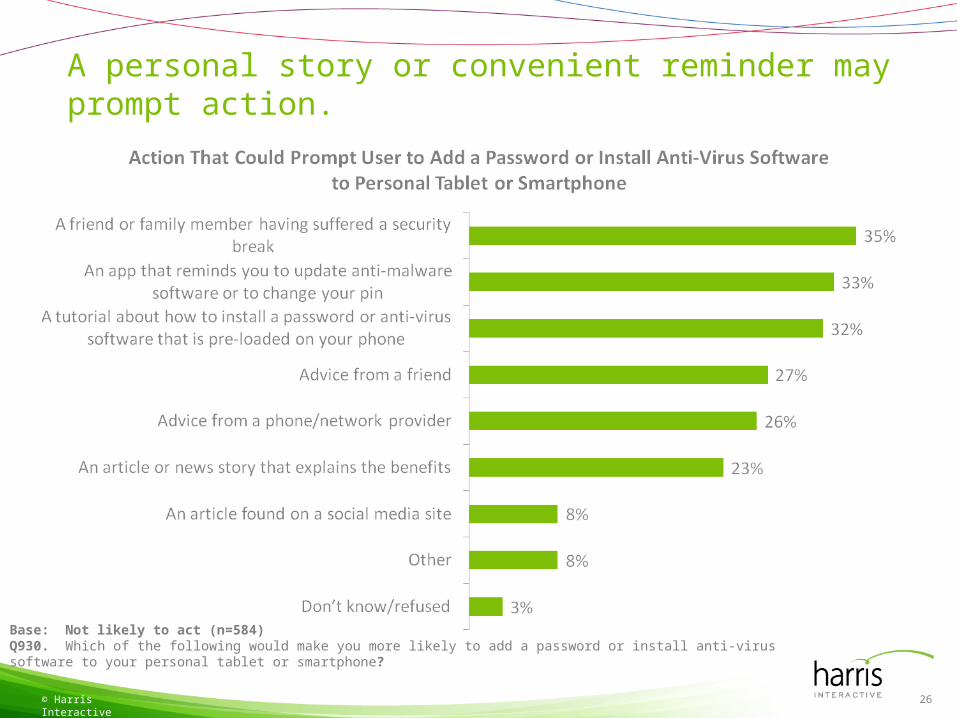
A personal story or convenient reminder may prompt action.
© Harris Interactive
Base: Not likely to act (n=584)Q930. Which of the following would make you more likely to add a password or install anti-virus software to your personal tablet or smartphone?
26
Industry viewed as best equipped to write legislation.
© Harris Interactive
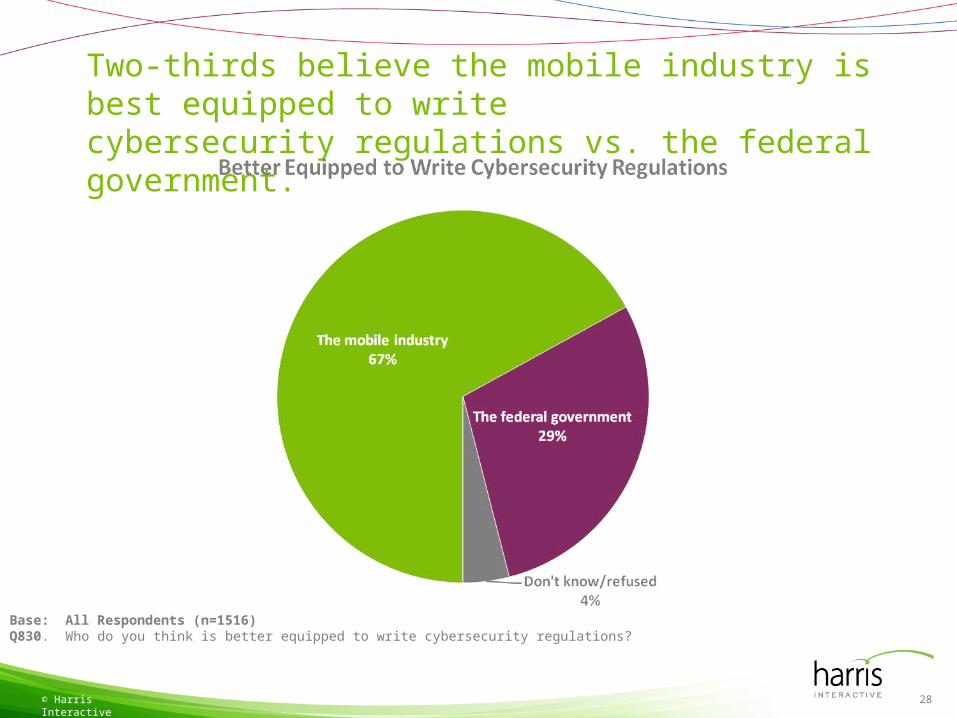
Two-thirds believe the mobile industry is best equipped to write cybersecurity regulations vs. the federal government.
© Harris Interactive
Base: All Respondents (n=1516)Q830. Who do you think is better equipped to write cybersecurity regulations?
28
Those who lose or have devices stolen are by definition a vulnerable target for cyber threats. Given this, they should be inclined to take more precautions than those who don’t, but they donot appear to be.
© Harris Interactive
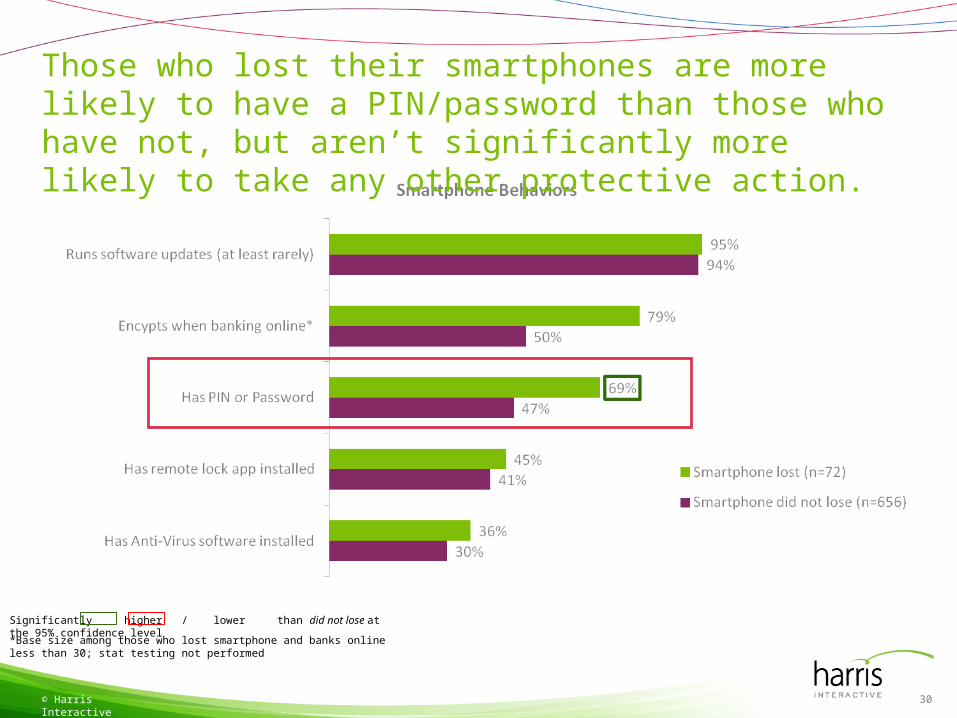
Those who lost their smartphones are more likely to have a PIN/password than those who have not, but aren’t significantly more likely to take any other protective action.
© Harris Interactive
Significantly higher / lower than did not lose at the 95% confidence level
*Base size among those who lost smartphone and banks online less than 30; stat testing not performed
30
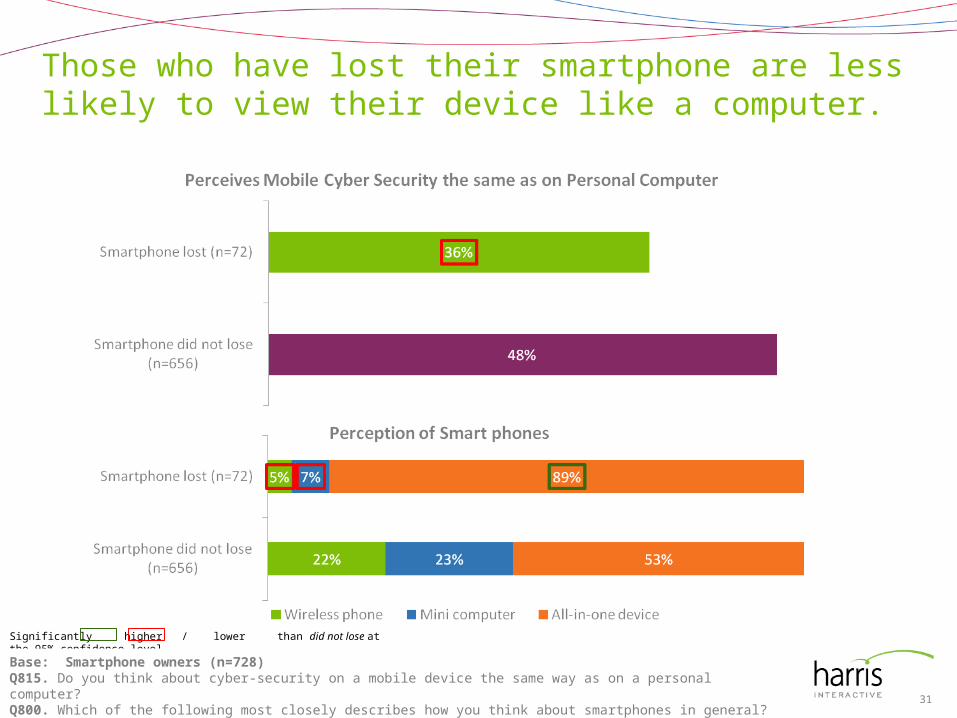
Those who have lost their smartphone are less likely to view their device like a computer.
© Harris Interactive
Significantly higher / lower than did not lose at the 95% confidence level
Base: Smartphone owners (n=728)Q815. Do you think about cyber-security on a mobile device the same way as on a personal computer?Q800. Which of the following most closely describes how you think about smartphones in general? 31
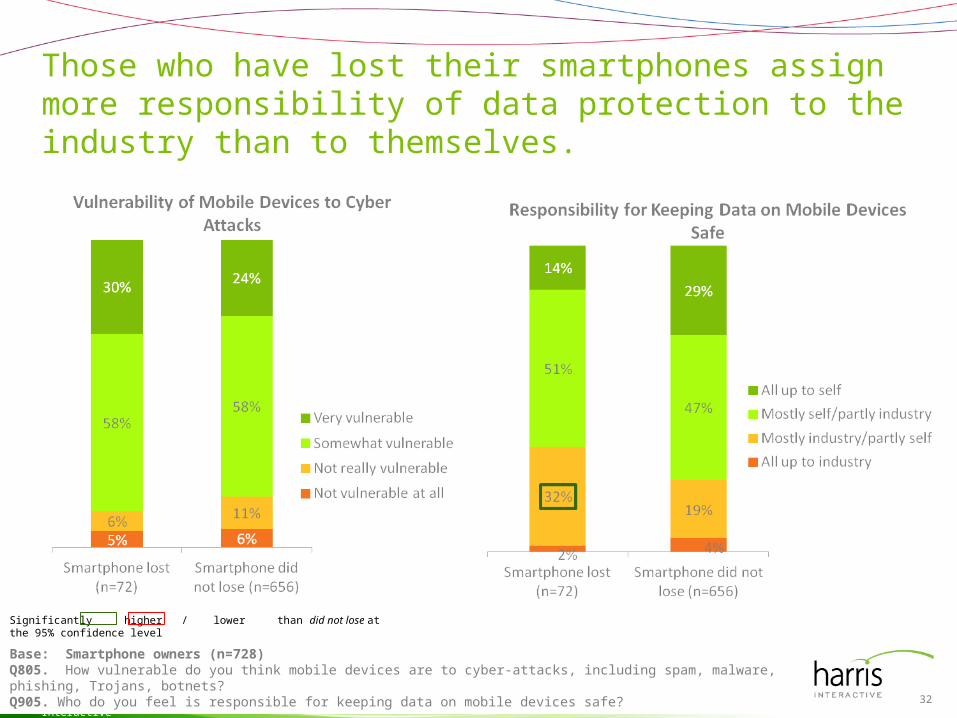
Those who have lost their smartphones assign more responsibility of data protection to the industry than to themselves.
© Harris Interactive
Base: Smartphone owners (n=728)Q805. How vulnerable do you think mobile devices are to cyber-attacks, including spam, malware, phishing, Trojans, botnets?Q905. Who do you feel is responsible for keeping data on mobile devices safe?
Significantly higher / lower than did not lose at the 95% confidence level
32
Appendix
© Harris Interactive
© Harris Interactive 34
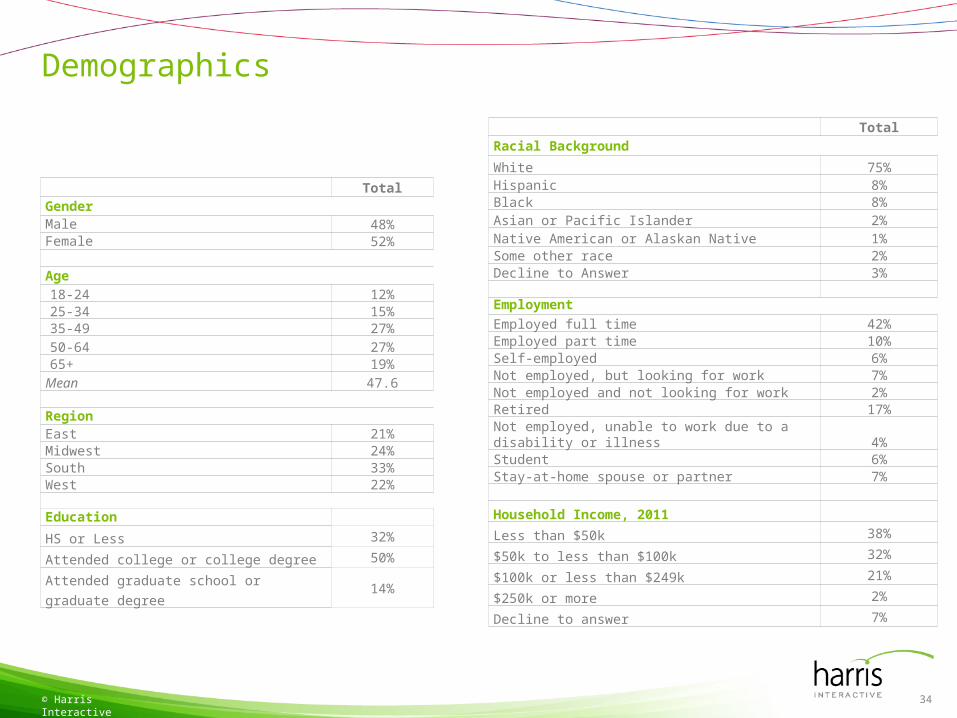
TotalGenderMale 48%Female 52%
Age18-24 12%25-34 15%35-49 27%50-64 27%65+ 19%Mean 47.6
RegionEast 21%Midwest 24%South 33%West 22%
Education
HS or Less 32%
Attended college or college degree 50%
Attended graduate school or graduate degree 14%
TotalRacial Background
White 75%Hispanic 8%Black 8%Asian or Pacific Islander 2%Native American or Alaskan Native 1%Some other race 2%Decline to Answer 3%
EmploymentEmployed full time 42%Employed part time 10%Self-employed 6%Not employed, but looking for work 7%Not employed and not looking for work 2%Retired 17%Not employed, unable to work due to a disability or illness 4%Student 6%Stay-at-home spouse or partner 7%
Household Income, 2011
Less than $50k 38%
$50k to less than $100k 32%
$100k or less than $249k 21%
$250k or more 2%
Decline to answer 7%
Demographics