Embed Size (px)
Citation preview

1
Continuity Equations: Analytical Monitoring of Business Processes and
Anomaly Detection in Continuous Auditing
Michael G. AllesAlexander Kogan
Miklos A. VasarhelyiJia Wu
Rutgers University Nov, 2005

2
Data-oriented CA: Automation of Substantive Testing
• Formalization of BP rules as data integrity constraints.
• Verification of data integrity identification of exceptions.
• Selection of critical BP metrics and development of stable business flow (continuity) equations.
• Monitoring of continuity equation residuals identification of anomalies.
3
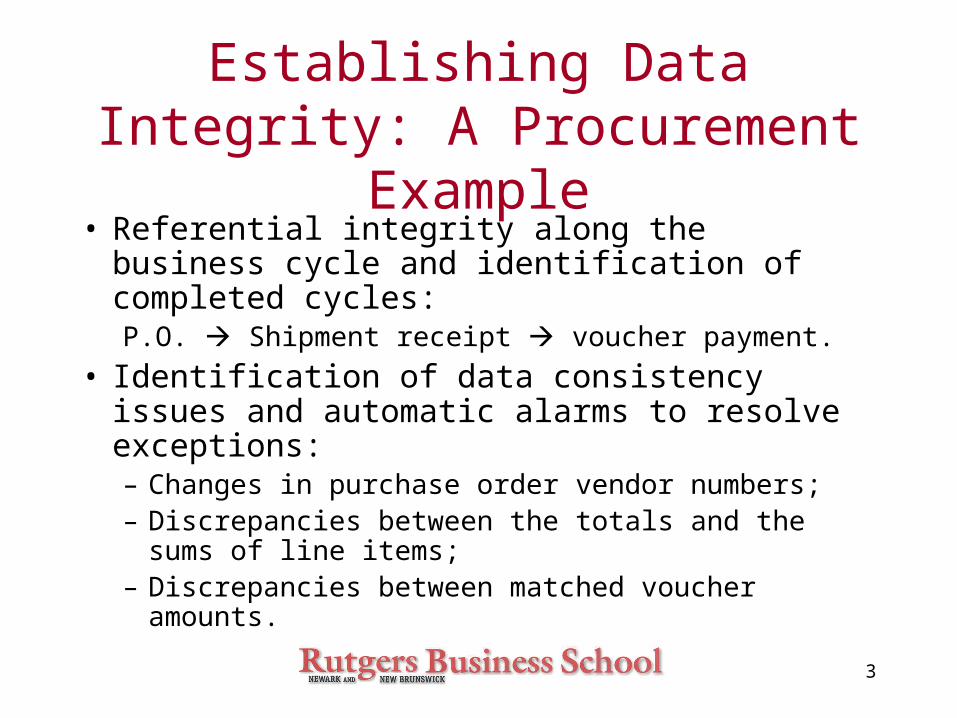
Establishing Data Integrity: A Procurement Example
• Referential integrity along the business cycle and identification of completed cycles:P.O. Shipment receipt voucher payment.
• Identification of data consistency issues and automatic alarms to resolve exceptions:– Changes in purchase order vendor numbers;– Discrepancies between the totals and the sums of
line items;– Discrepancies between matched voucher
amounts.

4
Detection of Exceptions
• Referential integrity violations– PO without matching requisition– Received item without matching PO– Payments without matching received items
• Data integrity violations– PO has zero order quantity– Received item has negative quantity– Invalid payment check numbers (e.g. All 0s)– Gross payment amount is smaller than net
payment amount

5
Advanced Analytics in CA: BP Modeling Using Continuity Equations
• Continuity equations:– Statistical models capturing relationships between
various business processes.– Can be used as expectation models in the
analytical procedures of continuous auditing.– Originated in physical sciences (various
conservation laws: e.g. Mass, momentum).• Continuity equations are developed using the
methodologies of: – Simultaneous equation modeling (SEM);– Multivariate time series modeling (MTSM).

6
Basic Procurement Cycle
P.O.(t1)
Receive(t2)
Voucher(t3)
t2-t1
t3-t2

7
Continuity Equations of Basic Procurement Cycle
Receive(t2)= P.O.(t1)
Voucher(t3)= Receive(t2)
• Aren’t partial deliveries allowed?
• Are all orders delivered after exactly the same time lag?
• Are there any feedback loops?

8
P.O.(t)= 0.24*P.O.(t-4) + 0.25*P.O.(t-14)+ 0.56*Receive(t-15) + εPO
Receive(t)= 0.26*P.O.(t-4) + 0.21*P.O.(t-6)+ 0.60*Voucher(t-10) + εR
Voucher(t)=0.73*Receive(t-1) - 0.25*P.O.(t-7) + 0.22*P.O.(t-17)t-17 + 0.24*Receive(t-17) + εV
Inferred Analytical Model of Procurement

9
Detection of Anomalies
• Anomalies are detected if:– Observed P.O.(t) < Predicted P.O.(t) - Var
or– Observed P.O.(t) > Predicted P.O.(t) + Var
• Similarly for:– Receive(t)– Voucher(t)
• Var = acceptable threshold of variance.• If there is anomaly generate alarm!

10
Steps of Analytical Modeling and Monitoring Using Continuity
Equations• Choose essential business processes to
model (purchasing, payments, etc.).• Define (physical, financial, etc.) metrics to
represent each process: e.g., $ Amount of purchase orders, quantity of items received, number of payment vouchers processed.
• Choose the levels of aggregation of metrics:– By time (hourly, daily, weekly), by business unit,
by customer or vendor, by type of products or services, etc.

11
Steps of Analytical Modeling and Monitoring Using Continuity Equations -
II• Identify and estimate stable statistical
relationships between business process metrics – Continuity Equations (CEs).
• Define acceptable thresholds of variance from the expected relationships.
• If the variances (residuals) exceed the acceptable levels, alarm human auditors to investigate the anomaly (i.e., the relevant sub-population of transactions).

12
How Do We Evaluate CE Models?
• Linear Regression Model is the classical benchmark for comparison.
• Models are compared on two aspects:– Prediction Accuracy.– Anomaly Detection Capability.
• Mean Absolute Percentage Error (MAPE) is used to measure prediction accuracy.– MAPE = Abs (predicted value – actual value) / (actual
value) * 100%– A good analytical model is expected to have high
prediction accuracy, or low MAPE.

13
Prediction Accuracy Comparison: Results Analysis
• Prediction accuracy comparison results:– Linear regression (best).– Multivariate Time Series (middle).– Simultaneous Equations (worst).
• Difference is small (<2%).• Noise in our data sets may pollute the results.• Prediction accuracy is relatively good for all
three models:– MAPE is around 0.40 (Leitch and Chen 2003).– Other studies report over 100% MAPE.

14
Simulating Error Stream: The Ultimate Test of CA Analytics
• Seed errors of various magnitude into randomly chosen subset of the holdout sample.
• Identify anomalies as those observations in the holdout sample for which the variance exceeds the acceptable threshold of variance.
• Test whether anomalies are the observations with seeded errors, and count the number of false positives and false negatives.
• Repeat this simulation several times by choosing different random subsets to seed errors into.

15
Acceptable Threshold of Variance
• What to use as acceptable threshold of variance?– Prediction Interval
• Confidence interval for the predicted variable value.
– Anomalies are detected if: • Value in the observation < lower confidence limit,
or
• Value in the observation > upper confidence limit.

16
Error Seeding Procedure
• To simulate an anomaly detection scenario, we seed errors into the hold-out data set (47 obs.):– Original anomalies are detected before error seeding.– Errors are seeded into 8 randomly-selected observations
which do not have original anomalies.– 5 different error magnitudes are used for each round of
error seeding respectively. (10%, 50%, 100%, 200% and 400% of actual value of the seeded observation).
• The above procedure is repeated 10 times to reduce the variance of the results.

17
Measuring Anomaly Detection• False positive error (false alarm, Type I error): A non-
anomaly mistakenly detected by the model as an anomaly. Decreases efficiency.
• False negative error (Type II error): An anomaly failed to be detected by the model. Decreases effectiveness.
• Detection rate is used for clear presentation purpose: The rate of successful detection of seeded errors.
Detection rate = 1 – False Negative Error Rate
• A good analytical model is expected to have good anomaly detection capability: low false negative error rate (i.e. high detection rate) and low false positive error rate.

18
Simulated Error Correction
• CA makes it possible to investigate a detected anomaly in (nearly) real-time.
• Anomaly investigation can likely correct a detected problem in (nearly) real-time.
• Real-time problem correction results in utilizing the actual (not erroneous) values in analytical BP models for future predictions.
• Real-time error correction is likely to benefit future anomaly detection, and the magnitude of this benefit can be evaluated using simulation.

19
Benefit of Real-time Error Correction: MTSM
0.00%
20.00%
40.00%
60.00%
80.00%
100.00%
120.00%
10%E 50%E 100%E 200%E 400%E
MTSM_Error_Correction MTSM_No_Error_Correction

20
Anomaly Detection Rate Comparison: Results
0.00%
20.00%
40.00%
60.00%
80.00%
100.00%
120.00%
10%E 50%E 100%E 200%E 400%E
SEM MTSM Linear_Regression

21
False Positive Error ComparisonError Magnitude Simultaneous
Equations
Multivariate
Time Series
Linear Regression
10% 0 0 0
50% 0 0 0
100% 0 0 0
200% 0 0 0
400% 0 0 0

22
Anomaly Detection Rate Comparison: Results Analysis
• SEM and MTSM outperform the linear regression model when the error magnitudes are large, even though linear regression has slightly better detection rate when the error magnitudes are small.
• It is more important to detect material errors than non-material errors.

23
Concluding Remarks
• New CA-enabled analytical audit methodology: simultaneous relationships between highly disaggregated BP metrics.
• How to automate the inference and estimation of numerous CE models?
• How to identify and remove outliers from the historical data to estimate statistically valid CEs (step-wise re-estimation of CEs)?
• How to identify the need to re-estimate a CE model (trends in residuals)?
• How to make it worthwhile (trade-off between effectiveness, efficiency and timeliness)?
• Any patterns for detected errors?