Embed Size (px)
Citation preview
1 | © Continental AG
EDMR – Equity and Debt Markets RelationsBaader Bank Roadshow Munich, September 27, 2013
Baader Bank RoadshowMunich, September 27, 2013
Rolf WollerHead of Investor Relations

2 | © Continental AG
EDMR – Equity and Debt Markets RelationsBaader Bank Roadshow Munich, September 27, 2013
AGENDA
Corporation Highlights
Automotive Group
Rubber Group
Indebtedness and Cash Flow
Outlook
Back-up & Fact Sheets 2011 – H1
2013
4)
1)
5)
2)
3)
6)
3 | © Continental AG
EDMR – Equity and Debt Markets RelationsBaader Bank Roadshow Munich, September 27, 2013
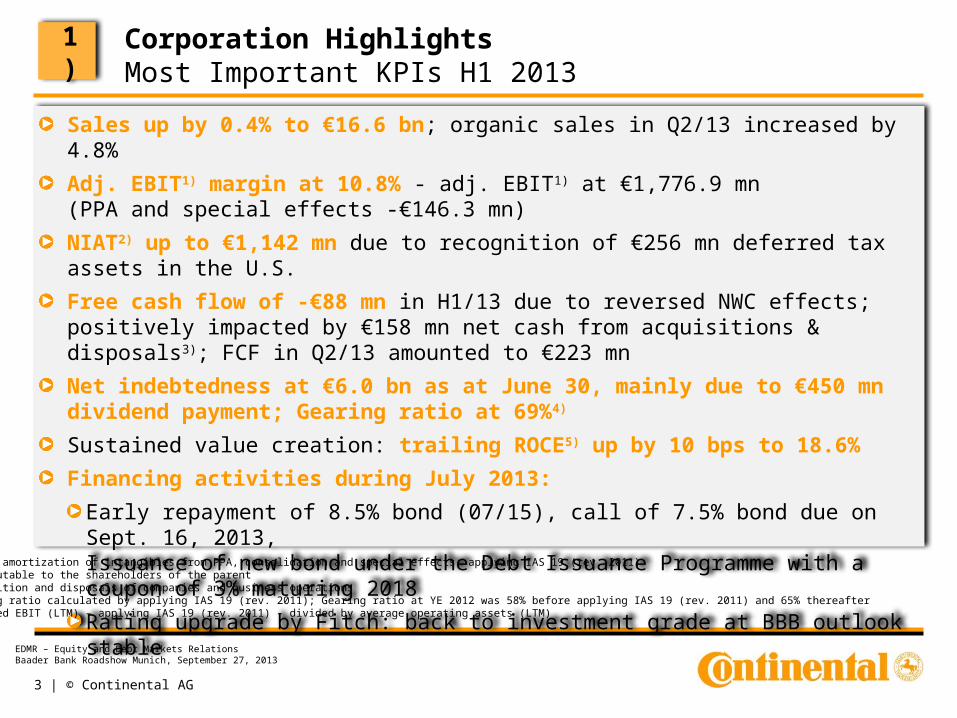
Corporation HighlightsMost Important KPIs H1 2013
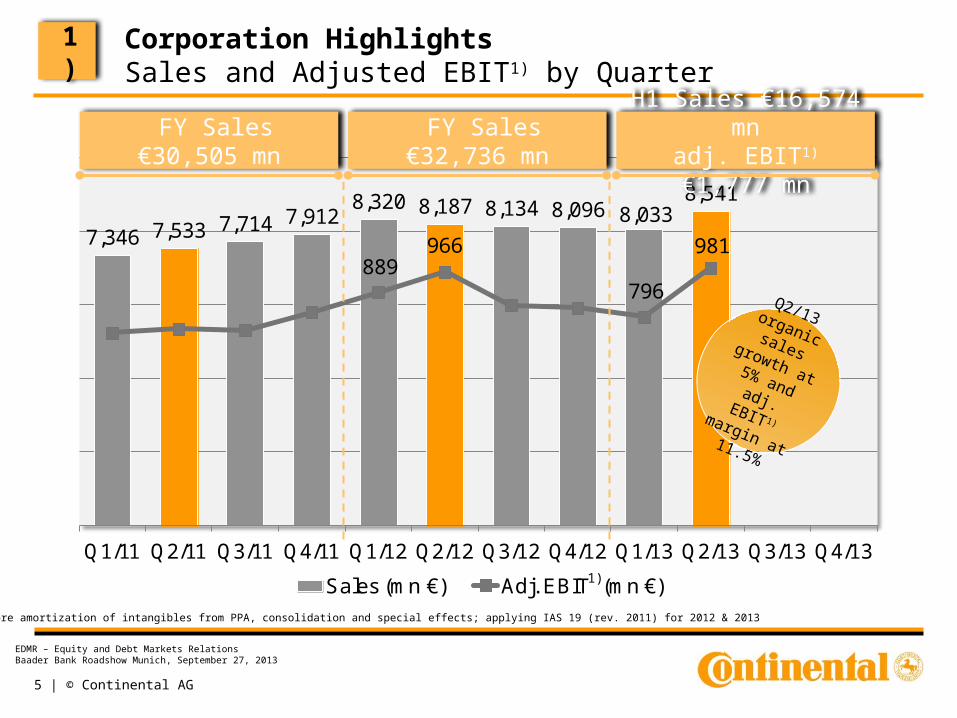
Sales up by 0.4% to €16.6 bn; organic sales in Q2/13 increased by 4.8%
Adj. EBIT1) margin at 10.8% - adj. EBIT1) at €1,776.9 mn(PPA and special effects -€146.3 mn)
NIAT2) up to €1,142 mn due to recognition of €256 mn deferred tax assets in the U.S.
Free cash flow of -€88 mn in H1/13 due to reversed NWC effects; positively impacted by €158 mn net cash from acquisitions & disposals3); FCF in Q2/13 amounted to €223 mn
Net indebtedness at €6.0 bn as at June 30, mainly due to €450 mn dividend payment; Gearing ratio at 69%4)
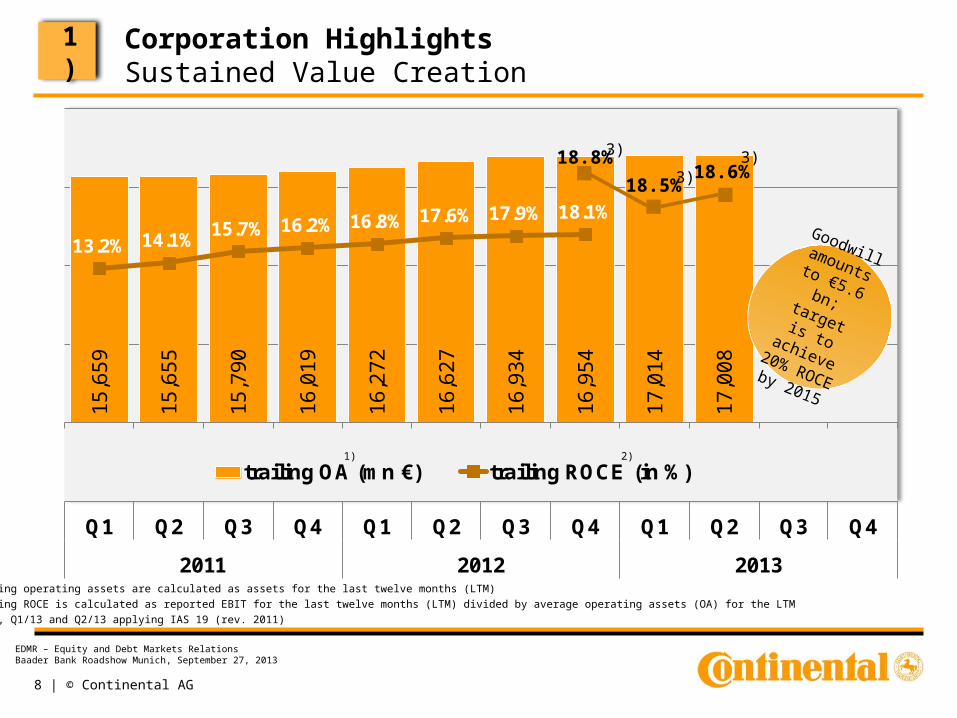
Sustained value creation: trailing ROCE5) up by 10 bps to 18.6%
Financing activities during July 2013:
Early repayment of 8.5% bond (07/15), call of 7.5% bond due on Sept. 16, 2013, Issuance of new bond under the Debt Issuance Programme with a coupon of 3% maturing 2018
Rating upgrade by Fitch: back to investment grade at BBB outlook stable
1)Before amortization of intangibles from PPA, consolidation and special effects; applying IAS 19 (rev. 2011)2)Attributable to the shareholders of the parent 3)Acquisition and disposals of companies and business operations4)Gearing ratio calculated by applying IAS 19 (rev. 2011); Gearing ratio at YE 2012 was 58% before applying IAS 19 (rev. 2011) and 65% thereafter5)Reported EBIT (LTM) – applying IAS 19 (rev. 2011) – divided by average operating assets (LTM)
1)
4 | © Continental AG
EDMR – Equity and Debt Markets RelationsBaader Bank Roadshow Munich, September 27, 2013
Aut
omot
ive
Gro
upR
ubbe
r G
roup
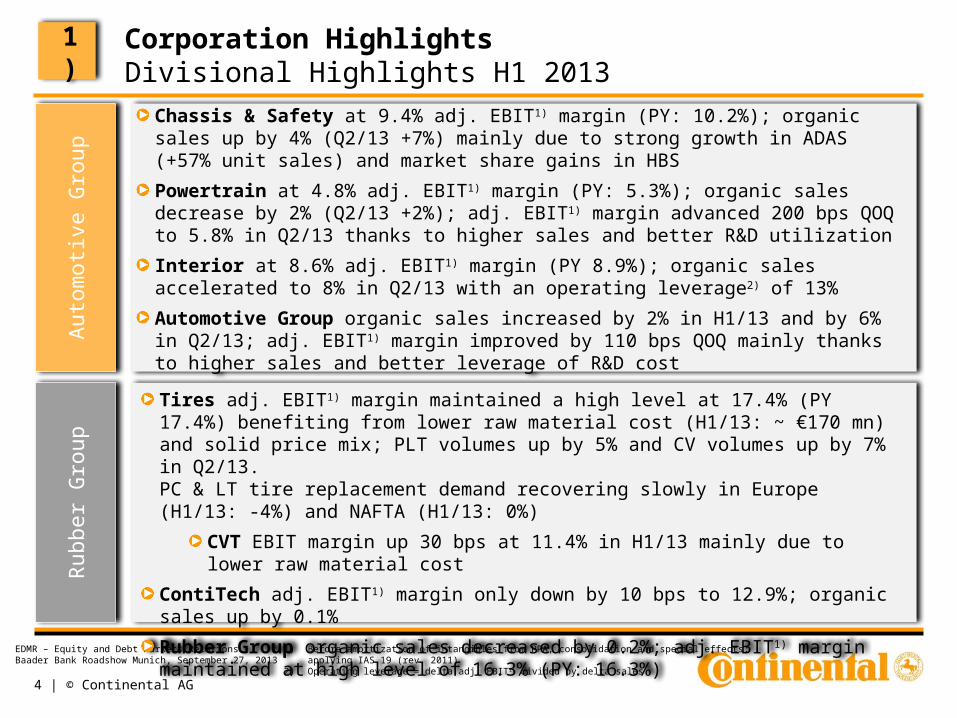
Tires adj. EBIT1) margin maintained a high level at 17.4% (PY 17.4%) benefiting from lower raw material cost (H1/13: ~ €170 mn) and solid price mix; PLT volumes up by 5% and CV volumes up by 7% in Q2/13. PC & LT tire replacement demand recovering slowly in Europe (H1/13: -4%) and NAFTA (H1/13: 0%)
CVT EBIT margin up 30 bps at 11.4% in H1/13 mainly due to lower raw material cost
ContiTech adj. EBIT1) margin only down by 10 bps to 12.9%; organic sales up by 0.1%
Rubber Group organic sales decreased by 0.2%; adj. EBIT1) margin maintained at high level of 16.3% (PY: 16.3%)
Corporation HighlightsDivisional Highlights H1 2013
1) Before amortization of intangibles from PPA, consolidation and special effects; applying IAS 19 (rev. 2011)
2) Operating leverage = delta adj. EBIT1) divided by delta sales
Chassis & Safety at 9.4% adj. EBIT1) margin (PY: 10.2%); organic sales up by 4% (Q2/13 +7%) mainly due to strong growth in ADAS (+57% unit sales) and market share gains in HBS
Powertrain at 4.8% adj. EBIT1) margin (PY: 5.3%); organic sales decrease by 2% (Q2/13 +2%); adj. EBIT1) margin advanced 200 bps QOQ to 5.8% in Q2/13 thanks to higher sales and better R&D utilization
Interior at 8.6% adj. EBIT1) margin (PY 8.9%); organic sales accelerated to 8% in Q2/13 with an operating leverage2) of 13%
Automotive Group organic sales increased by 2% in H1/13 and by 6% in Q2/13; adj. EBIT1) margin improved by 110 bps QOQ mainly thanks to higher sales and better leverage of R&D cost
1)
5 | © Continental AG
EDMR – Equity and Debt Markets RelationsBaader Bank Roadshow Munich, September 27, 2013
7,346 7,533 7,714 7,9128,320 8,187 8,134 8,096 8,033
8,541
889966
796
981
Q1/11 Q2/11 Q3/11 Q4/11 Q1/12 Q2/12 Q3/12 Q4/12 Q1/13 Q2/13 Q3/13 Q4/13
Sales (mn €) Adj. EBIT (mn €)
FY Sales €30,505 mn
Corporation HighlightsSales and Adjusted EBIT1) by Quarter
1) Before amortization of intangibles from PPA, consolidation and special effects; applying IAS 19 (rev. 2011) for 2012 & 2013
H1 Sales €16,574 mnadj. EBIT1) €1,777 mn
Q2/13 organic sales growth at 5% and
adj. EBIT 1) margin at 11.5%
1)
1)
FY Sales €32,736 mn
6 | © Continental AG
EDMR – Equity and Debt Markets RelationsBaader Bank Roadshow Munich, September 27, 2013
4,5
18
4,5
53
4,6
05
4,6
78 5,0
71
4,9
37
4,7
64
4,7
33
4,9
11 5,1
60
412 415351
430
Q1
/11
Q2
/11
Q3
/11
Q4
/11
Q1
/12
Q2
/12
Q3
/12
Q4
/12
Q1
/13
Q2
/13
Q3
/13
Q4
/13
Sales (mn €) Adj. EBIT (mn €)
2,8
34
2,9
87
3,1
16
3,2
41
3,2
55
3,2
56
3,3
78
3,3
72
3,1
32
3,3
92
496566
476
570
Q1
/11
Q2
/11
Q3
/11
Q4
/11
Q1
/12
Q2
/12
Q3
/12
Q4
/12
Q1
/13
Q2
/13
Q3
/13
Q4
/13
Sales (mn €) Adj. EBIT (mn €)
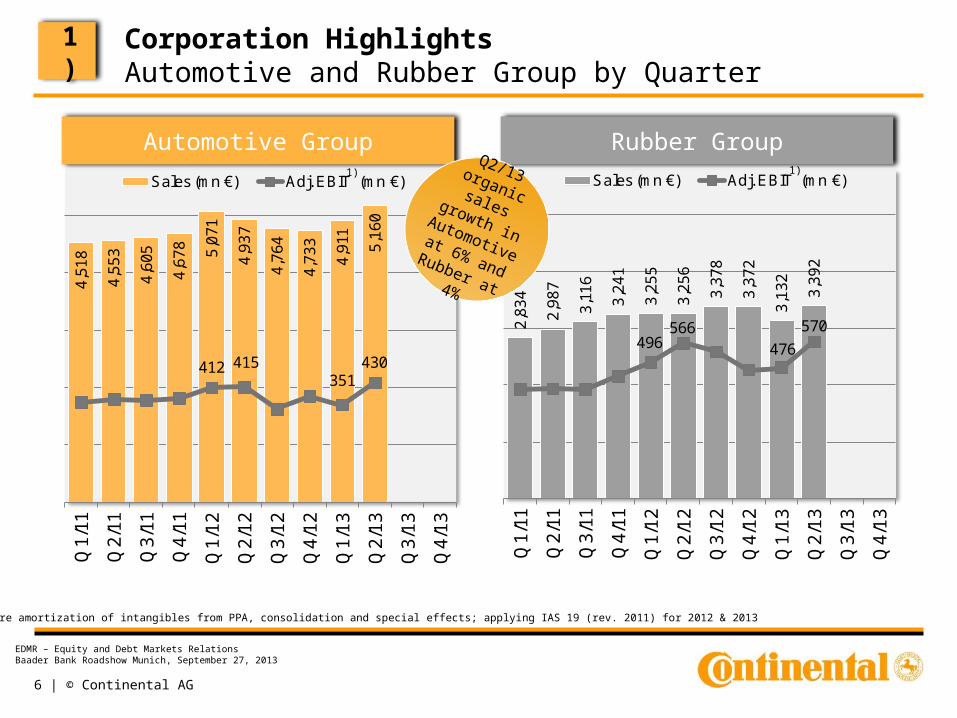
Corporation HighlightsAutomotive and Rubber Group by Quarter
Automotive Group Rubber Group
1) Before amortization of intangibles from PPA, consolidation and special effects; applying IAS 19 (rev. 2011) for 2012 & 2013
1)
1) 1)Q2/13 organic sales growth
in Automotive at 6% and
Rubber at 4%
7 | © Continental AG
EDMR – Equity and Debt Markets RelationsBaader Bank Roadshow Munich, September 27, 2013
-2
8
2
Replacement tire volume
growth NAFTA
Replacement tire volume
growth Europe
CommercialVehicle Tires
unit sales growth
-2
1
2
PC & LT prod.growth EU/NAFTA
PC & LT prod. growth ww
Conti AutomotiveGroup org.
sales growth
Co
nti
Market
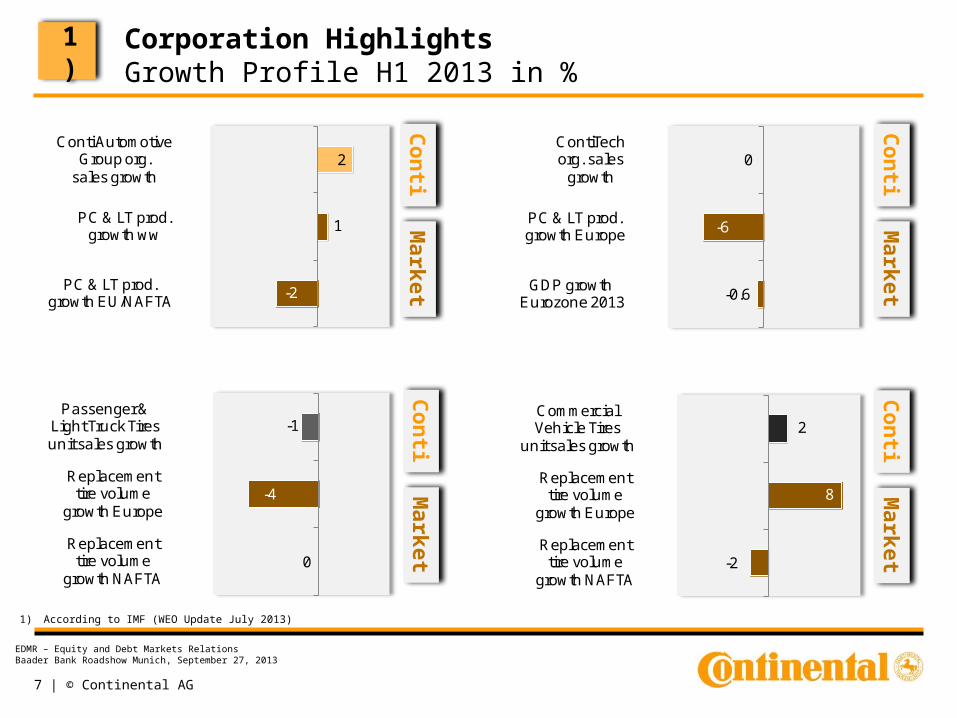
Corporation HighlightsGrowth Profile H1 2013 in %
Co
nti
Market
Co
nti
Market
1) According to IMF (WEO Update July 2013)
1)
1)
Co
nti
Market0
-4
-1
Replacement tire volume
growth NAFTA
Replacement tire volume
growth Europe
Passenger & Light Truck Tires unit sales growth
-0.6
-6
0
GDP growthEurozone 2013
PC & LT prod.growth Europe
ContiTechorg. sales
growth
8 | © Continental AG
EDMR – Equity and Debt Markets RelationsBaader Bank Roadshow Munich, September 27, 2013
15
,65
9
15
,65
5
15
,79
0
16
,01
9
16
,27
2
16
,62
7
16
,93
4
16
,95
4
17
,01
4
17
,00
8
13.2% 14.1%15.7% 16.2% 16.8% 17.6% 17.9% 18.1%
Q1 Q2 Q3 Q4 Q1 Q2 Q3 Q4 Q1 Q2 Q3 Q4
2011 2012 2013
trailing OA (mn €) trailing ROCE (in %)
Goodwill amounts to €5.6 bn; target is to achieve 20% ROCE
by 2015
Corporation HighlightsSustained Value Creation
1) Trailing operating assets are calculated as assets for the last twelve months (LTM)
2) Trailing ROCE is calculated as reported EBIT for the last twelve months (LTM) divided by average operating assets (OA) for the LTM
3) Q4/12, Q1/13 and Q2/13 applying IAS 19 (rev. 2011)
1)
1) 2)
18.8%
18.5%
3)
3) 18.6%3)
9 | © Continental AG
EDMR – Equity and Debt Markets RelationsBaader Bank Roadshow Munich, September 27, 2013
1)
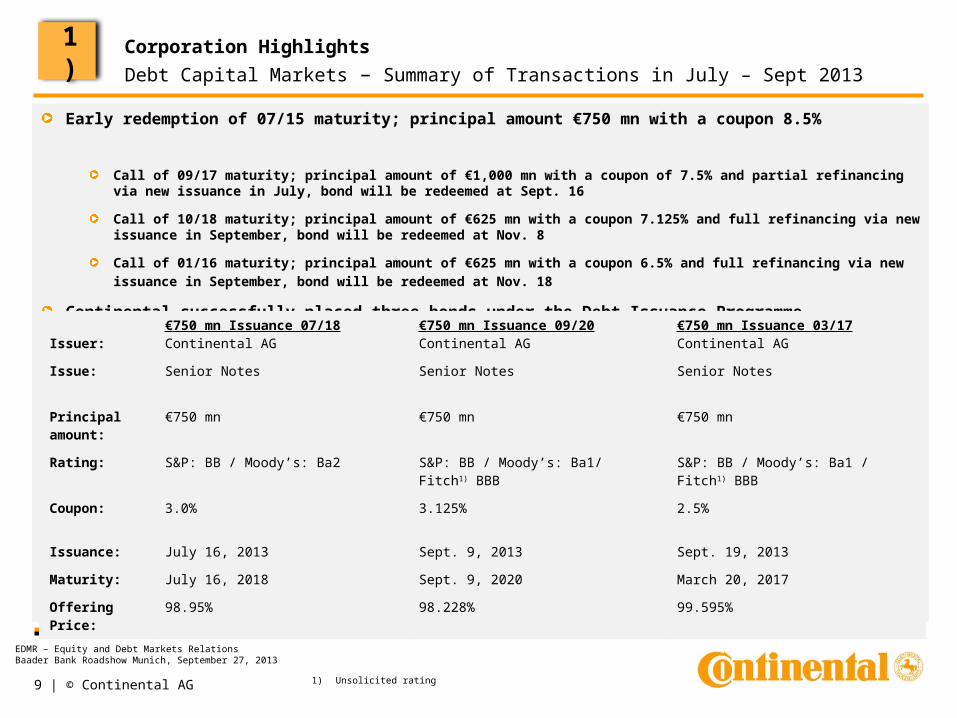
Early redemption of 07/15 maturity; principal amount €750 mn with a coupon 8.5%
Call of 09/17 maturity; principal amount of €1,000 mn with a coupon of 7.5% and partial refinancing via new issuance in July, bond will be redeemed at Sept. 16
Call of 10/18 maturity; principal amount of €625 mn with a coupon 7.125% and full refinancing via new issuance in September, bond will be redeemed at Nov. 8
Call of 01/16 maturity; principal amount of €625 mn with a coupon 6.5% and full refinancing via new issuance in September,
bond will be redeemed at Nov. 18
Continental successfully placed three bonds under the Debt Issuance Programme
Issuances will reduce interest expenses and improve Continental’s maturity profile
Issuer:€750 mn Issuance 07/18Continental AG
€750 mn Issuance 09/20Continental AG
€750 mn Issuance 03/17Continental AG
Issue: Senior Notes Senior Notes Senior Notes
Principal amount:
€750 mn €750 mn €750 mn
Rating: S&P: BB / Moody’s: Ba2 S&P: BB / Moody’s: Ba1/ Fitch1) BBB S&P: BB / Moody’s: Ba1 / Fitch1) BBB
Coupon: 3.0% 3.125% 2.5%
Issuance: July 16, 2013 Sept. 9, 2013 Sept. 19, 2013
Maturity: July 16, 2018 Sept. 9, 2020 March 20, 2017
Offering Price: 98.95% 98.228% 99.595%
Corporation HighlightsDebt Capital Markets – Summary of Transactions in July – Sept 2013
1) Unsolicited rating
10 | © Continental AG
EDMR – Equity and Debt Markets RelationsBaader Bank Roadshow Munich, September 27, 2013
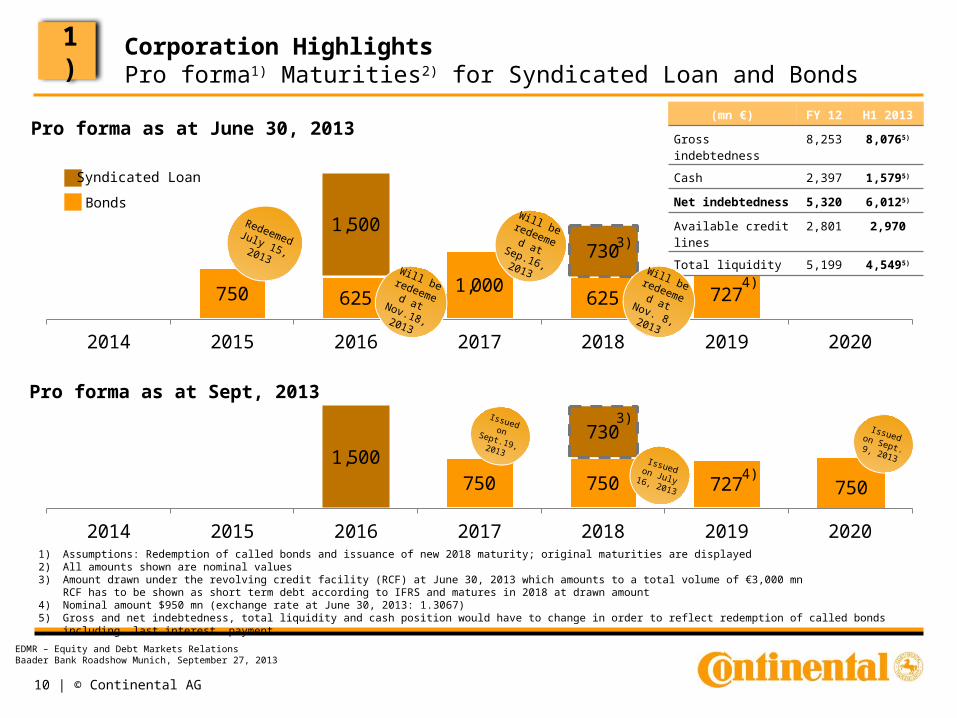
750 750 727 750
1,500730
2014 2015 2016 2017 2018 2019 2020
750 6251,000
625 727
1,500
730
2014 2015 2016 2017 2018 2019 2020
1) Assumptions: Redemption of called bonds and issuance of new 2018 maturity; original maturities are displayed2) All amounts shown are nominal values3) Amount drawn under the revolving credit facility (RCF) at June 30, 2013 which amounts to a total volume of €3,000 mn
RCF has to be shown as short term debt according to IFRS and matures in 2018 at drawn amount4) Nominal amount $950 mn (exchange rate at June 30, 2013: 1.3067)5) Gross and net indebtedness, total liquidity and cash position would have to change in order to reflect redemption of called bonds including last interest payment
Corporation HighlightsPro forma1) Maturities2) for Syndicated Loan and Bonds
Syndicated Loan
Bonds
(mn €) FY 12 H1 2013
Gross indebtedness 8,253 8,0765)
Cash 2,397 1,5795)
Net indebtedness 5,320 6,0125)
Available credit lines 2,801 2,970
Total liquidity 5,199 4,5495)
3)
4)
1)
Redeemed July 15, 2013
Will be redeemed at Sep.16, 2013
Issued on Sept. 9, 2013
Will be redeemed at Nov. 8, 2013
Will be redeemed at Nov.18, 2013
Issued on Sept.19, 2013Issued on July 16, 2013
3)
4)
Pro forma as at June 30, 2013
Pro forma as at Sept, 2013
11 | © Continental AG
EDMR – Equity and Debt Markets RelationsBaader Bank Roadshow Munich, September 27, 2013
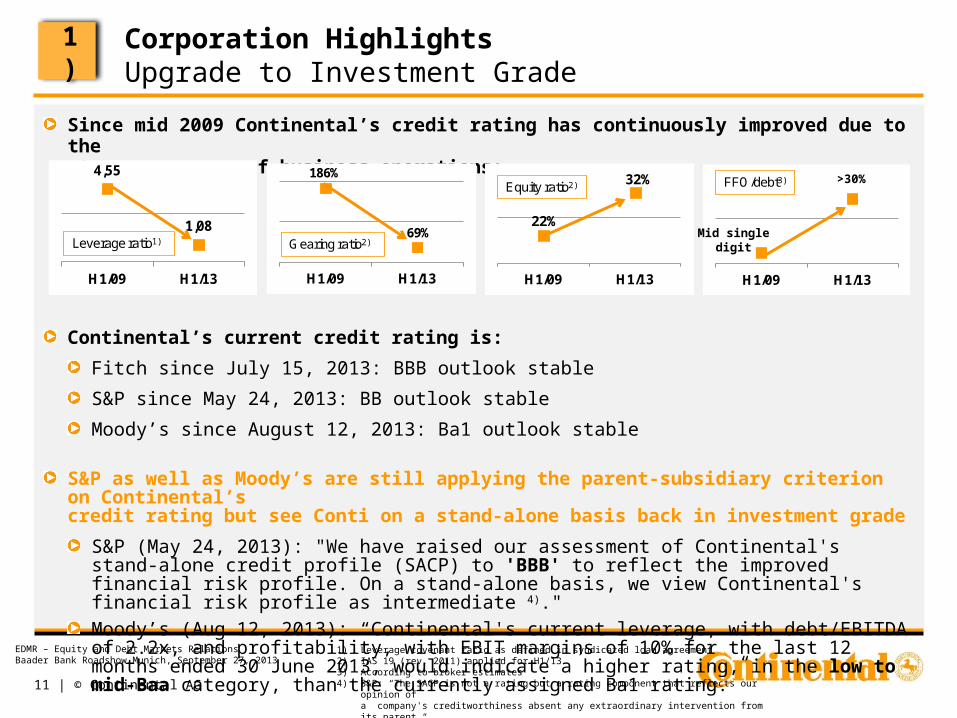
Since mid 2009 Continental’s credit rating has continuously improved due to the strong recovery of business operations:
Continental’s current credit rating is:
Fitch since July 15, 2013: BBB outlook stable
S&P since May 24, 2013: BB outlook stable
Moody’s since August 12, 2013: Ba1 outlook stable
S&P as well as Moody’s are still applying the parent-subsidiary criterion on Continental’s credit rating but see Conti on a stand-alone basis back in investment grade
S&P (May 24, 2013): "We have raised our assessment of Continental's stand-alone credit profile (SACP) to 'BBB' to reflect the improved financial risk profile. On a stand-alone basis, we view Continental's financial risk profile as intermediate 4)."
Moody’s (Aug 12, 2013): “Continental's current leverage, with debt/EBITDA of 2.2x, and profitability, with EBIT margins of 10% for the last 12 months ended 30 June 2013, would indicate a higher rating, in the low to mid-Baa category, than the currently assigned Ba1 rating.”
4,55
1,08
H1/09 H1/13
Leverage ratio1)
Corporation HighlightsUpgrade to Investment Grade
1) Leverage covenant ratio as defined in syndicated loan agreement2) IAS 19 (rev. 2011) applied for H1/133) According to broker estimates4) S&P: “The SACP is not a rating but a rating component that reflects our opinion of
a company's creditworthiness absent any extraordinary intervention from its parent.“
1)
186%
69%
H1/09 H1/13
Gearing ratio2)
22%
32%
H1/09 H1/13
Equity ratio2)
H1/09 H1/13
FFO/debt3)
Mid singledigit
>30%
12 | © Continental AG
EDMR – Equity and Debt Markets RelationsBaader Bank Roadshow Munich, September 27, 2013
4,937 4,764 4,733 4,911 5,160
Q2/12 Q3/12 Q4/12 Q1/13 Q2/13
415 430
8.4% 8.3%
Q2/12 Q3/12 Q4/12 Q1/13 Q2/13
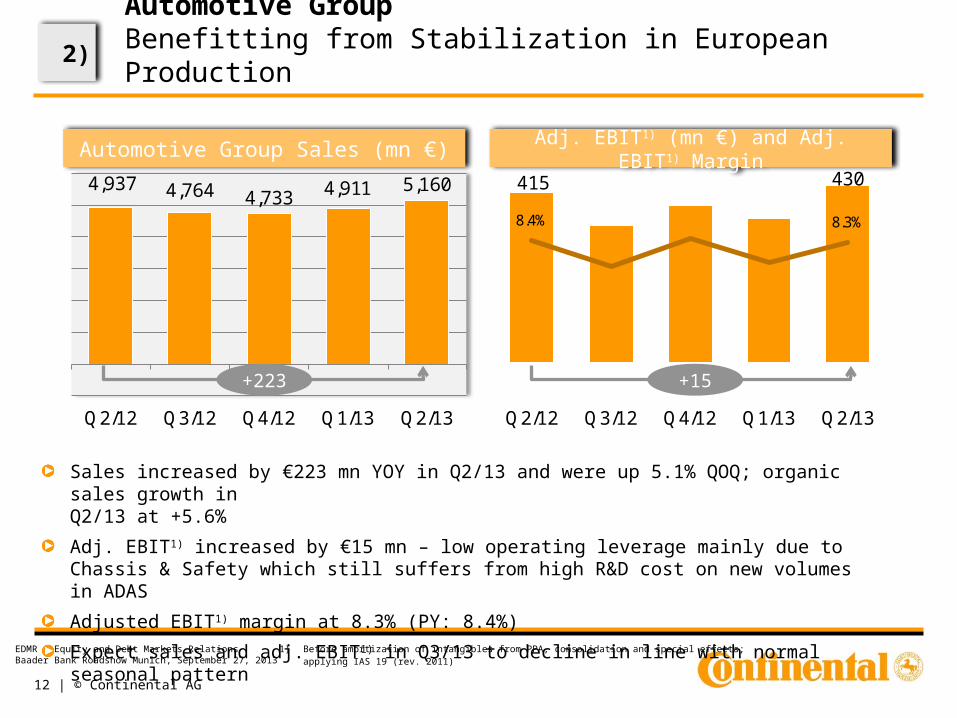
Automotive GroupBenefitting from Stabilization in European Production
Sales increased by €223 mn YOY in Q2/13 and were up 5.1% QOQ; organic sales growth in Q2/13 at +5.6%
Adj. EBIT1) increased by €15 mn – low operating leverage mainly due to Chassis & Safety which still suffers from high R&D cost on new volumes in ADAS
Adjusted EBIT1) margin at 8.3% (PY: 8.4%)
Expect sales and adj. EBIT1) in Q3/13 to decline in line with normal seasonal pattern
Automotive Group Sales (mn €) Adj. EBIT1) (mn €) and Adj. EBIT1) Margin
+223 +15
1) Before amortization of intangibles from PPA, consolidation and special effects;applying IAS 19 (rev. 2011)
2)
13 | © Continental AG
EDMR – Equity and Debt Markets RelationsBaader Bank Roadshow Munich, September 27, 2013
344
151
287 0 781
Chassis &Safety
Powertrain Interior cons. AutomotiveGroup
Adj. EBIT margin (%)
9.4%
4.8%
8.6%
7.8%3,654
3,133
3,34359
10,071
Chassis &Safety
Powertrain Interior cons. AutomotiveGroup
Organic growth (%)
-2.0%
3.0%
1.7%
3.7%
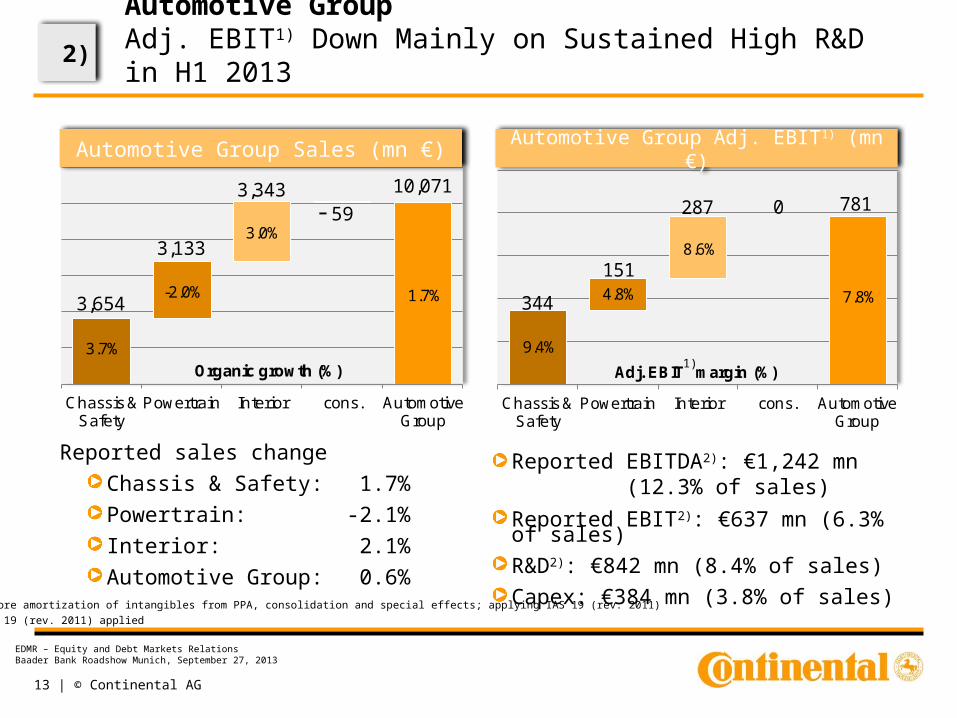
Reported sales change
Chassis & Safety: 1.7%
Powertrain: -2.1%
Interior: 2.1%
Automotive Group: 0.6%
Automotive GroupAdj. EBIT1) Down Mainly on Sustained High R&D in H1 2013
Automotive Group Sales (mn €) Automotive Group Adj. EBIT1) (mn €)
Reported EBITDA2): €1,242 mn (12.3% of sales)
Reported EBIT2): €637 mn (6.3% of sales)
R&D2): €842 mn (8.4% of sales)
Capex: €384 mn (3.8% of sales) 1) Before amortization of intangibles from PPA, consolidation and special effects; applying IAS 19 (rev. 2011)
2) IAS 19 (rev. 2011) applied
-
2)
1)
14 | © Continental AG
EDMR – Equity and Debt Markets RelationsBaader Bank Roadshow Munich, September 27, 2013
3,256 3,378 3,3723,132
3,392
Q2/12 Q3/12 Q4/12 Q1/13 Q2/13
566 570
17.4% 17.0%
Q2/12 Q3/12 Q4/12 Q1/13 Q2/13
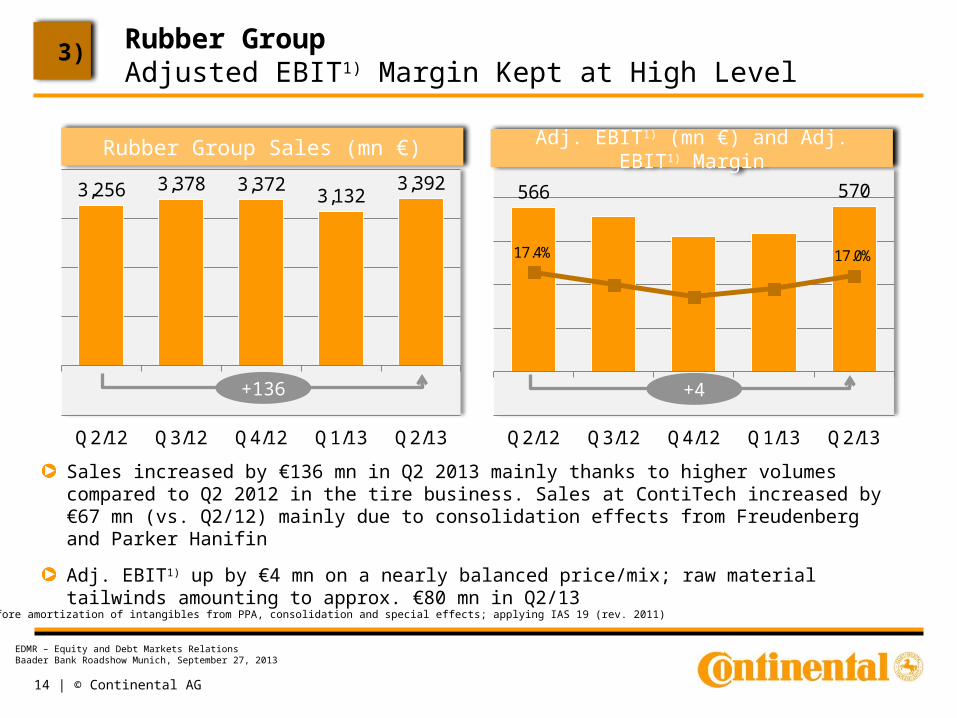
Rubber GroupAdjusted EBIT1) Margin Kept at High Level
Sales increased by €136 mn in Q2 2013 mainly thanks to higher volumes compared to Q2 2012 in the tire business. Sales at ContiTech increased by €67 mn (vs. Q2/12) mainly due to consolidation effects from Freudenberg and Parker Hanifin
Adj. EBIT1) up by €4 mn on a nearly balanced price/mix; raw material tailwinds amounting to approx. €80 mn in Q2/13
Rubber Group Sales (mn €)
+136 +4
3)
Adj. EBIT1) (mn €) and Adj. EBIT1) Margin
1) Before amortization of intangibles from PPA, consolidation and special effects; applying IAS 19 (rev. 2011)
15 | © Continental AG
EDMR – Equity and Debt Markets RelationsBaader Bank Roadshow Munich, September 27, 2013
239
807 1,046
ContiTech Tires cons. Rubber Group
Adj. EBIT margin (%)12.9%
17.4%16.3%1,940
4,641
58
6,524
ContiTech Tires cons. Rubber Group
Organic growth (%)0.1%
-0.4%
-0.2%
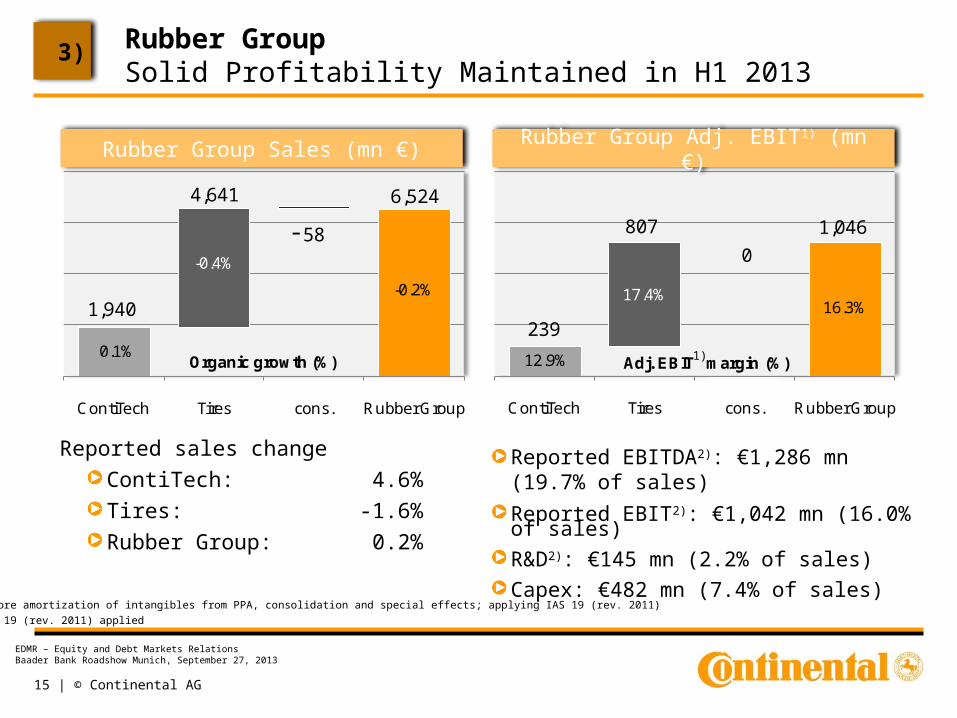
Rubber GroupSolid Profitability Maintained in H1 2013
Reported sales change
ContiTech: 4.6%
Tires: -1.6%
Rubber Group: 0.2%
Reported EBITDA2): €1,286 mn (19.7% of sales)
Reported EBIT2): €1,042 mn (16.0% of sales)
R&D2): €145 mn (2.2% of sales)
Capex: €482 mn (7.4% of sales)
Rubber Group Sales (mn €) Rubber Group Adj. EBIT1) (mn €)
-
1)
3)
1) Before amortization of intangibles from PPA, consolidation and special effects; applying IAS 19 (rev. 2011)
2) IAS 19 (rev. 2011) applied
0
16 | © Continental AG
EDMR – Equity and Debt Markets RelationsBaader Bank Roadshow Munich, September 27, 2013
-20.0%
-15.0%
-10.0%
-5.0%
0.0%
5.0%
10.0%
Oct
-11
Dec
-11
Feb
-12
Ap
r-12
Jun-
12
Aug
-12
Oct
-12
Dec
-12
Feb
-13
Ap
r-13
Jun-
13
PC & LT Tire Replacement (YOY chg. monthly)
Vehicle miles YOY chg. (DOT)
NAFTA
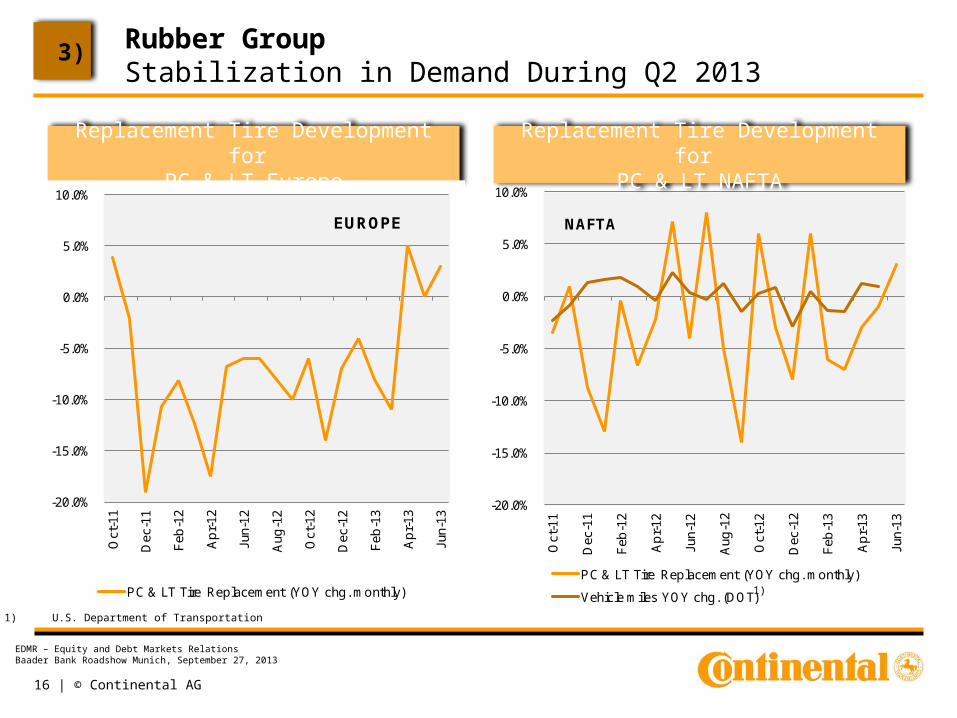
Rubber GroupStabilization in Demand During Q2 2013
3)
Replacement Tire Development for PC & LT Europe
Replacement Tire Development for PC & LT NAFTA
1) U.S. Department of Transportation
1)
-20.0%
-15.0%
-10.0%
-5.0%
0.0%
5.0%
10.0%
Oct
-11
Dec
-11
Feb
-12
Ap
r-12
Jun-
12
Aug
-12
Oct
-12
Dec
-12
Feb
-13
Ap
r-13
Jun-
13
PC & LT Tire Replacement (YOY chg. monthly)
EUROPE
17 | © Continental AG
EDMR – Equity and Debt Markets RelationsBaader Bank Roadshow Munich, September 27, 2013
315 309 322
431
537479 467
371 376342
287 299 304252
295350
133 150 162 189 208
287
371307 288 307
187 169 177 169212 240
Q1/
10
Q2/
10
Q3/
10
Q4/
10
Q1/
11
Q2/
11
Q3/
11
Q4/
11
Q1/
12
Q2/
12
Q3/
12
Q4/
12
Q1/
13
Q2/
13
Q3/
13E
Q4/
13E
TSR 20 US cents/kg Butadiene US cents/kg
Average : TSR 20: 345 Butadiene:
159
Average : TSR 20: 463 Butadiene:
294
Average : TSR 20: 326 Butadiene:
237
Average : TSR 20: 300Butadiene:
200
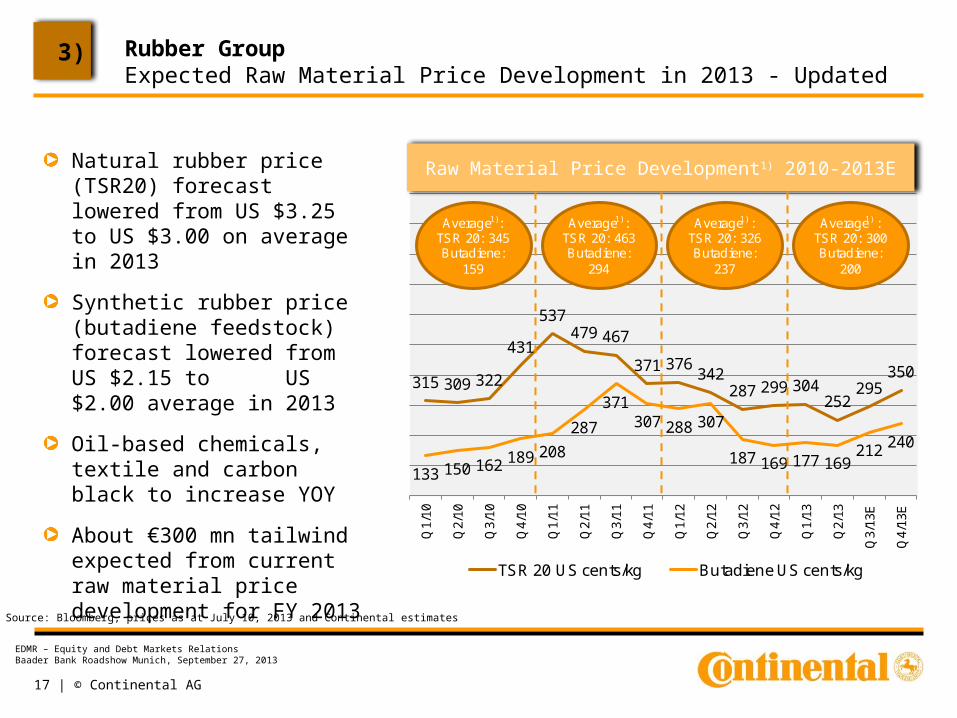
Raw Material Price Development1) 2010-2013E
Rubber GroupExpected Raw Material Price Development in 2013 - Updated
Natural rubber price (TSR20) forecast lowered from US $3.25 to US $3.00 on average in 2013
Synthetic rubber price (butadiene feedstock) forecast lowered from US $2.15 to US $2.00 average in 2013
Oil-based chemicals, textile and carbon black to increase YOY
About €300 mn tailwind expected from current raw material price development for FY 2013
1) Source: Bloomberg, prices as at July 10, 2013 and Continental estimates
1) 1) 1) 1)
3)
18 | © Continental AG
EDMR – Equity and Debt Markets RelationsBaader Bank Roadshow Munich, September 27, 2013
5,320
450
882
929195
61
849
8546,012
Ne
t in
de
bte
dne
ss(F
Y 2
01
2)
Div
ide
nd
20
12
Ca
pe
x
Ch
an
ge
in
rece
iva
ble
s
Ch
an
ge
inin
ven
torie
s
Ch
an
ge
inp
aya
ble
s
De
pre
cia
tion
&
am
ort
iza
tion
Oth
er
CF
Ne
t in
de
bte
dne
ss(H
1 2
01
3)
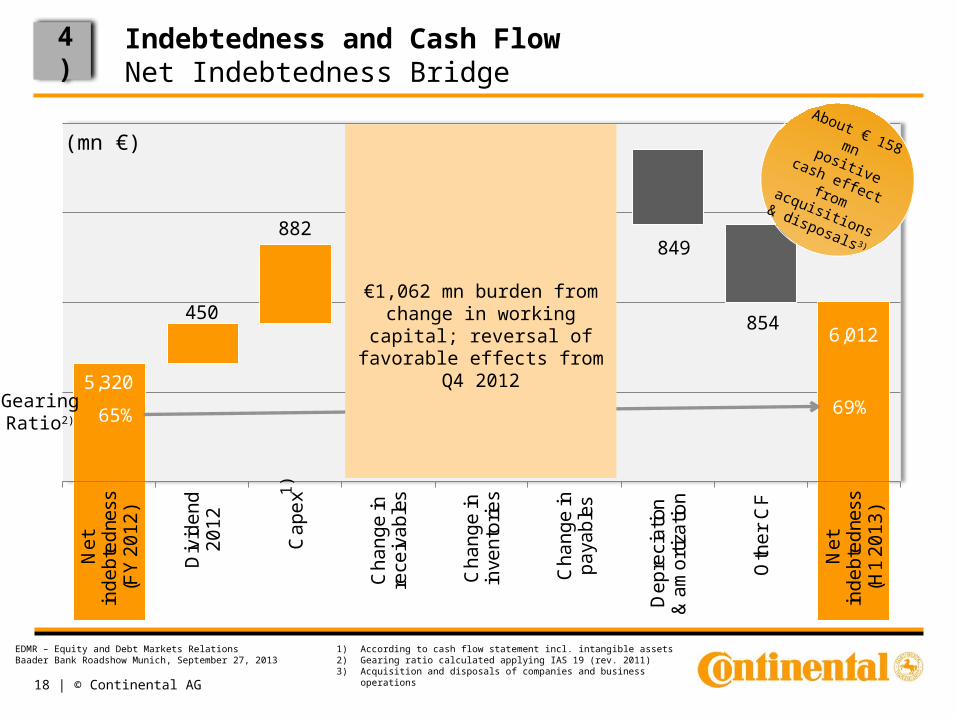
Indebtedness and Cash FlowNet Indebtedness Bridge
€1,062 mn burden from change in working capital;
reversal of favorable effects from Q4 2012
65% 69%
(mn €)
1) According to cash flow statement incl. intangible assets2) Gearing ratio calculated applying IAS 19 (rev. 2011)3) Acquisition and disposals of companies and business operations
1)
4)
GearingRatio2)
About € 158 mn positive cash effect from
acquisitions & disposals 3)
19 | © Continental AG
EDMR – Equity and Debt Markets RelationsBaader Bank Roadshow Munich, September 27, 2013
7,3
17
7,6
05
7,1
14
7,2
97
6,7
72
6,8
41
6,8
76
6,8
02
5,3
20
5,6
13
6,0
12
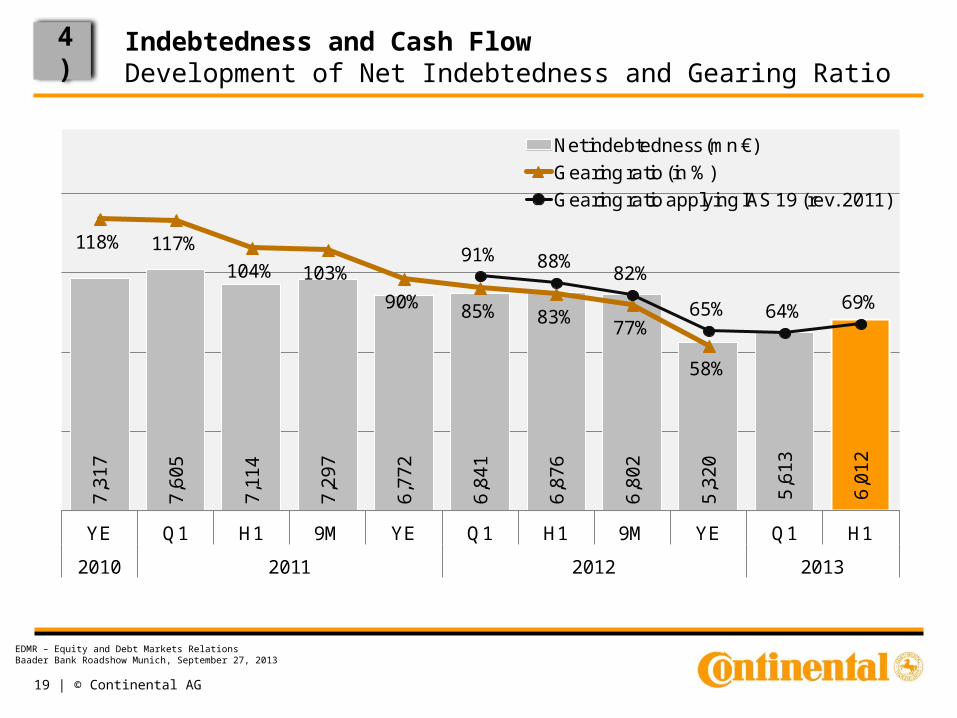
118% 117%
104% 103%
90% 85% 83%77%
58%
91% 88%82%
65% 64% 69%
YE Q1 H1 9M YE Q1 H1 9M YE Q1 H1
2010 2011 2012 2013
Net indebtedness (mn €)
Gearing ratio (in %)
Gearing ratio applying IAS 19 (rev. 2011)
Indebtedness and Cash FlowDevelopment of Net Indebtedness and Gearing Ratio
4)

20 | © Continental AG
EDMR – Equity and Debt Markets RelationsBaader Bank Roadshow Munich, September 27, 2013
988
-862
126
624
-713
-88
CF from operatingactivities
CF used for investingactivities
Free cashflow
2012 2013
Indebtedness and Cash FlowCash Flow Overview
4)
Cash flow (mn €) H1 2012 & H1 2013
1) Acquisition and disposals of companies and business operations
Operating FCF in H1/13 impacted by reversal of WC effects from Q4/12 and pick up in sales in Q2/13, while CF from investments benefited from acquisitions & disposals1)
FCF in Q2/13 amounted to € 223 mn

21 | © Continental AG
EDMR – Equity and Debt Markets RelationsBaader Bank Roadshow Munich, September 27, 2013
14,87816,506 16,574
13.9% 14.8% 14.7%
2011 2012 2013
Sales (mn €)
Adj. EBITDA & adj. EBITDA margin
2,069 2,442 2,442
1.651.48 1.48
1.35 1.27
0.93 0.99 1.08
3.00 3.00 3.00 3.00 3.00 3.00 3.00 3.00
9M YE Q1 H1 9M YE Q1 H1
2011 2012 2013
Leverage ratio Leverage covenant
Indebtedness and Cash FlowAdjusted EBITDA1) and Leverage Ratio
1) Adjusted EBITDA as defined in syndicated loan agreement; IAS 19 (rev. 2011) applied to 2013 only2) Leverage covenant ratio as defined in syndicated loan agreement
Leverage Ratio2) by QuarterSales and Adj. EBITDA1) (mn €) in H1
4)
1) 1)
22 | © Continental AG
EDMR – Equity and Debt Markets RelationsBaader Bank Roadshow Munich, September 27, 2013
47.7
222.136.6
44.123.9
14.0
360.4
Co
st fo
rsy
nd
ica
ted
loa
n
Co
st fo
rb
on
ds
Oth
er
inte
rest
cost
IAS
19
(r
ev.
20
11)
ad
op
tion
De
riva
tive
inst
rum
en
ts&
F/X
Inte
rest
inco
me
Ne
t in
tere
ste
xpe
nse
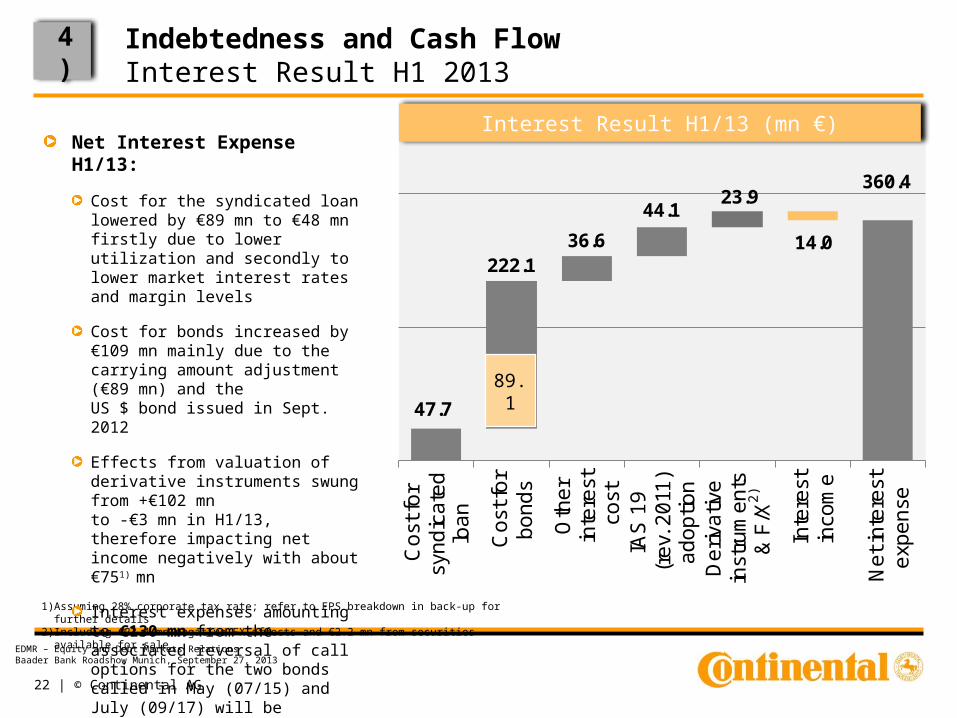
Interest Result H1/13 (mn €)
Indebtedness and Cash FlowInterest Result H1 2013
4)
1) Assuming 28% corporate tax rate; refer to EPS breakdown in back-up for further details2) Including €23.4 mn negative FX effects and €2.2 mn from securities available for sale
Net Interest Expense H1/13:
Cost for the syndicated loan lowered by €89 mn to €48 mn firstly due to lower utilization and secondly to lower market interest rates and margin levels
Cost for bonds increased by €109 mn mainly due to the carrying amount adjustment (€89 mn) and the US $ bond issued in Sept. 2012
Effects from valuation of derivative instruments swung from +€102 mn to -€3 mn in H1/13, therefore impacting net income negatively with about €751) mn
Interest expenses amounting to €130 mn from the associated reversal of call options for the two bonds called in May (07/15) and July (09/17) will be incurred in Q3/13
2)
89.1

23 | © Continental AG
EDMR – Equity and Debt Markets RelationsBaader Bank Roadshow Munich, September 27, 2013
5,3
99
5,3
30
4,6
81
4,8
18
5,2
42
5,0
07
4,3
48
4,6
86
4,6
90
4,9
20
4,2
30
4,6
50
Q1
/11
Q2
/11
Q3
/11
Q4
/11
Q1
/12
Q2
/12
Q3
/12
Q4
/12
Q1
/13
Q2
/13
E
Q3
/13
E
Q4
/13
E
Europe
3,3
74
3,1
69
3,1
85
3,4
36 3,9
64
3,9
87
3,6
67
3,8
22
4,0
07
4,1
60
3,9
40
3,7
00
Q1
/11
Q2
/11
Q3
/11
Q4
/11
Q1
/12
Q2
/12
Q3
/12
Q4
/12
Q1
/13
Q2
/13
E
Q3
/13
E
Q4
/13
E
NAFTA
Outlook PC & LT Production by Quarter
5)
2011: 20.0 mn 2012: 19.2 mn 2013E: 18.5 mn 2011: 13.2 mn 2012: 15.4 mn 2013E: 15.8 mn
Slightly more positive on Europeafter better-than-expected H1 development; Increasing NAFTA estimates from 15.5 mn to 15.8 mn units
Source: IHS and own estimates
k units k units

24 | © Continental AG
EDMR – Equity and Debt Markets RelationsBaader Bank Roadshow Munich, September 27, 2013
287248
59
278290253
63
295
Europe NAFTA South America
Asia
2012 2013E
19.215.4
4.3
40.3
18.5 15.8
4.4
42.5
Europe NAFTA South America
Asia
2012 2013E
18.9 20.512.7
67.3
20.4 21.013.4
70.2
Europe NAFTA South America
Asia
2012 2013E
615 496185
1,817
599 521205
1,967
Europe NAFTA South America
Asia
2012 2013E
OutlookMarket Outlook for Major Regions 2013
Commercial Vehicle2) Prod. (k units)
CV Repl.4) Tire Market (mn units)
-3% 5% 11% 8%
Some recovery from 2012 levels expected
Slow recovery in core markets from 2012 levels
8% 2% 4%
Source: IHS and own estimates
Source: LMC and own estimates
6%
5)
1) Passenger car & light truck <6t2) Heavy vehicles >6t3) Passenger car & light truck replacement 4) Commercial vehicle replacement (radial & biased)
Changes in comparison to the Q1/13 presentation marked in red.
-4% 3%1%
6%
Source: IHS and own estimates
PC & LT1) Production (mn units)
Worldwide to increase
from 81 mn to ~83 mn units
1% 2% 7% 6%
Source: LMC and own estimates
PC & LT Repl.3) Tire Market (mn units)
World replacement tire market to increase by 2%
25 | © Continental AG
EDMR – Equity and Debt Markets RelationsBaader Bank Roadshow Munich, September 27, 2013
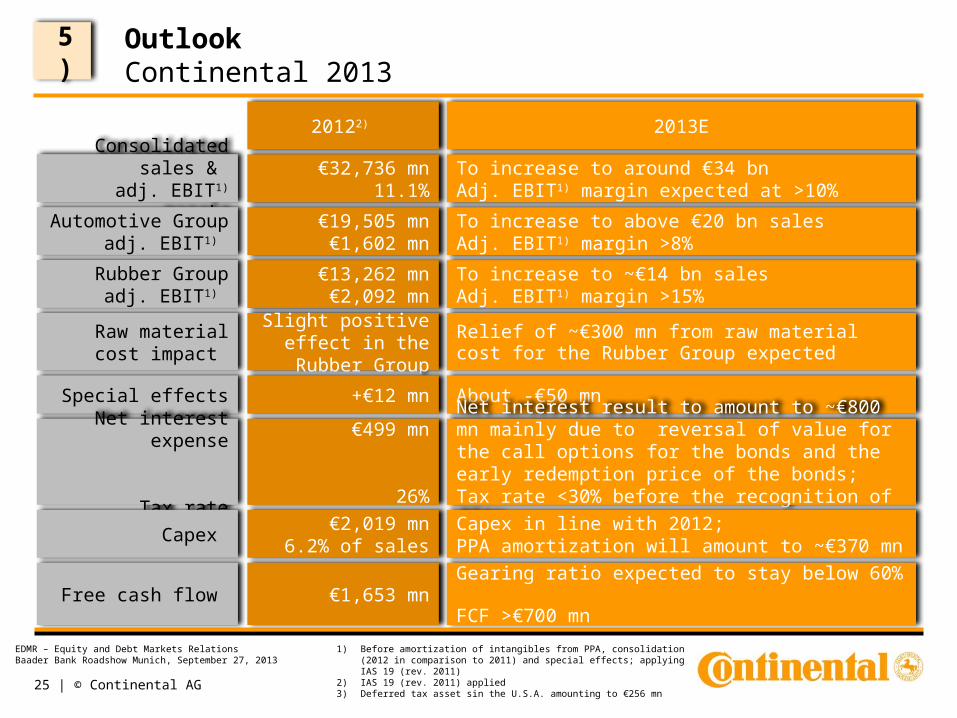
Outlook Continental 2013
5)
Consolidated sales & adj. EBIT1) margin
€32,736 mn11.1%
Automotive Groupadj. EBIT1)
€19,505 mn€1,602 mn
Rubber Groupadj. EBIT1)
€13,262 mn€2,092 mn
Raw material cost impact
Slight positive effect in the Rubber Group
20122)
Special effects +€12 mn
Net interest expense
Tax rate
€499 mn
26%
Capex €2,019 mn
6.2% of sales
Free cash flow €1,653 mn
To increase to around €34 bnAdj. EBIT1) margin expected at >10%
To increase to above €20 bn salesAdj. EBIT1) margin >8%
To increase to ~€14 bn salesAdj. EBIT1) margin >15%
Relief of ~€300 mn from raw material cost for the Rubber Group expected
2013E
About -€50 mn
Net interest result to amount to ~€800 mn mainly due to reversal of value for the call options for the bonds and the early redemption price of the bonds; Tax rate <30% before the recognition of DTA3)
Capex in line with 2012; PPA amortization will amount to ~€370 mn
Gearing ratio expected to stay below 60% FCF >€700 mn
1) Before amortization of intangibles from PPA, consolidation (2012 in comparison to 2011) and special effects; applying IAS 19 (rev. 2011)
2) IAS 19 (rev. 2011) applied3) Deferred tax asset sin the U.S.A. amounting to €256 mn
26 | © Continental AG
EDMR – Equity and Debt Markets RelationsBaader Bank Roadshow Munich, September 27, 2013
Thank you for your attention!
Official Sponsor of the 2014 FIFA World CupTM
27 | © Continental AG
EDMR – Equity and Debt Markets RelationsBaader Bank Roadshow Munich, September 27, 2013
Disclaimer
This presentation has been prepared by Continental Aktiengesellschaft solely in connection with the Baader Bank roadshow in Munich on September 27, 2013. It has not been independently verified. It does not constitute an offer, invitation or recommendation to purchase or subscribe for any shares or other securities issued by Continental AG or any subsidiary and neither shall any part of it form the basis of, or be relied upon in connection with, any contract or commitment concerning the purchase or sale of such shares or other securities whatsoever.
Neither Continental Aktiengesellschaft nor any of its affiliates, advisors or representatives shall have any liability whatsoever (in negligence or otherwise) for any loss that may arise from any use of this presentation or its contents or otherwise arising in connection with this presentation.
This presentation includes assumptions, estimates, forecasts and other forward-looking statements, including statements about our beliefs and expectations regarding future developments as well as their effect on the results of Continental. These statements are based on plans, estimates and projections as they are currently available to the management of Continental. Therefore, these statements speak only as of the date they are made, and we undertake no obligation to update publicly any of them in light of new information or future events. Furthermore, although the management is of the opinion that these statements, and their underlying beliefs and expectations, are realistic or of the date they are made, no guarantee can be given that the expected developments and effects will actually occur. Many factors may cause the actual development to be materially different from the expectations expressed here. Such factors include, for example and without limitation, changes in general economic and business conditions, fluctuations in currency exchange rates or interest rates, the introduction of competing products, the lack of acceptance for new products or services and changes in business strategy.
All statements with regard to markets or market position(s) of Continental or any of its competitors are estimates of Continental based on data available to Continental. Such data are neither comprehensive nor independently verified. Consequently, the data used are not adequate for and the statements based on such data are not meant to be, an accurate or proper definition of regional and/or product markets or market shares of Continental and any of the participants in any market.
28 | © Continental AG
EDMR – Equity and Debt Markets RelationsBaader Bank Roadshow Munich, September 27, 2013
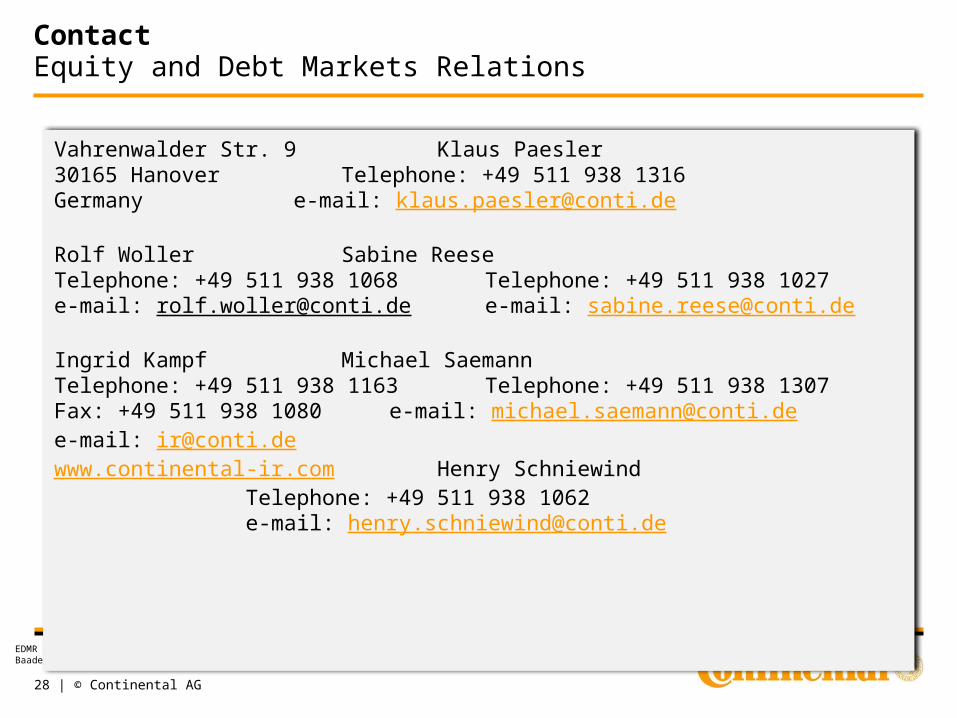
ContactEquity and Debt Markets Relations
Vahrenwalder Str. 9 Klaus Paesler30165 Hanover Telephone: +49 511 938 1316 Germany e-mail: [email protected]
Rolf Woller Sabine ReeseTelephone: +49 511 938 1068 Telephone: +49 511 938 1027 e-mail: [email protected] e-mail: [email protected]
Ingrid Kampf Michael SaemannTelephone: +49 511 938 1163 Telephone: +49 511 938 1307Fax: +49 511 938 1080 e-mail: [email protected] e-mail: [email protected] www.continental-ir.com Henry Schniewind
Telephone: +49 511 938 1062e-mail: [email protected]

29 | © Continental AG
EDMR – Equity and Debt Markets RelationsBaader Bank Roadshow Munich, September 27, 2013
ContinentalFinancial Calendar
2013
Annual Financial Press Conference March 7, 2013
Q1 Financial Report May 3, 2013
Annual Shareholders’ Meeting May 15, 2013
Half Year Financial Report August 1, 2013
Nine Month Financial Report November 7, 2013
2014
Annual Financial Press Conference March 2014
Q1 Financial Report May 2014
Annual Shareholders’ Meeting April 25, 2014
Half Year Financial Report August 2014
Nine Month Financial Report November 2014

30 | © Continental AG
EDMR – Equity and Debt Markets RelationsBaader Bank Roadshow Munich, September 27, 2013
ContinentalShare Data / ADR Data
Share Data
Type of share No-par value share
Bloomberg Ticker CON
Reuters Ticker CONG
German Security Identification Number (WKN) 543 900
ISIN Number DE0005439004
Shares outstanding as at June 30, 2013 200,005,983
ADR Data
Ratio (ordinary share: ADR) 1:1
Bloomberg Ticker CTTAY
Reuters Ticker CTTAY.PK
ISIN Number US2107712000
ADR Level Level 1
Exchange OTC
Sponsor Deutsche Bank Trust Company Americas

31 | © Continental AG
EDMR – Equity and Debt Markets RelationsBaader Bank Roadshow Munich, September 27, 2013
ContinentalBond Data
1) Guaranteed by Continental AG and certain subsidiaries of Continental AG2) Security package released in connection with the refinancing of the Syndicated Facility,
upstream guarantees package still in place 3) Unsolicited rating
Issuer Conti-Gummi Finance B.V., Netherlands1)
Conti-Gummi Finance B.V., Netherlands1)
Conti-Gummi Finance B.V., Netherlands1)
Continental AG1)
Conti-Gummi Finance B.V., Netherlands1)
Continental Rubber of America, Corp., USA1)
Continental AG1)
Issue Senior Notes2) Senior Notes2) Senior Notes Senior Notes Senior Notes2) Senior Notes2) Senior Notes
Principal Amount €625 mn €1,000 mn €750 mn €750 mn €625 mn $950 mn €750 mn
Offering Price 98.861% 99.3304% 99.595% 98.95% 99.2460% 100% 99.228%
Rating at Issuance Date
B1 (Moody’s)B (S&P)
B1 (Moody’s)B (S&P)
Ba1 (Moody’s)BB (S&P)BBB (Fitch3))
Ba2 (Moody’s)BB (S&P)
B1 (Moody’s)B (S&P)
Ba3 (Moody’s)BB- (S&P)
Ba1 (Moody’s)BB (S&P)BBB (Fitch3))
Current Corp.Rating
Ba1 (Moody’s), BB (S&P), BBB (Fitch3))
Coupon 6.5% p.a. 7.5% p.a. 2.5% p.a. 3.0% p.a. 7.125% p.a. 4.5% p.a. 3.125% p.a.
Issue Date October 5, 2010 Sept. 13, 2010 Sept. 19, 2013 July 16, 2013 October 5, 2010 Sept. 24, 2012 Sept. 9, 2013
Maturity Jan. 15, 2016 Sept. 15, 2017 March 20, 2017 July 16, 2018 Oct. 15, 2018 Sept. 15, 2019 Sept. 9, 2020
Start of Period for Redemption (60-90 days’ prior notice)
October 5, 2013 Sept. 13, 2013 --- --- October 5, 2013 Sept. 24, 2015 ---
Interest PaymentSemi annual Jan. 15/Jul. 15
Semi annual Mar. 15/Sept. 15
Annual March. 20
Semi annualJan. 16/Jan. 16
Semi annual Apr. 15/Oct. 15
Semi annual Mar. 15/Sept. 15
AnnualSept. 9
WKN A1A1P0 A1A0U3 Tba A1X24V A1A1P2 A1G9JJ A1X3B7
ISIN DE000A1A1P09 DE000A1A0U37 Tba XS 0953199634 DE000A1A1P25 DE000A1G9JJ0 XS 0969344083
Denomination€1,000 with min. tradable amount €50,000
€1,000 with min. tradable amount €50,000
€1,000 with min. tradable amount €1,000
€1,000 with min. tradable amount €1,000
€1,000 with min. tradable amount €50,000
$1,000 with min. tradable amount $150,000
€1,000 with min. tradable amount €1,000
Early
Redemption
per Sept.16,
2013
New Bond
issued on
July 16,
2013
New Bond
issued on
Sept 9,
2013
Early
Redemption
per Nov. 8,
2013
New Bond
issued on
Sept 19,
2013
Early
Redemption
per Nov. 18,
2013
32 | © Continental AG
EDMR – Equity and Debt Markets RelationsBaader Bank Roadshow Munich, September 27, 2013
Back-up
33 | © Continental AG
EDMR – Equity and Debt Markets RelationsBaader Bank Roadshow Munich, September 27, 2013
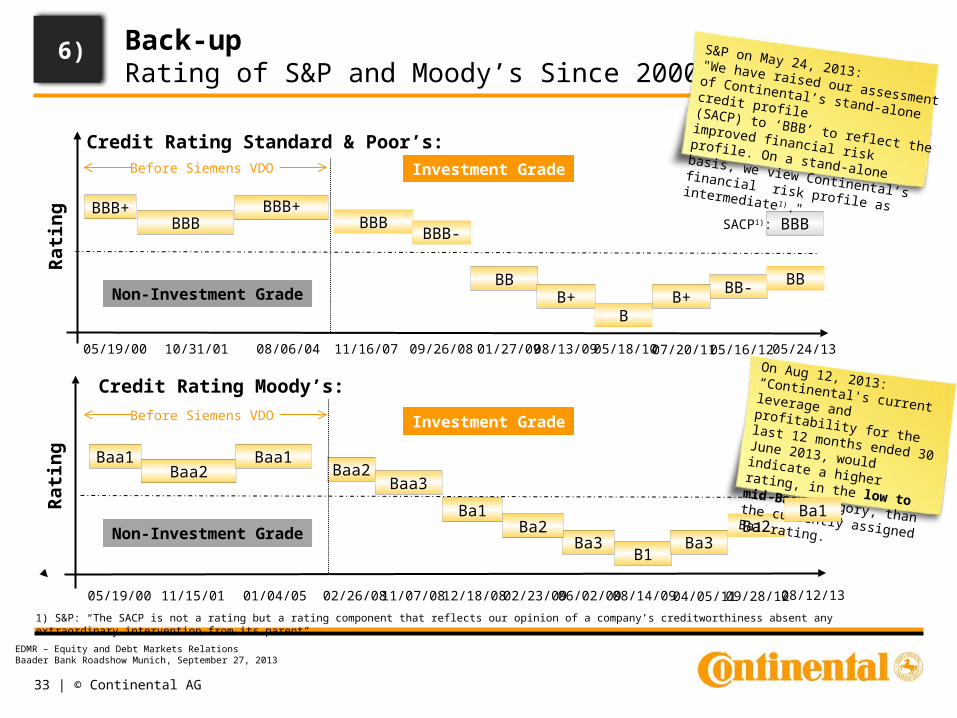
Back-upRating of S&P and Moody’s Since 2000
1) S&P: “The SACP is not a rating but a rating component that reflects our opinion of a company’s creditworthiness absent any extraordinary intervention from its parent“.
6)
Ba2
09/28/12
Rat
ing BBB+
BBBBBB+
BBB+
05/19/00 10/31/01 08/06/04 11/16/07 09/26/08 01/27/09 08/13/09
Non-Investment Grade
Investment Grade
Credit Rating Standard & Poor’s:
Rat
ing Baa1
Baa2Baa1
Baa2Baa3
Ba1
Ba3
05/19/00 11/15/01 01/04/05 02/26/08 11/07/08 12/18/08 06/02/09
Non-Investment Grade
Investment Grade
Credit Rating Moody’s:
08/14/09
B1
Ba2
02/23/09
05/18/10
04/05/11
Ba3
07/20/11 05/16/12
BB-B+
BBB
S&P on May 24, 2013: "We have raised our assessment of Continental’s stand-alone credit profile(SACP) to ‘BBB’ to reflect the improved financial risk profile. On a stand-alone basis, we view Continental’s financial risk profile as intermediate1)."Before Siemens VDO
Before Siemens VDO
SACP1):
BB
BBB
B
05/24/13
BBB-
On Aug 12, 2013: “Continental's current leverage and profitability for the last 12 months ended 30 June 2013, would indicate a higher rating, in the low to mid-Baa category, than the currently assigned Ba1 rating.”
Ba1
08/12/13
34 | © Continental AG
EDMR – Equity and Debt Markets RelationsBaader Bank Roadshow Munich, September 27, 2013
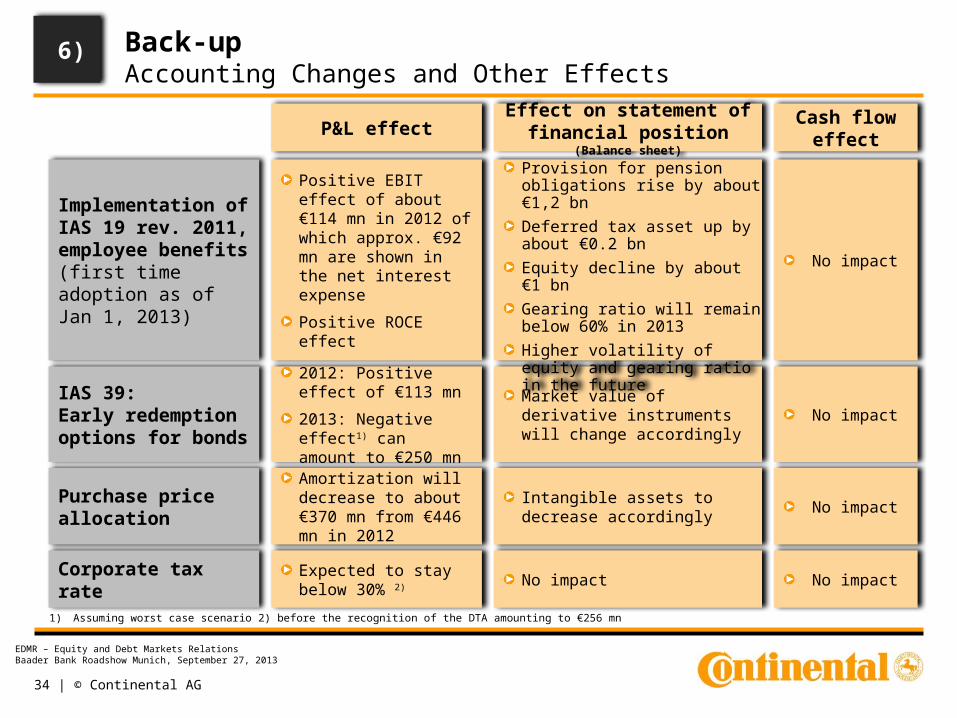
Back-up Accounting Changes and Other Effects
Implementation of IAS 19 rev. 2011, employee benefits(first time adoption as of Jan 1, 2013)
Positive EBIT effect of about €114 mn in 2012 of which approx. €92 mn are shown in the net interest expense
Positive ROCE effect
IAS 39: Early redemption options for bonds
2012: Positive effect of €113 mn
2013: Negative effect1) can amount to €250 mn
P&L effect
Corporate tax rateExpected to stay below 30% 2)
Purchase price allocation
Amortization will decrease to about €370 mn from €446 mn in 2012
Market value of derivative instruments will change accordingly
Effect on statement of financial position (Balance sheet)
No impact
Intangible assets to decrease accordingly
No impact
No impact
Cash flow effect
No impact
No impact
Provision for pension obligations rise by about €1,2 bn
Deferred tax asset up by about €0.2 bn
Equity decline by about €1 bn
Gearing ratio will remain below 60% in 2013
Higher volatility of equity and gearing ratio in the future
1) Assuming worst case scenario 2) before the recognition of the DTA amounting to €256 mn
6)
35 | © Continental AG
EDMR – Equity and Debt Markets RelationsBaader Bank Roadshow Munich, September 27, 2013
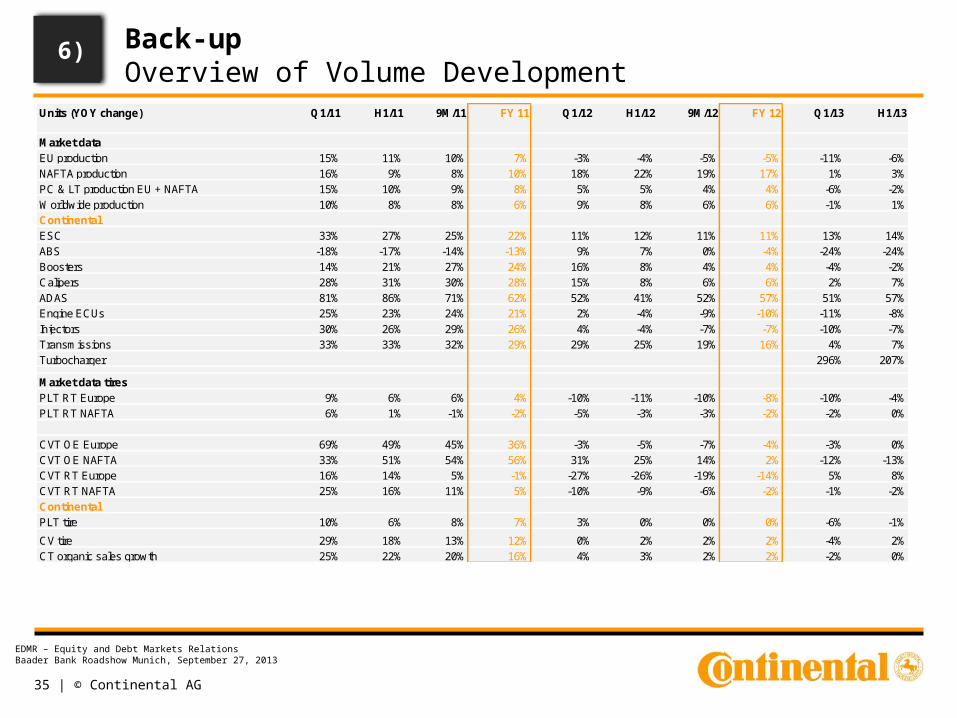
Back-upOverview of Volume Development
6)
Units (YOY change) Q1/11 H1/11 9M/11 FY 11 Q1/12 H1/12 9M/12 FY 12 Q1/13 H1/13
Market dataEU production 15% 11% 10% 7% -3% -4% -5% -5% -11% -6%NAFTA production 16% 9% 8% 10% 18% 22% 19% 17% 1% 3%PC & LT production EU + NAFTA 15% 10% 9% 8% 5% 5% 4% 4% -6% -2%Worldwide production 10% 8% 8% 6% 9% 8% 6% 6% -1% 1%Continental ESC 33% 27% 25% 22% 11% 12% 11% 11% 13% 14%ABS -18% -17% -14% -13% 9% 7% 0% -4% -24% -24%Boosters 14% 21% 27% 24% 16% 8% 4% 4% -4% -2%Calipers 28% 31% 30% 28% 15% 8% 6% 6% 2% 7%ADAS 81% 86% 71% 62% 52% 41% 52% 57% 51% 57%Engine ECUs 25% 23% 24% 21% 2% -4% -9% -10% -11% -8%Injectors 30% 26% 29% 26% 4% -4% -7% -7% -10% -7%Transmissions 33% 33% 32% 29% 29% 25% 19% 16% 4% 7%Turbocharger 296% 207%
Market data tiresPLT RT Europe 9% 6% 6% 4% -10% -11% -10% -8% -10% -4%PLT RT NAFTA 6% 1% -1% -2% -5% -3% -3% -2% -2% 0%
CVT OE Europe 69% 49% 45% 36% -3% -5% -7% -4% -3% 0%CVT OE NAFTA 33% 51% 54% 56% 31% 25% 14% 2% -12% -13%CVT RT Europe 16% 14% 5% -1% -27% -26% -19% -14% 5% 8%CVT RT NAFTA 25% 16% 11% 5% -10% -9% -6% -2% -1% -2%ContinentalPLT tire 10% 6% 8% 7% 3% 0% 0% 0% -6% -1%
CV tire 29% 18% 13% 12% 0% 2% 2% 2% -4% 2%CT organic sales growth 25% 22% 20% 16% 4% 3% 2% 2% -2% 0%
36 | © Continental AG
EDMR – Equity and Debt Markets RelationsBaader Bank Roadshow Munich, September 27, 2013
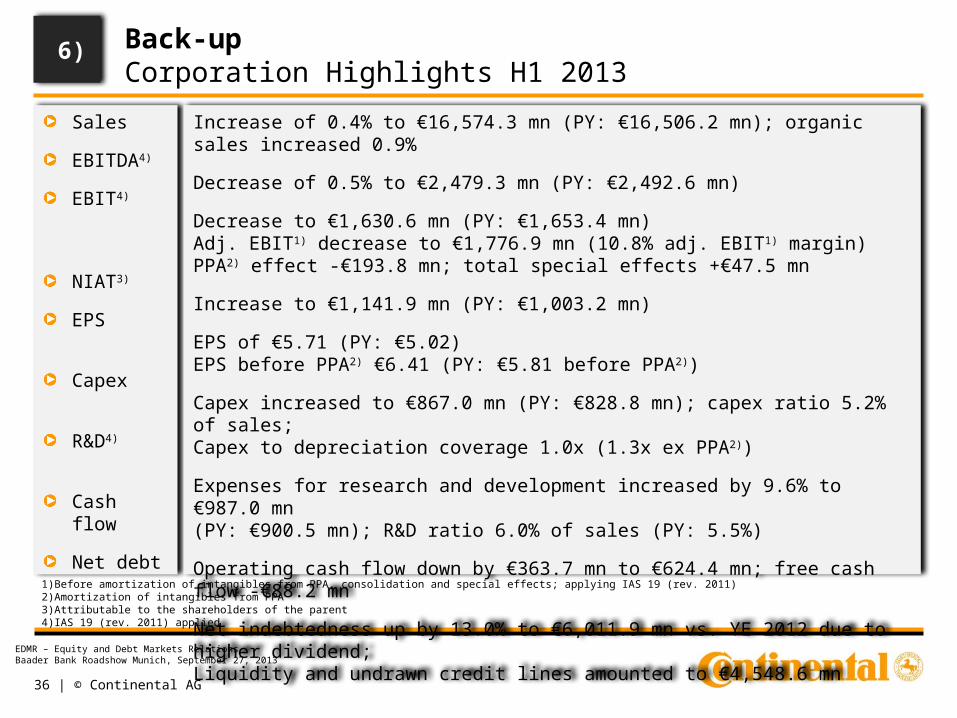
Back-upCorporation Highlights H1 2013
Sales
EBITDA4)
EBIT4)
NIAT3)
EPS
Capex
R&D4)
Cash flow
Net debt
Increase of 0.4% to €16,574.3 mn (PY: €16,506.2 mn); organic sales increased 0.9%
Decrease of 0.5% to €2,479.3 mn (PY: €2,492.6 mn)
Decrease to €1,630.6 mn (PY: €1,653.4 mn) Adj. EBIT1) decrease to €1,776.9 mn (10.8% adj. EBIT1) margin) PPA2) effect -€193.8 mn; total special effects +€47.5 mn
Increase to €1,141.9 mn (PY: €1,003.2 mn)
EPS of €5.71 (PY: €5.02) EPS before PPA2) €6.41 (PY: €5.81 before PPA2))
Capex increased to €867.0 mn (PY: €828.8 mn); capex ratio 5.2% of sales; Capex to depreciation coverage 1.0x (1.3x ex PPA2))
Expenses for research and development increased by 9.6% to €987.0 mn (PY: €900.5 mn); R&D ratio 6.0% of sales (PY: 5.5%)
Operating cash flow down by €363.7 mn to €624.4 mn; free cash flow -€88.2 mn
Net indebtedness up by 13.0% to €6,011.9 mn vs. YE 2012 due to higher dividend;Liquidity and undrawn credit lines amounted to €4,548.6 mn
1)Before amortization of intangibles from PPA, consolidation and special effects; applying IAS 19 (rev. 2011)2)Amortization of intangibles from PPA3)Attributable to the shareholders of the parent4)IAS 19 (rev. 2011) applied
6)
37 | © Continental AG
EDMR – Equity and Debt Markets RelationsBaader Bank Roadshow Munich, September 27, 2013
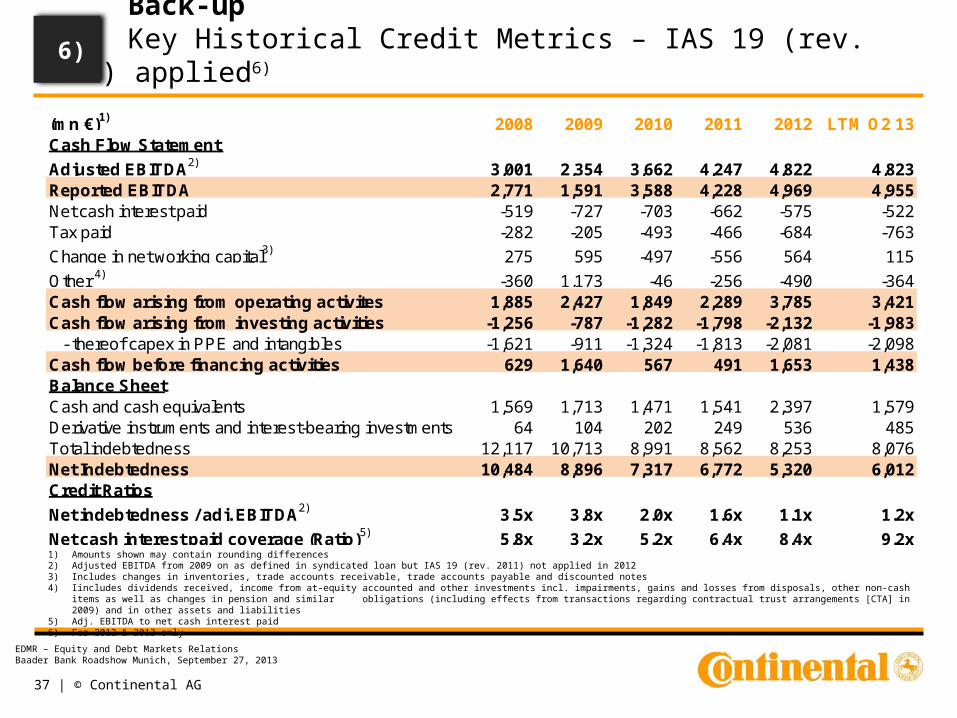
Back-upKey Historical Credit Metrics – IAS 19 (rev. 2011) applied6)
6)
1) Amounts shown may contain rounding differences2) Adjusted EBITDA from 2009 on as defined in syndicated loan but IAS 19 (rev. 2011) not applied in 20123) Includes changes in inventories, trade accounts receivable, trade accounts payable and discounted notes4) Iincludes dividends received, income from at-equity accounted and other investments incl. impairments, gains and losses from disposals, other non-cash items as well as changes in pension and similar
obligations (including effects from transactions regarding contractual trust arrangements [CTA] in 2009) and in other assets and liabilities 5) Adj. EBITDA to net cash interest paid6) For 2012 & 2013 only
(mn €)1) 2008 2009 2010 2011 2012 LTM Q2 13Cash Flow Statement
Adjusted EBITDA2) 3,001 2,354 3,662 4,247 4,822 4,823Reported EBITDA 2,771 1,591 3,588 4,228 4,969 4,955Net cash interest paid -519 -727 -703 -662 -575 -522Tax paid -282 -205 -493 -466 -684 -763
Change in net working capital3) 275 595 -497 -556 564 115
Other 4) -360 1,173 -46 -256 -490 -364Cash flow arising from operating activites 1,885 2,427 1,849 2,289 3,785 3,421Cash flow arising from investing activities -1,256 -787 -1,282 -1,798 -2,132 -1,983 - thereof capex in PPE and intangibles -1,621 -911 -1,324 -1,813 -2,081 -2,098Cash flow before financing activities 629 1,640 567 491 1,653 1,438Balance SheetCash and cash equivalents 1,569 1,713 1,471 1,541 2,397 1,579Derivative instruments and interest-bearing investments 64 104 202 249 536 485Total indebtedness 12,117 10,713 8,991 8,562 8,253 8,076Net Indebtedness 10,484 8,896 7,317 6,772 5,320 6,012Credit Ratios
Net indebtedness / adj. EBITDA2) 3.5x 3.8x 2.0x 1.6x 1.1x 1.2x
Net cash interest paid coverage (Ratio)5) 5.8x 3.2x 5.2x 6.4x 8.4x 9.2x
38 | © Continental AG
EDMR – Equity and Debt Markets RelationsBaader Bank Roadshow Munich, September 27, 2013
4.655.72
0.370.79
0.70
H1/12 H1/13
EPS before Der. Instr. & PPA
Der. Instr. effect after tax
PPA after tax
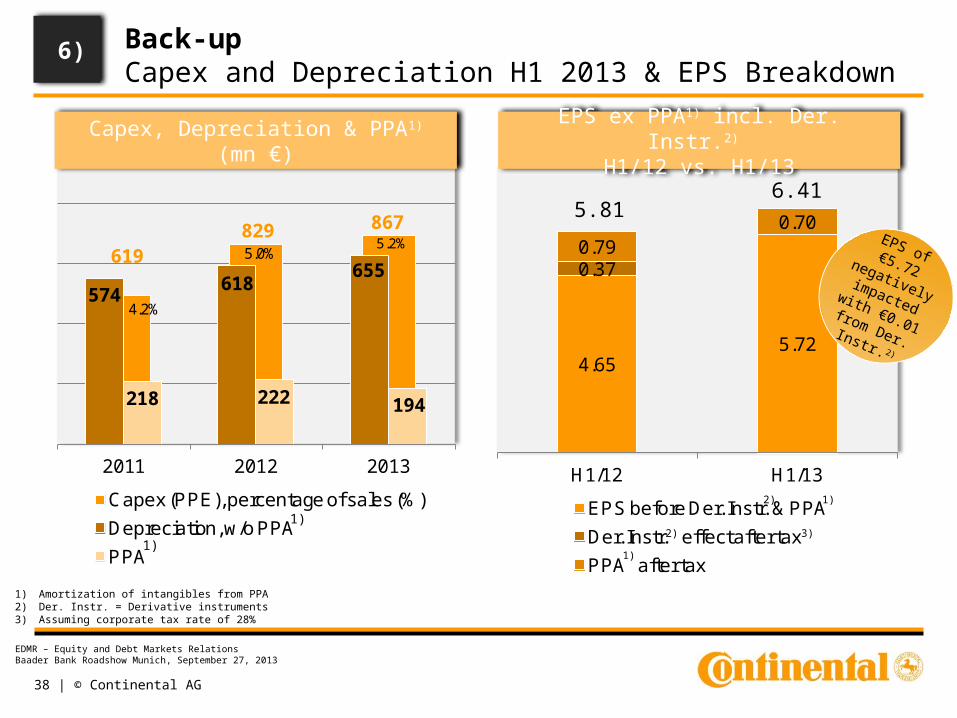
619829 867
574618
655
218 222 194
2011 2012 2013
Capex (PPE), percentage of sales (%)
Depreciation, w/o PPA
PPA
5.0%
4.2%
5.2%
Back-upCapex and Depreciation H1 2013 & EPS Breakdown
Capex, Depreciation & PPA1) (mn €)EPS ex PPA1) incl. Der. Instr.2)
H1/12 vs. H1/13
1) Amortization of intangibles from PPA2) Der. Instr. = Derivative instruments3) Assuming corporate tax rate of 28%
6)
2)
1)
1)
1)3)
1)
2)
5.816.41
EPS of €5.72 negatively
impacted with €0.01 from
Der. Instr. 2)
39 | © Continental AG
EDMR – Equity and Debt Markets RelationsBaader Bank Roadshow Munich, September 27, 2013
3,220.5
3,593.3 3,653.7
15.5%14.1% 13.5%
10.2% 9.4%
2011 2012 2013
Sales (mn €) EBITDA margin Adj. EBIT margin
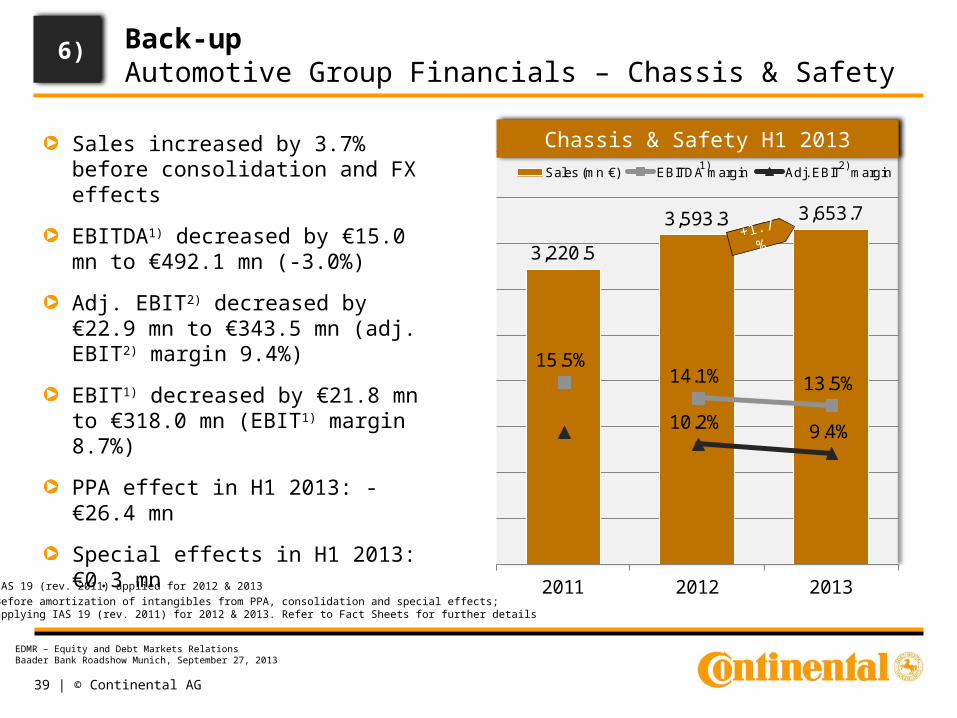
Back-up Automotive Group Financials – Chassis & Safety
Sales increased by 3.7% before consolidation and FX effects
EBITDA1) decreased by €15.0 mn to €492.1 mn (-3.0%)
Adj. EBIT2) decreased by €22.9 mn to €343.5 mn (adj. EBIT2) margin 9.4%)
EBIT1) decreased by €21.8 mn to €318.0 mn (EBIT1) margin 8.7%)
PPA effect in H1 2013: -€26.4 mn
Special effects in H1 2013: €0.3 mn
Chassis & Safety H1 2013
+1.7%
6)
2)
1) IAS 19 (rev. 2011) applied for 2012 & 2013
2) Before amortization of intangibles from PPA, consolidation and special effects;applying IAS 19 (rev. 2011) for 2012 & 2013. Refer to Fact Sheets for further details
1)
40 | © Continental AG
EDMR – Equity and Debt Markets RelationsBaader Bank Roadshow Munich, September 27, 2013
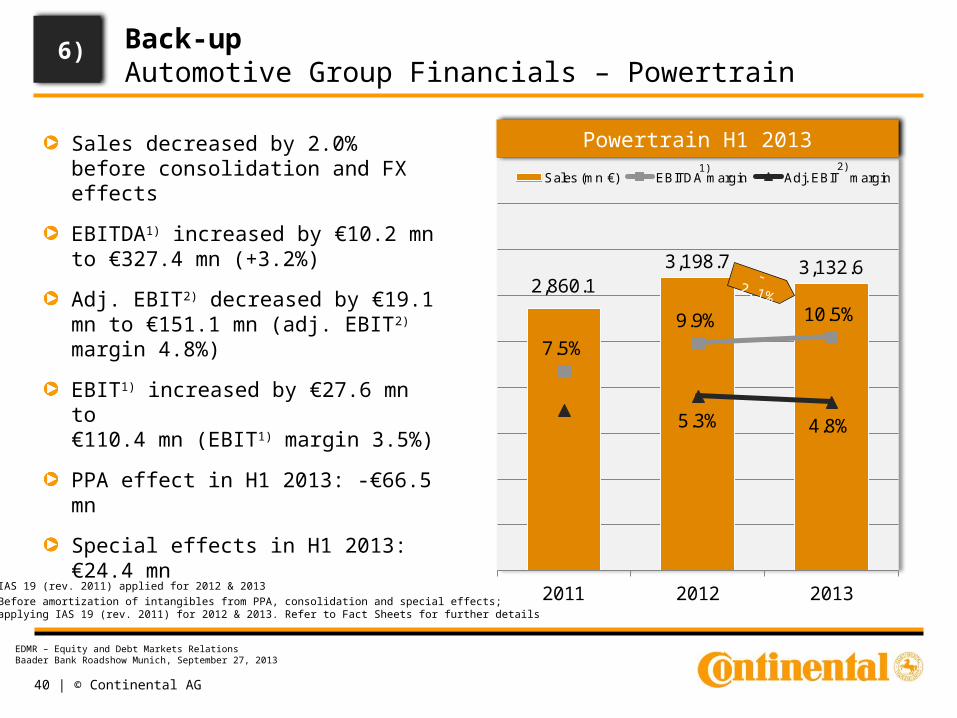
2,860.13,198.7 3,132.6
7.5%
9.9% 10.5%
5.3% 4.8%
2011 2012 2013
Sales (mn €) EBITDA margin Adj. EBIT margin
Sales decreased by 2.0% before consolidation and FX effects
EBITDA1) increased by €10.2 mn to €327.4 mn (+3.2%)
Adj. EBIT2) decreased by €19.1 mn to €151.1 mn (adj. EBIT2) margin 4.8%)
EBIT1) increased by €27.6 mn to €110.4 mn (EBIT1) margin 3.5%)
PPA effect in H1 2013: -€66.5 mn
Special effects in H1 2013: €24.4 mn
Back-upAutomotive Group Financials – Powertrain
Powertrain H1 2013
-2.1%
6)
1)
1) IAS 19 (rev. 2011) applied for 2012 & 2013
2) Before amortization of intangibles from PPA, consolidation and special effects;applying IAS 19 (rev. 2011) for 2012 & 2013. Refer to Fact Sheets for further details
2)
41 | © Continental AG
EDMR – Equity and Debt Markets RelationsBaader Bank Roadshow Munich, September 27, 2013
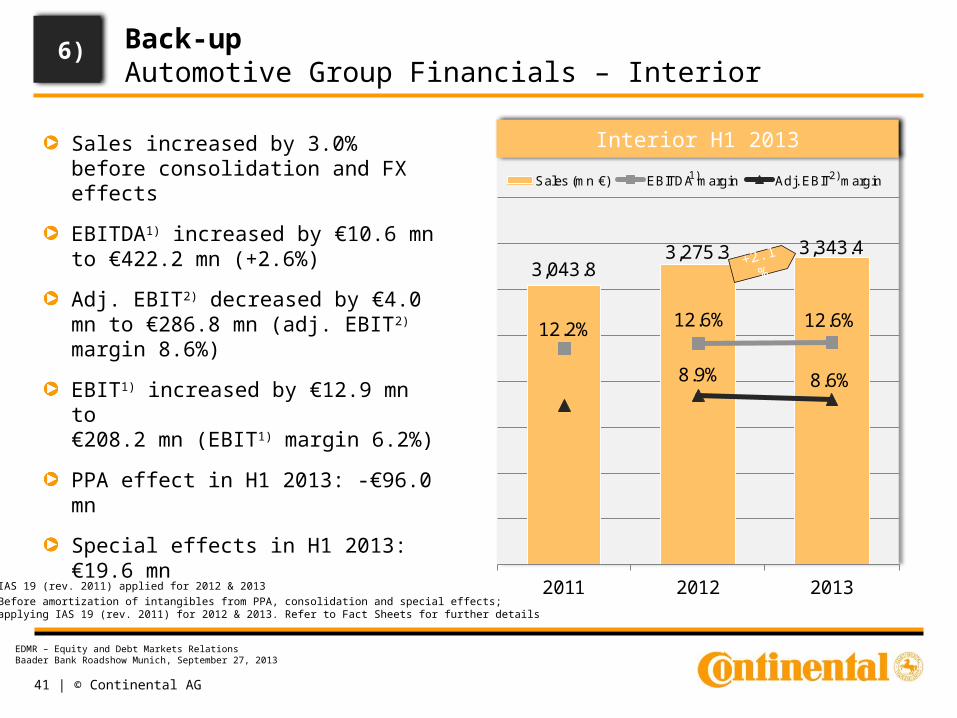
3,043.83,275.3 3,343.4
12.2% 12.6% 12.6%
8.9% 8.6%
2011 2012 2013
Sales (mn €) EBITDA margin Adj. EBIT margin
Back-upAutomotive Group Financials – Interior
Interior H1 2013
+2.1%
Sales increased by 3.0% before consolidation and FX effects
EBITDA1) increased by €10.6 mn to €422.2 mn (+2.6%)
Adj. EBIT2) decreased by €4.0 mn to €286.8 mn (adj. EBIT2) margin 8.6%)
EBIT1) increased by €12.9 mn to €208.2 mn (EBIT1) margin 6.2%)
PPA effect in H1 2013: -€96.0 mn
Special effects in H1 2013: €19.6 mn
6)
2)
1) IAS 19 (rev. 2011) applied for 2012 & 2013
2) Before amortization of intangibles from PPA, consolidation and special effects;applying IAS 19 (rev. 2011) for 2012 & 2013. Refer to Fact Sheets for further details
1)
42 | © Continental AG
EDMR – Equity and Debt Markets RelationsBaader Bank Roadshow Munich, September 27, 2013
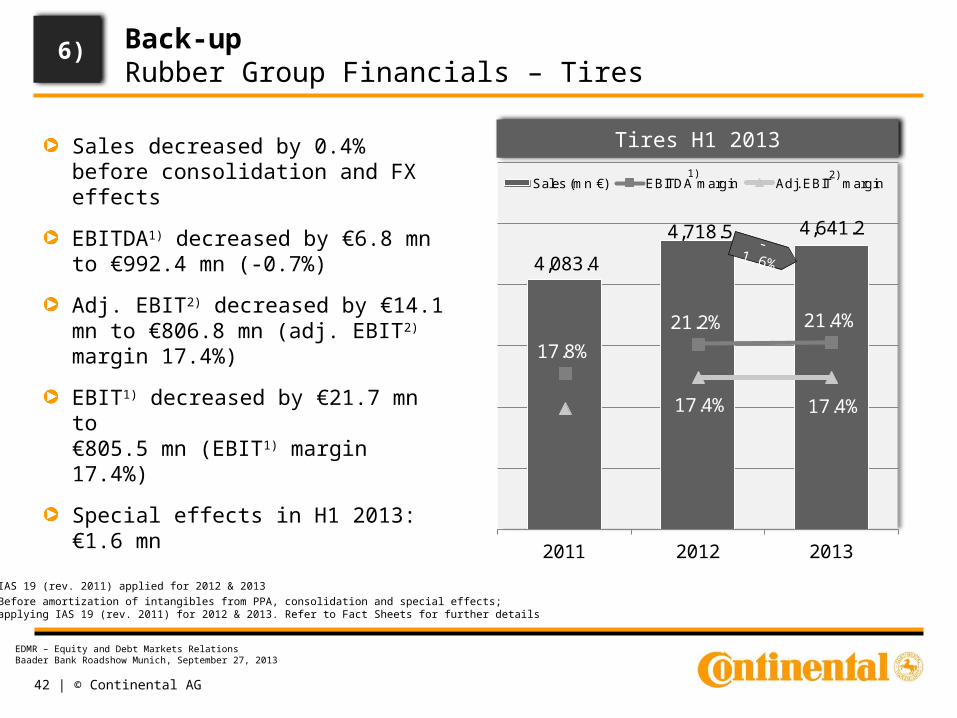
4,083.4
4,718.5 4,641.2
17.8%
21.2% 21.4%
17.4% 17.4%
2011 2012 2013
Sales (mn €) EBITDA margin Adj. EBIT margin
Back-upRubber Group Financials – Tires
Sales decreased by 0.4% before consolidation and FX effects
EBITDA1) decreased by €6.8 mn to €992.4 mn (-0.7%)
Adj. EBIT2) decreased by €14.1 mn to €806.8 mn (adj. EBIT2) margin 17.4%)
EBIT1) decreased by €21.7 mn to €805.5 mn (EBIT1) margin 17.4%)
Special effects in H1 2013: €1.6 mn
Tires H1 2013
-1.6%
6)
2)
1) IAS 19 (rev. 2011) applied for 2012 & 2013
2) Before amortization of intangibles from PPA, consolidation and special effects;applying IAS 19 (rev. 2011) for 2012 & 2013. Refer to Fact Sheets for further details
1)

43 | © Continental AG
EDMR – Equity and Debt Markets RelationsBaader Bank Roadshow Munich, September 27, 2013
860.7
964.4 960.2
3.9%
11.1% 11.4%
2011 2012 2013
Sales (mn €) EBIT margin
Back-upTires – Commercial Vehicle Tires
Commercial Vehicle Tires H1 2013
-0.4%
6)
Sales decreased by 0.4%
EBIT1) increased by €2.1 mn to €109.0 mn (EBIT1) margin 11.4%)
1) IAS 19 (rev. 2011) applied for 2012 & 2013
1)

44 | © Continental AG
EDMR – Equity and Debt Markets RelationsBaader Bank Roadshow Munich, September 27, 2013
-40%
-30%
-20%
-10%
0%
10%
20%
Oct
-11
Dec
-11
Feb
-12
Ap
r-12
Jun-
12
Aug
-12
Oct
-12
Dec
-12
Feb
-13
Ap
r-13
Jun-
13
Truck tire replacement (YOY chg. monthly)
miles BAG monthly (adj.)
-30%
-20%
-10%
0%
10%
20%
Oct
-11
Dec
-11
Feb
-12
Ap
r-12
Jun-
12
Aug
-12
Oct
-12
Dec
-12
Feb
-13
Ap
r-13
Jun-
13
Truck tire replacement (YOY chg. monthly)
ATA monthly (adj.)
Back-upTires – Commercial Vehicle Tire Demand sees some Recovery
6)
1) BAG = Bundesamt für Güterverkehr
2) ATA = American Trucking Association
Replacement Tire Development for Truck Tires Europe
Replacement Tire Development for Truck Tires NAFTA
2)1)
45 | © Continental AG
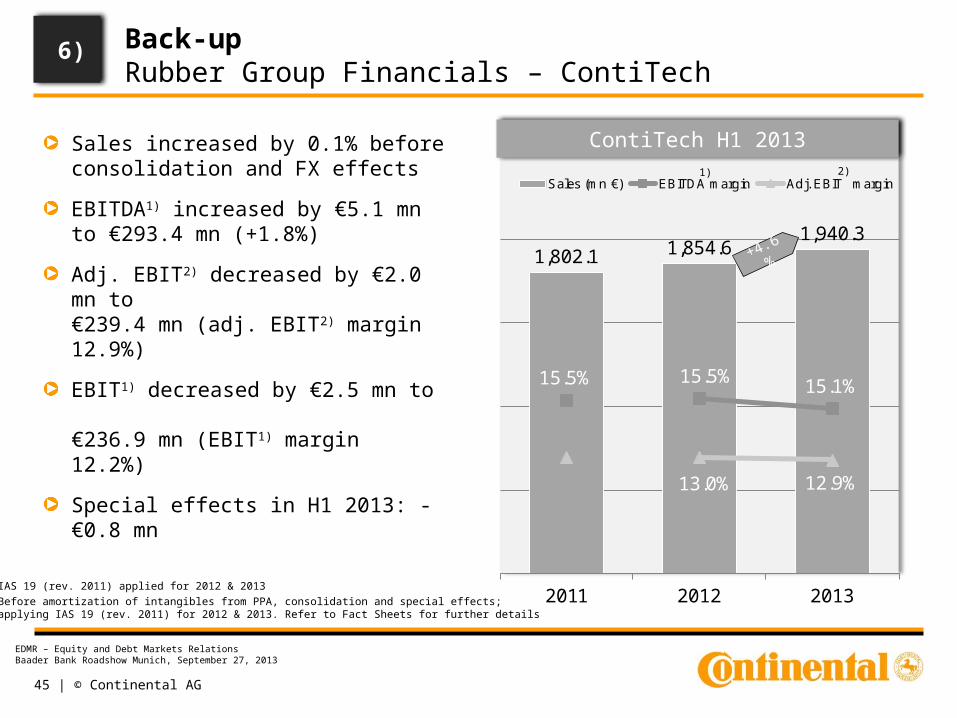
EDMR – Equity and Debt Markets RelationsBaader Bank Roadshow Munich, September 27, 2013
1,802.1 1,854.61,940.3
15.5% 15.5% 15.1%
13.0% 12.9%
2011 2012 2013
Sales (mn €) EBITDA margin Adj. EBIT margin
Back-upRubber Group Financials – ContiTech
ContiTech H1 2013
+4.6%
Sales increased by 0.1% before consolidation and FX effects
EBITDA1) increased by €5.1 mn to €293.4 mn (+1.8%)
Adj. EBIT2) decreased by €2.0 mn to €239.4 mn (adj. EBIT2) margin 12.9%)
EBIT1) decreased by €2.5 mn to €236.9 mn (EBIT1) margin 12.2%)
Special effects in H1 2013: -€0.8 mn
6)
2)
1) IAS 19 (rev. 2011) applied for 2012 & 2013
2) Before amortization of intangibles from PPA, consolidation and special effects;applying IAS 19 (rev. 2011) for 2012 & 2013. Refer to Fact Sheets for further details
1)
46 | © Continental AG
EDMR – Equity and Debt Markets RelationsBaader Bank Roadshow Munich, September 27, 2013
Fact Sheets 2011 – H1 2013
47 | © Continental AG
EDMR – Equity and Debt Markets RelationsBaader Bank Roadshow Munich, September 27, 2013
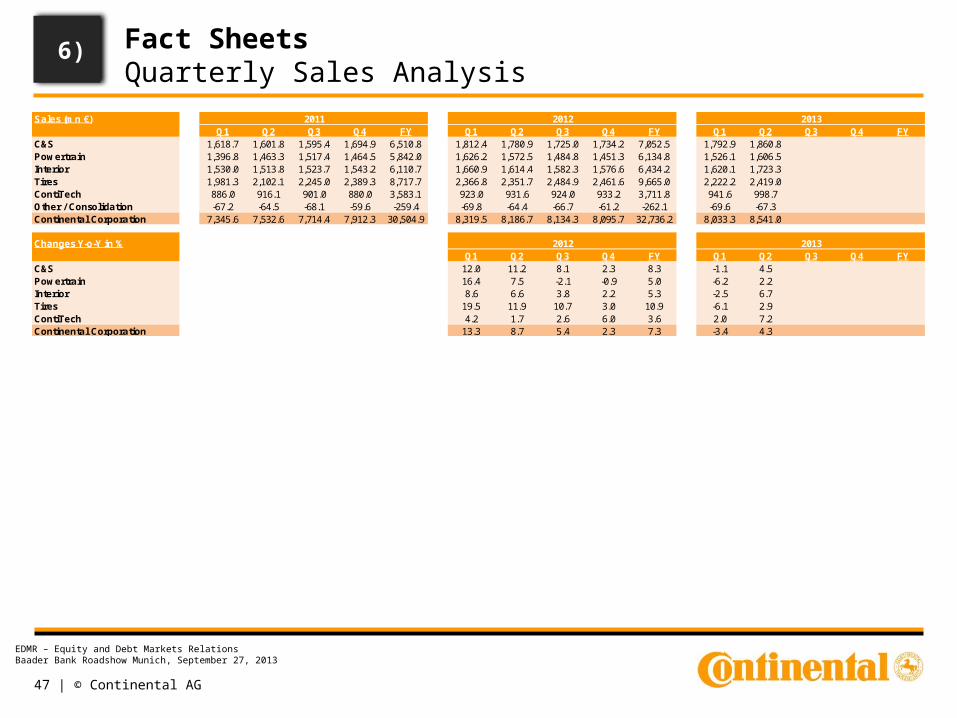
Fact SheetsQuarterly Sales Analysis
6)
Sales (mn €)Q1 Q2 Q3 Q4 FY Q1 Q2 Q3 Q4 FY Q1 Q2 Q3 Q4 FY
C&S 1,618.7 1,601.8 1,595.4 1,694.9 6,510.8 1,812.4 1,780.9 1,725.0 1,734.2 7,052.5 1,792.9 1,860.8Powertrain 1,396.8 1,463.3 1,517.4 1,464.5 5,842.0 1,626.2 1,572.5 1,484.8 1,451.3 6,134.8 1,526.1 1,606.5Interior 1,530.0 1,513.8 1,523.7 1,543.2 6,110.7 1,660.9 1,614.4 1,582.3 1,576.6 6,434.2 1,620.1 1,723.3Tires 1,981.3 2,102.1 2,245.0 2,389.3 8,717.7 2,366.8 2,351.7 2,484.9 2,461.6 9,665.0 2,222.2 2,419.0ContiTech 886.0 916.1 901.0 880.0 3,583.1 923.0 931.6 924.0 933.2 3,711.8 941.6 998.7Other / Consolidation -67.2 -64.5 -68.1 -59.6 -259.4 -69.8 -64.4 -66.7 -61.2 -262.1 -69.6 -67.3Continental Corporation 7,345.6 7,532.6 7,714.4 7,912.3 30,504.9 8,319.5 8,186.7 8,134.3 8,095.7 32,736.2 8,033.3 8,541.0
Changes Y-o-Y in %Q1 Q2 Q3 Q4 FY Q1 Q2 Q3 Q4 FY
C&S 12.0 11.2 8.1 2.3 8.3 -1.1 4.5Powertrain 16.4 7.5 -2.1 -0.9 5.0 -6.2 2.2Interior 8.6 6.6 3.8 2.2 5.3 -2.5 6.7Tires 19.5 11.9 10.7 3.0 10.9 -6.1 2.9ContiTech 4.2 1.7 2.6 6.0 3.6 2.0 7.2Continental Corporation 13.3 8.7 5.4 2.3 7.3 -3.4 4.3
2011 2012 2013
2012 2013

48 | © Continental AG
EDMR – Equity and Debt Markets RelationsBaader Bank Roadshow Munich, September 27, 2013
Fact SheetsQuarterly EBITDA Analysis – IAS 19 (rev. 2011) applied for 2012 & 2013
6)
EBITDA (mn €)Q1 Q2 Q3 Q4 FY Q1 Q2 Q3 Q4 FY Q1 Q2 Q3 Q4 FY
C&S 251.3 246.7 243.3 241.0 982.3 249.8 257.3 237.3 263.5 1,007.9 241.8 250.3Powertrain 120.6 93.7 140.1 130.3 484.7 164.2 153.0 125.0 166.8 609.0 158.9 168.5Interior 174.3 196.3 189.2 199.0 758.8 199.4 212.2 194.0 247.7 853.3 202.1 220.1Tires 356.5 372.2 369.6 428.2 1,526.5 468.5 530.7 522.4 483.5 2,005.1 459.2 533.2ContiTech 140.9 138.1 113.5 122.5 515.0 140.3 148.0 144.2 126.4 558.9 135.9 157.5Other / Consolidation -15.1 -2.8 -18.6 -2.8 -39.3 -18.3 -12.5 -24.6 -10.2 -65.6 -28.5 -19.7Continental Corporation 1,028.5 1,044.2 1,037.1 1,118.2 4,228.0 1,203.9 1,288.7 1,198.3 1,277.7 4,968.6 1,169.4 1,309.9
EBITDA margin in %Q1 Q2 Q3 Q4 FY Q1 Q2 Q3 Q4 FY Q1 Q2 Q3 Q4 FY
C&S 15.5 15.4 15.3 14.2 15.1 13.8 14.4 13.8 15.2 14.3 13.5 13.5Powertrain 8.6 6.4 9.2 8.9 8.3 10.1 9.7 8.4 11.5 9.9 10.4 10.5Interior 11.4 13.0 12.4 12.9 12.4 12.0 13.1 12.3 15.7 13.3 12.5 12.8Tires 18.0 17.7 16.5 17.9 17.5 19.8 22.6 21.0 19.6 20.7 20.7 22.0ContiTech 15.9 15.1 12.6 13.9 14.4 15.2 15.9 15.6 13.5 15.1 14.4 15.8Continental Corporation 14.0 13.9 13.4 14.1 13.9 14.5 15.7 14.7 15.8 15.2 14.6 15.3
Changes Y-o-Y in %Q1 Q2 Q3 Q4 FY Q1 Q2 Q3 Q4 FY
C&S -0.6 4.3 -2.5 9.3 2.6 -3.2 -2.7Powertrain 36.2 63.3 -10.8 28.0 25.6 -3.2 10.1Interior 14.4 8.1 2.5 24.5 12.5 1.4 3.7Tires 31.4 42.6 41.3 12.9 31.4 -2.0 0.5ContiTech -0.4 7.2 27.0 3.2 8.5 -3.1 6.4Continental Corporation 17.1 23.4 15.5 14.3 17.5 -2.9 1.6
2012 2013
2011 2012 2013
2011 2012 2013
49 | © Continental AG
EDMR – Equity and Debt Markets RelationsBaader Bank Roadshow Munich, September 27, 2013
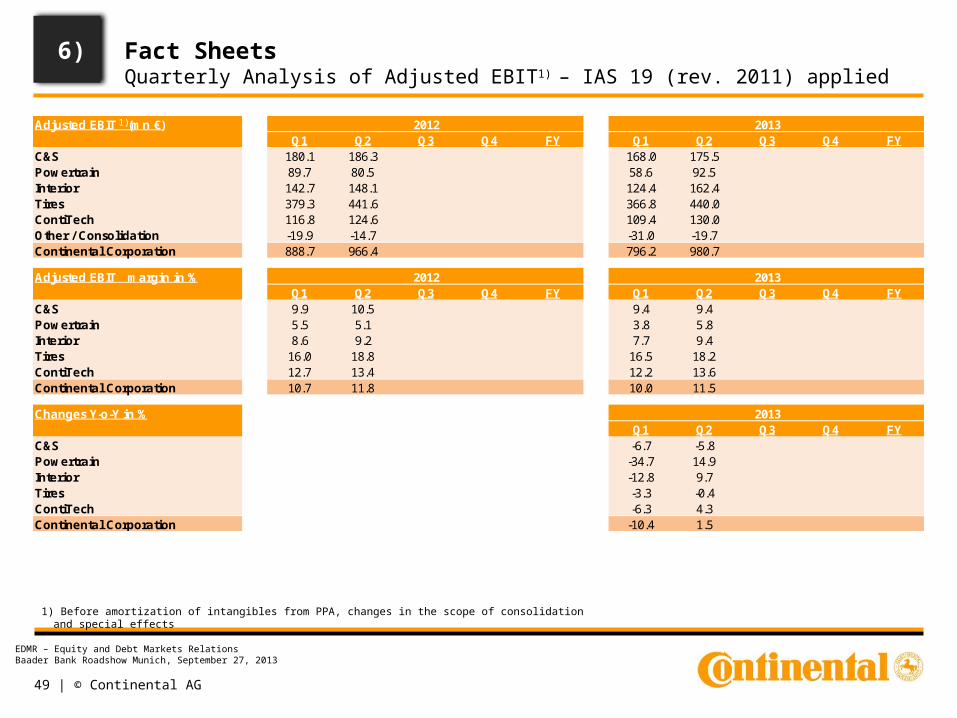
Adjusted EBIT (mn €)Q1 Q2 Q3 Q4 FY Q1 Q2 Q3 Q4 FY
C&S 180.1 186.3 168.0 175.5Powertrain 89.7 80.5 58.6 92.5Interior 142.7 148.1 124.4 162.4Tires 379.3 441.6 366.8 440.0ContiTech 116.8 124.6 109.4 130.0Other / Consolidation -19.9 -14.7 -31.0 -19.7Continental Corporation 888.7 966.4 796.2 980.7
Adjusted EBIT margin in %Q1 Q2 Q3 Q4 FY Q1 Q2 Q3 Q4 FY
C&S 9.9 10.5 9.4 9.4Powertrain 5.5 5.1 3.8 5.8Interior 8.6 9.2 7.7 9.4Tires 16.0 18.8 16.5 18.2ContiTech 12.7 13.4 12.2 13.6Continental Corporation 10.7 11.8 10.0 11.5
Changes Y-o-Y in %Q1 Q2 Q3 Q4 FY
C&S -6.7 -5.8Powertrain -34.7 14.9Interior -12.8 9.7Tires -3.3 -0.4ContiTech -6.3 4.3Continental Corporation -10.4 1.5
2012
2012
2013
2013
2013
Fact SheetsQuarterly Analysis of Adjusted EBIT1) – IAS 19 (rev. 2011) applied
1) Before amortization of intangibles from PPA, changes in the scope of consolidation and special effects
6)
1)
1)
50 | © Continental AG
EDMR – Equity and Debt Markets RelationsBaader Bank Roadshow Munich, September 27, 2013
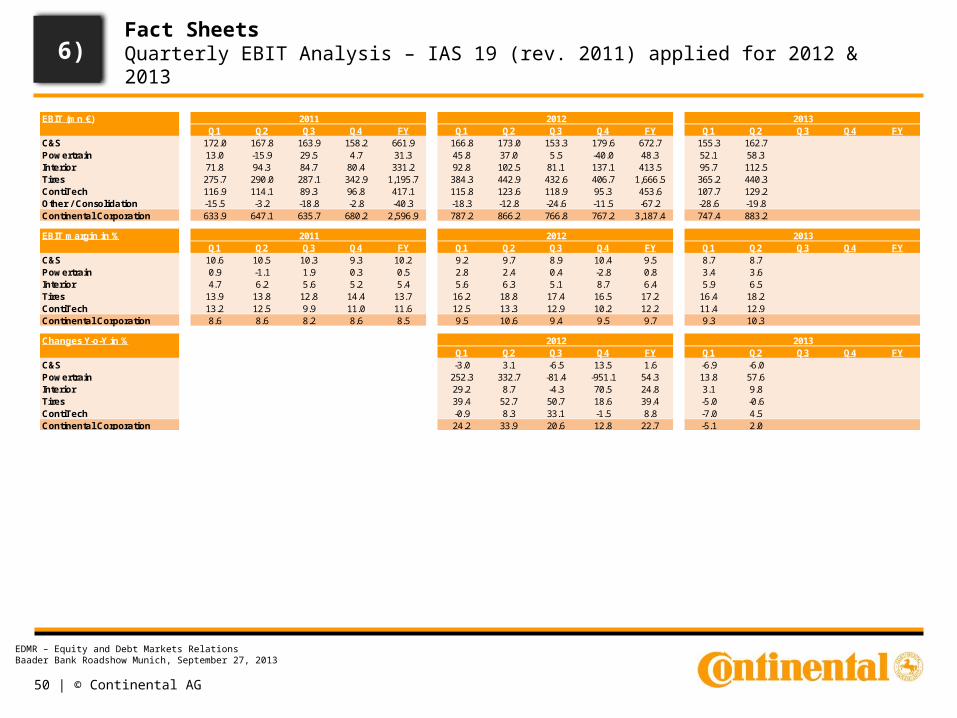
Fact SheetsQuarterly EBIT Analysis – IAS 19 (rev. 2011) applied for 2012 & 2013
6)
EBIT (mn €)Q1 Q2 Q3 Q4 FY Q1 Q2 Q3 Q4 FY Q1 Q2 Q3 Q4 FY
C&S 172.0 167.8 163.9 158.2 661.9 166.8 173.0 153.3 179.6 672.7 155.3 162.7Powertrain 13.0 -15.9 29.5 4.7 31.3 45.8 37.0 5.5 -40.0 48.3 52.1 58.3Interior 71.8 94.3 84.7 80.4 331.2 92.8 102.5 81.1 137.1 413.5 95.7 112.5Tires 275.7 290.0 287.1 342.9 1,195.7 384.3 442.9 432.6 406.7 1,666.5 365.2 440.3ContiTech 116.9 114.1 89.3 96.8 417.1 115.8 123.6 118.9 95.3 453.6 107.7 129.2Other / Consolidation -15.5 -3.2 -18.8 -2.8 -40.3 -18.3 -12.8 -24.6 -11.5 -67.2 -28.6 -19.8Continental Corporation 633.9 647.1 635.7 680.2 2,596.9 787.2 866.2 766.8 767.2 3,187.4 747.4 883.2
EBIT margin in %Q1 Q2 Q3 Q4 FY Q1 Q2 Q3 Q4 FY Q1 Q2 Q3 Q4 FY
C&S 10.6 10.5 10.3 9.3 10.2 9.2 9.7 8.9 10.4 9.5 8.7 8.7Powertrain 0.9 -1.1 1.9 0.3 0.5 2.8 2.4 0.4 -2.8 0.8 3.4 3.6Interior 4.7 6.2 5.6 5.2 5.4 5.6 6.3 5.1 8.7 6.4 5.9 6.5Tires 13.9 13.8 12.8 14.4 13.7 16.2 18.8 17.4 16.5 17.2 16.4 18.2ContiTech 13.2 12.5 9.9 11.0 11.6 12.5 13.3 12.9 10.2 12.2 11.4 12.9Continental Corporation 8.6 8.6 8.2 8.6 8.5 9.5 10.6 9.4 9.5 9.7 9.3 10.3
Changes Y-o-Y in %Q1 Q2 Q3 Q4 FY Q1 Q2 Q3 Q4 FY
C&S -3.0 3.1 -6.5 13.5 1.6 -6.9 -6.0Powertrain 252.3 332.7 -81.4 -951.1 54.3 13.8 57.6Interior 29.2 8.7 -4.3 70.5 24.8 3.1 9.8Tires 39.4 52.7 50.7 18.6 39.4 -5.0 -0.6ContiTech -0.9 8.3 33.1 -1.5 8.8 -7.0 4.5Continental Corporation 24.2 33.9 20.6 12.8 22.7 -5.1 2.0
2011
2011
2012 2013
2012 2013
2012 2013
51 | © Continental AG
EDMR – Equity and Debt Markets RelationsBaader Bank Roadshow Munich, September 27, 2013
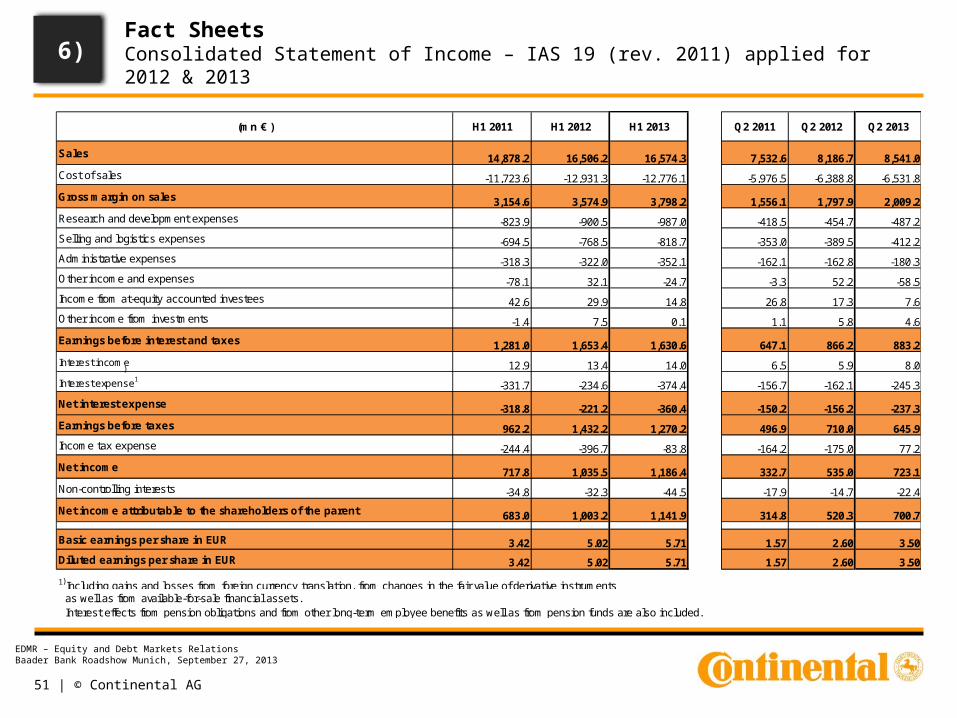
Fact SheetsConsolidated Statement of Income – IAS 19 (rev. 2011) applied for 2012 & 2013
6)
)
Sales 14,878.2 16,506.2 16,574.3 7,532.6 8,186.7 8,541.0
Cost of sales -11,723.6 -12,931.3 -12,776.1 -5,976.5 -6,388.8 -6,531.8
Gross margin on sales 3,154.6 3,574.9 3,798.2 1,556.1 1,797.9 2,009.2
Research and development expenses -823.9 -900.5 -987.0 -418.5 -454.7 -487.2
Selling and logistics expenses -694.5 -768.5 -818.7 -353.0 -389.5 -412.2
Administrative expenses -318.3 -322.0 -352.1 -162.1 -162.8 -180.3
Other income and expenses -78.1 32.1 -24.7 -3.3 52.2 -58.5
Income from at-equity accounted investees 42.6 29.9 14.8 26.8 17.3 7.6
Other income from investments -1.4 7.5 0.1 1.1 5.8 4.6
Earnings before interest and taxes 1,281.0 1,653.4 1,630.6 647.1 866.2 883.2
Interest income 12.9 13.4 14.0 6.5 5.9 8.0
Interest expense1-331.7 -234.6 -374.4 -156.7 -162.1 -245.3
Net interest expense -318.8 -221.2 -360.4 -150.2 -156.2 -237.3
Earnings before taxes 962.2 1,432.2 1,270.2 496.9 710.0 645.9
Income tax expense -244.4 -396.7 -83.8 -164.2 -175.0 77.2
Net income 717.8 1,035.5 1,186.4 332.7 535.0 723.1
Non-controlling interests -34.8 -32.3 -44.5 -17.9 -14.7 -22.4
Net income attributable to the shareholders of the parent 683.0 1,003.2 1,141.9 314.8 520.3 700.7
Basic earnings per share in EUR 3.42 5.02 5.71 1.57 2.60 3.50
Diluted earnings per share in EUR 3.42 5.02 5.71 1.57 2.60 3.50
1 Including gains and losses from foreign currency translation, from changes in the fair value of derivative instruments as well as from available-for-sale financial assets. Interest effects from pension obligations and from other long-term employee benefits as well as from pension funds are also included.
Q2 2011 Q2 2012 Q2 2013(mn € ) H1 2013H1 2012H1 2011
)
52 | © Continental AG
EDMR – Equity and Debt Markets RelationsBaader Bank Roadshow Munich, September 27, 2013
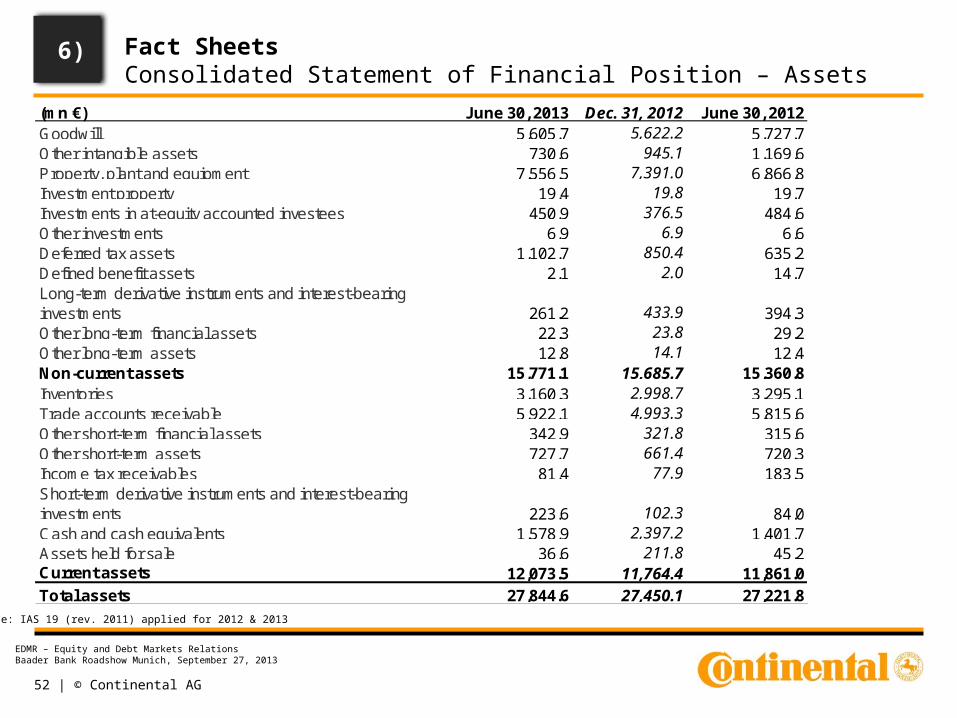
Fact SheetsConsolidated Statement of Financial Position – Assets
6)
Note: IAS 19 (rev. 2011) applied for 2012 & 2013
(mn €) June 30, 2013 Dec. 31, 2012 June 30, 2012Goodwill 5,605.7 5,622.2 5,727.7Other intangible assets 730.6 945.1 1,169.6Property, plant and equipment 7,556.5 7,391.0 6,866.8Investment property 19.4 19.8 19.7Investments in at-equity accounted investees 450.9 376.5 484.6Other investments 6.9 6.9 6.6Deferred tax assets 1,102.7 850.4 635.2Defined benefit assets 2.1 2.0 14.7Long-term derivative instruments and interest-bearing investments 261.2 433.9 394.3Other long-term financial assets 22.3 23.8 29.2Other long-term assets 12.8 14.1 12.4Non-current assets 15,771.1 15,685.7 15,360.8Inventories 3,160.3 2,998.7 3,295.1Trade accounts receivable 5,922.1 4,993.3 5,815.6Other short-term financial assets 342.9 321.8 315.6Other short-term assets 727.7 661.4 720.3Income tax receivables 81.4 77.9 183.5Short-term derivative instruments and interest-bearing investments 223.6 102.3 84.0Cash and cash equivalents 1,578.9 2,397.2 1,401.7Assets held for sale 36.6 211.8 45.2Current assets 12,073.5 11,764.4 11,861.0Total assets 27,844.6 27,450.1 27,221.8
53 | © Continental AG
EDMR – Equity and Debt Markets RelationsBaader Bank Roadshow Munich, September 27, 2013
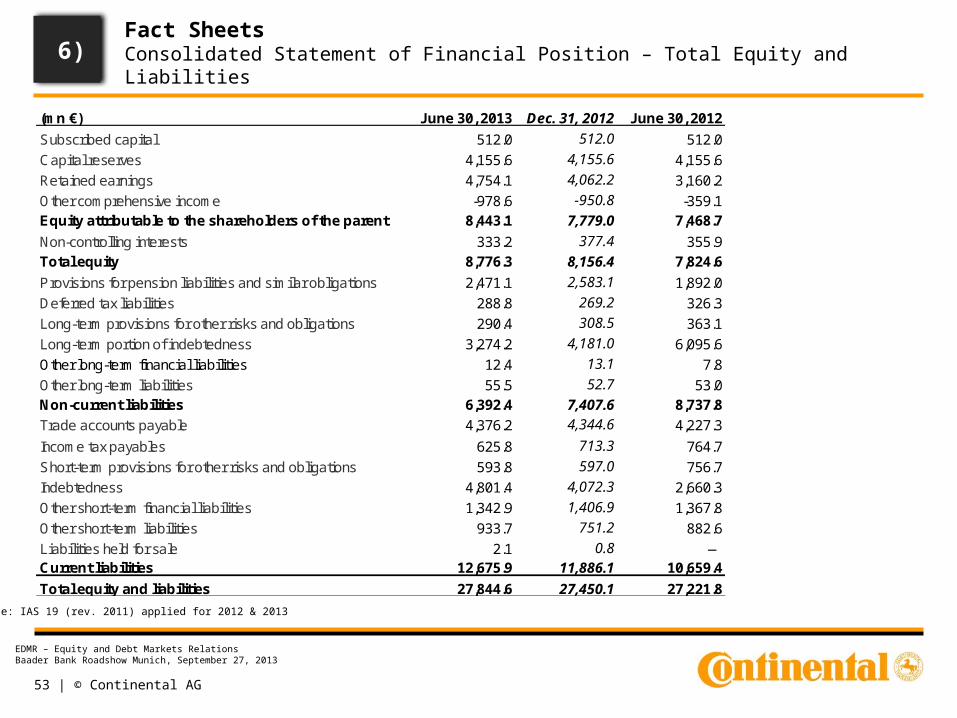
Fact SheetsConsolidated Statement of Financial Position – Total Equity and Liabilities
6)
Note: IAS 19 (rev. 2011) applied for 2012 & 2013
(mn €) June 30, 2013 Dec. 31, 2012 June 30, 2012
Subscribed capital 512.0 512.0 512.0
Capital reserves 4,155.6 4,155.6 4,155.6
Retained earnings 4,754.1 4,062.2 3,160.2
Other comprehensive income -978.6 -950.8 -359.1Equity attributable to the shareholders of the parent 8,443.1 7,779.0 7,468.7
Non-controlling interests 333.2 377.4 355.9Total equity 8,776.3 8,156.4 7,824.6
Provisions for pension liabilities and similar obligations 2,471.1 2,583.1 1,892.0
Deferred tax liabilities 288.8 269.2 326.3
Long-term provisions for other risks and obligations 290.4 308.5 363.1
Long-term portion of indebtedness 3,274.2 4,181.0 6,095.6
Other long-term financial liabilities 12.4 13.1 7.8
Other long-term liabilities 55.5 52.7 53.0Non-current liabilities 6,392.4 7,407.6 8,737.8
Trade accounts payable 4,376.2 4,344.6 4,227.3
Income tax payables 625.8 713.3 764.7
Short-term provisions for other risks and obligations 593.8 597.0 756.7
Indebtedness 4,801.4 4,072.3 2,660.3
Other short-term financial liabilities 1,342.9 1,406.9 1,367.8
Other short-term liabilities 933.7 751.2 882.6
Liabilities held for sale 2.1 0.8 —Current liabilities 12,675.9 11,886.1 10,659.4
Total equity and liabilities 27,844.6 27,450.1 27,221.8
54 | © Continental AG
EDMR – Equity and Debt Markets RelationsBaader Bank Roadshow Munich, September 27, 2013
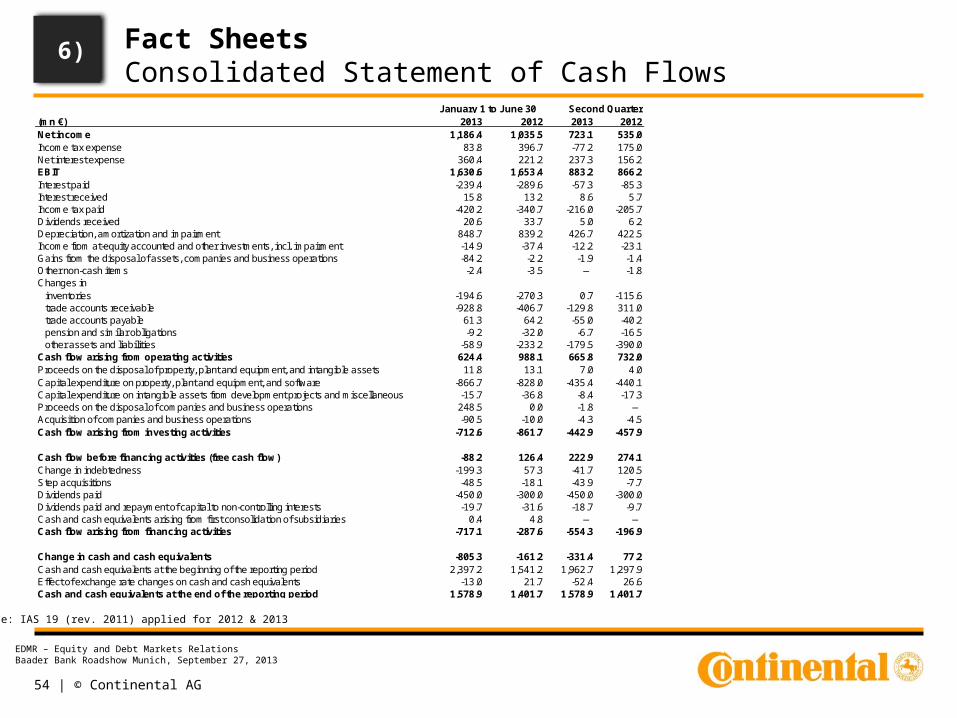
Fact SheetsConsolidated Statement of Cash Flows
6)
Note: IAS 19 (rev. 2011) applied for 2012 & 2013
(mn €) 2013 2012 2013 2012Net income 1,186.4 1,035.5 723.1 535.0Income tax expense 83.8 396.7 -77.2 175.0Net interest expense 360.4 221.2 237.3 156.2EBIT 1,630.6 1,653.4 883.2 866.2Interest paid -239.4 -289.6 -57.3 -85.3Interest received 15.8 13.2 8.6 5.7Income tax paid -420.2 -340.7 -216.0 -205.7Dividends received 20.6 33.7 5.0 6.2Depreciation, amortization and impairment 848.7 839.2 426.7 422.5Income from at-equity accounted and other investments, incl. impairment -14.9 -37.4 -12.2 -23.1Gains from the disposal of assets, companies and business operations -84.2 -2.2 -1.9 -1.4Other non-cash items -2.4 -3.5 — -1.8Changes in
inventories -194.6 -270.3 0.7 -115.6trade accounts receivable -928.8 -406.7 -129.8 311.0trade accounts payable 61.3 64.2 -55.0 -40.2pension and similar obligations -9.2 -32.0 -6.7 -16.5other assets and liabilities -58.9 -233.2 -179.5 -390.0
Cash flow arising from operating activities 624.4 988.1 665.8 732.0Proceeds on the disposal of property, plant and equipment, and intangible assets 11.8 13.1 7.0 4.0Capital expenditure on property, plant and equipment, and software -866.7 -828.0 -435.4 -440.1Capital expenditure on intangible assets from development projects and miscellaneous -15.7 -36.8 -8.4 -17.3Proceeds on the disposal of companies and business operations 248.5 0.0 -1.8 —Acquisition of companies and business operations -90.5 -10.0 -4.3 -4.5Cash flow arising from investing activities -712.6 -861.7 -442.9 -457.9
Cash flow before financing activities (free cash flow) -88.2 126.4 222.9 274.1Change in indebtedness -199.3 57.3 -41.7 120.5Step acquisitions -48.5 -18.1 -43.9 -7.7Dividends paid -450.0 -300.0 -450.0 -300.0Dividends paid and repayment of capital to non-controlling interests -19.7 -31.6 -18.7 -9.7Cash and cash equivalents arising from first consolidation of subsidiaries 0.4 4.8 — —Cash flow arising from financing activities -717.1 -287.6 -554.3 -196.9
Change in cash and cash equivalents -805.3 -161.2 -331.4 77.2Cash and cash equivalents at the beginning of the reporting period 2,397.2 1,541.2 1,962.7 1,297.9Effect of exchange rate changes on cash and cash equivalents -13.0 21.7 -52.4 26.6Cash and cash equivalents at the end of the reporting period 1,578.9 1,401.7 1,578.9 1,401.7
January 1 to June 30 Second Quarter

55 | © Continental AG
EDMR – Equity and Debt Markets RelationsBaader Bank Roadshow Munich, September 27, 2013
2012 2013 2012 2013 2012 2013 2012 2013 2012 2013 2012 2013 2012 2013
EBIT 173.0 162.7 37.0 58.3 102.5 112.5 442.9 440.3 123.6 129.2 -12.8 -19.8 866.2 883.2in % of sales 9.7% 8.7% 2.4% 3.6% 6.3% 6.5% 18.8% 18.2% 13.3% 12.9% 10.6% 10.3%
Amortization of intangible assets from PPA 13.3 13.3 44.3 33.3 51.6 48.1 1.4 1.0 0.7 1.2 -0.1 0.1 111.2 97.0
Total special effects 0.0 -0.3 -0.8 1.4 -4.9 0.0 -2.7 -1.6 0.3 0.1 -1.8 0.0 -9.9 -0.4
Total consolidation effects 0.0 -0.2 0.0 -0.5 -1.1 1.8 0.0 0.3 0.0 -0.5 0.0 0.0 -1.1 0.9
Total consolidation & special effects 0.0 -0.5 -0.8 0.9 -6.0 1.8 -2.7 -1.3 0.3 -0.4 -1.8 0.0 -11.0 0.5
Adjusted operating result (adj. EBIT) 1) 186.3 175.5 80.5 92.5 148.1 162.4 441.6 440.0 124.6 130.0 -14.7 -19.7 966.4 980.7in % of adjusted sales 10.5% 9.4% 5.1% 5.8% 9.2% 9.4% 18.8% 18.2% 13.4% 13.6% 11.8% 11.5%
The prior year figures have been adjusted according to IAS 19 rev. 2011. 1) Before amortization of intangible assets from PPA, changes in the scope of consolidation and special effects.
InteriorChassis & Safety Powertrain Tires ContiTech Cons./Corr. Corporation
Fact SheetsQ2 2013 Results Reported & Adjusted (mn €) – by Division
6)
56 | © Continental AG
EDMR – Equity and Debt Markets RelationsBaader Bank Roadshow Munich, September 27, 2013
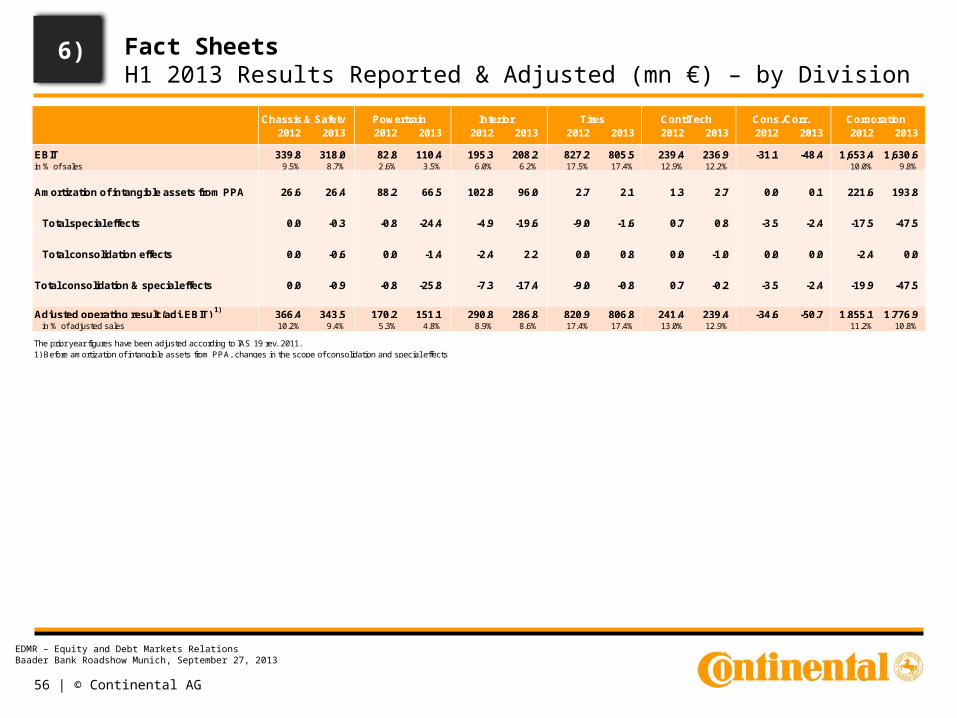
Fact SheetsH1 2013 Results Reported & Adjusted (mn €) – by Division
6)
2012 2013 2012 2013 2012 2013 2012 2013 2012 2013 2012 2013 2012 2013
EBIT 339.8 318.0 82.8 110.4 195.3 208.2 827.2 805.5 239.4 236.9 -31.1 -48.4 1,653.4 1,630.6in % of sales 9.5% 8.7% 2.6% 3.5% 6.0% 6.2% 17.5% 17.4% 12.9% 12.2% 10.0% 9.8%
Amortization of intangible assets from PPA 26.6 26.4 88.2 66.5 102.8 96.0 2.7 2.1 1.3 2.7 0.0 0.1 221.6 193.8
Total special effects 0.0 -0.3 -0.8 -24.4 -4.9 -19.6 -9.0 -1.6 0.7 0.8 -3.5 -2.4 -17.5 -47.5
Total consolidation effects 0.0 -0.6 0.0 -1.4 -2.4 2.2 0.0 0.8 0.0 -1.0 0.0 0.0 -2.4 0.0
Total consolidation & special effects 0.0 -0.9 -0.8 -25.8 -7.3 -17.4 -9.0 -0.8 0.7 -0.2 -3.5 -2.4 -19.9 -47.5
Adjusted operating result (adj. EBIT) 1) 366.4 343.5 170.2 151.1 290.8 286.8 820.9 806.8 241.4 239.4 -34.6 -50.7 1,855.1 1,776.9in % of adjusted sales 10.2% 9.4% 5.3% 4.8% 8.9% 8.6% 17.4% 17.4% 13.0% 12.9% 11.2% 10.8%
The prior year figures have been adjusted according to IAS 19 rev. 2011. 1) Before amortization of intangible assets from PPA, changes in the scope of consolidation and special effects.
InteriorChassis & Safety Powertrain Tires ContiTech Cons./Corr. Corporation
57 | © Continental AG
EDMR – Equity and Debt Markets RelationsBaader Bank Roadshow Munich, September 27, 2013
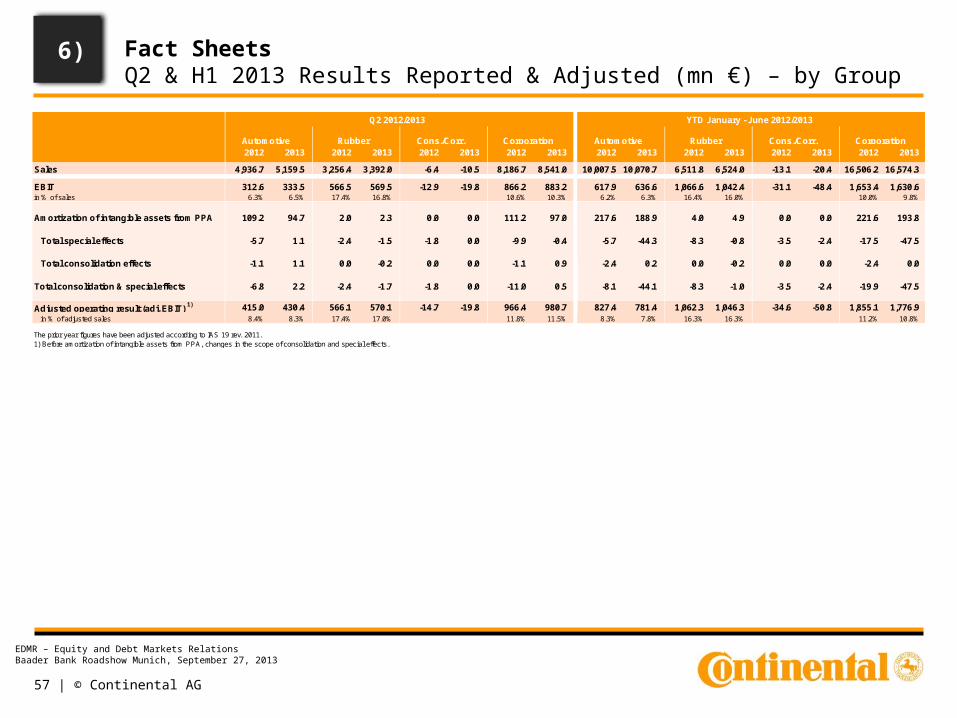
Fact SheetsQ2 & H1 2013 Results Reported & Adjusted (mn €) – by Group
6)
2012 2013 2012 2013 2012 2013 2012 2013 2012 2013 2012 2013 2012 2013 2012 2013
Sales 4,936.7 5,159.5 3,256.4 3,392.0 -6.4 -10.5 8,186.7 8,541.0 10,007.5 10,070.7 6,511.8 6,524.0 -13.1 -20.4 16,506.2 16,574.3
EBIT 312.6 333.5 566.5 569.5 -12.9 -19.8 866.2 883.2 617.9 636.6 1,066.6 1,042.4 -31.1 -48.4 1,653.4 1,630.6in % of sales 6.3% 6.5% 17.4% 16.8% 10.6% 10.3% 6.2% 6.3% 16.4% 16.0% 10.0% 9.8%
Amortization of intangible assets from PPA 109.2 94.7 2.0 2.3 0.0 0.0 111.2 97.0 217.6 188.9 4.0 4.9 0.0 0.0 221.6 193.8
Total special effects -5.7 1.1 -2.4 -1.5 -1.8 0.0 -9.9 -0.4 -5.7 -44.3 -8.3 -0.8 -3.5 -2.4 -17.5 -47.5
Total consolidation effects -1.1 1.1 0.0 -0.2 0.0 0.0 -1.1 0.9 -2.4 0.2 0.0 -0.2 0.0 0.0 -2.4 0.0
Total consolidation & special effects -6.8 2.2 -2.4 -1.7 -1.8 0.0 -11.0 0.5 -8.1 -44.1 -8.3 -1.0 -3.5 -2.4 -19.9 -47.5
Adjusted operating result (adj. EBIT) 1) 415.0 430.4 566.1 570.1 -14.7 -19.8 966.4 980.7 827.4 781.4 1,062.3 1,046.3 -34.6 -50.8 1,855.1 1,776.9in % of adjusted sales 8.4% 8.3% 17.4% 17.0% 11.8% 11.5% 8.3% 7.8% 16.3% 16.3% 11.2% 10.8%
The prior year figures have been adjusted according to IAS 19 rev. 2011. 1) Before amortization of intangible assets from PPA, changes in the scope of consolidation and special effects.
YTD January - June 2012/2013
Automotive Rubber Cons./Corr. Corporation
Q2 2012/2013
Automotive Rubber Cons./Corr. Corporation
58 | © Continental AG
EDMR – Equity and Debt Markets RelationsBaader Bank Roadshow Munich, September 27, 2013
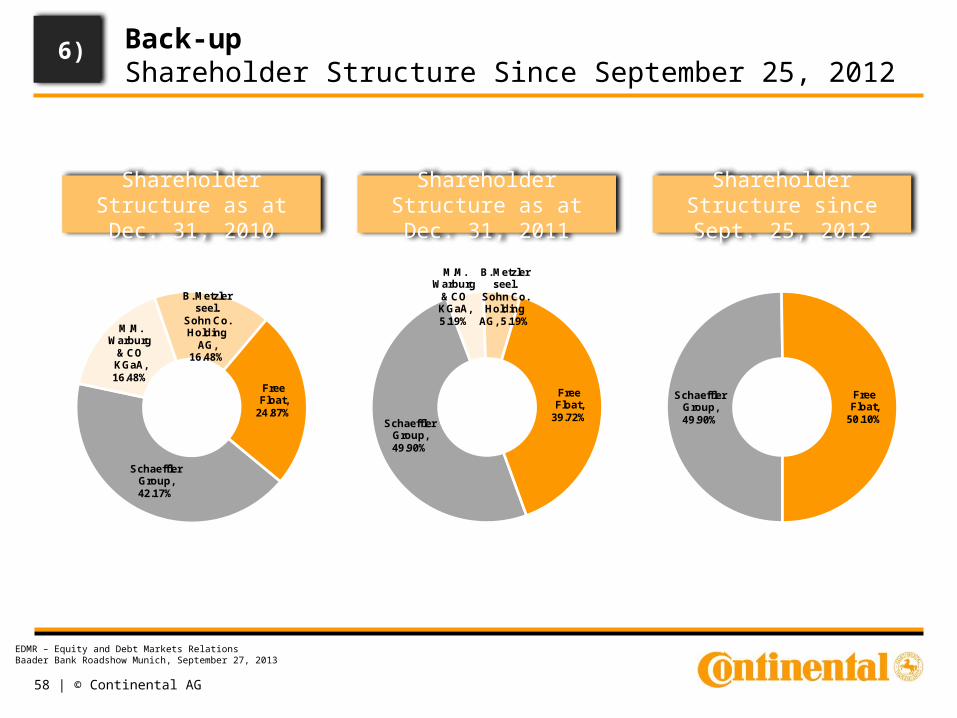
Back-upShareholder Structure Since September 25, 2012
Schaeffler Group, 49.90%
Free Float,
50.10%
Shareholder Structure as at Dec. 31, 2010
Shareholder Structure as at Dec. 31, 2011
Shareholder Structure since Sept. 25, 2012
6)
Schaeffler Group, 42.17%
M.M. Warburg
& CO KGaA, 16.48%
B. Metzler seel.
Sohn Co. Holding
AG, 16.48%
Free Float,
24.87%Schaeffler
Group, 49.90%
M.M. Warburg
& CO KGaA, 5.19%
B. Metzler seel.
Sohn Co. Holding
AG, 5.19%
Free Float,
39.72%

59 | © Continental AG
EDMR – Equity and Debt Markets RelationsBaader Bank Roadshow Munich, September 27, 2013
Back-upRating of S&P and Moody’s Since 2000
1) S&P: “The SACP is not a rating but a rating component that reflects our opinion of a company’s creditworthiness absent any extraordinary intervention from its parent“.
6)
Ba2
09/28/12
Rat
ing BBB+
BBBBBB+
BBB+
05/19/00 10/31/01 08/06/04 11/16/07 09/26/08 01/27/09 08/13/09
Non-Investment Grade
Investment Grade
Credit Rating Standard & Poor’s:
Rat
ing Baa1
Baa2Baa1
Baa2Baa3
Ba1
Ba3
05/19/00 11/15/01 01/04/05 02/26/08 11/07/08 12/18/08 06/02/09
Non-Investment Grade
Investment Grade
Credit Rating Moody’s:
08/14/09
B1
Ba2
02/23/09
05/18/10
04/05/11
Ba3
07/20/11 05/16/12
BB-B+
BBB
S&P on May 24, 2013: "We have raised our assessment of Continental’s stand-alone credit profile(SACP) to ‘BBB’ to reflect the improved financial risk profile. On a stand-alone basis, we view Continental’s financial risk profile as intermediate1)."Before Siemens VDO
Before Siemens VDO
SACP1):
BB
BBB
B
05/24/13
BBB-
On May 31, 2013: Moody’s acknowledges that Conti’s so called “Grid-Indicated Rating” is currently ‘Baa2’ and reflects the ‘A’ rated competitive position and its ‘A’ rated ability to generate FCF through the business cycle
60 | © Continental AG
EDMR – Equity and Debt Markets RelationsBaader Bank Roadshow Munich, September 27, 2013
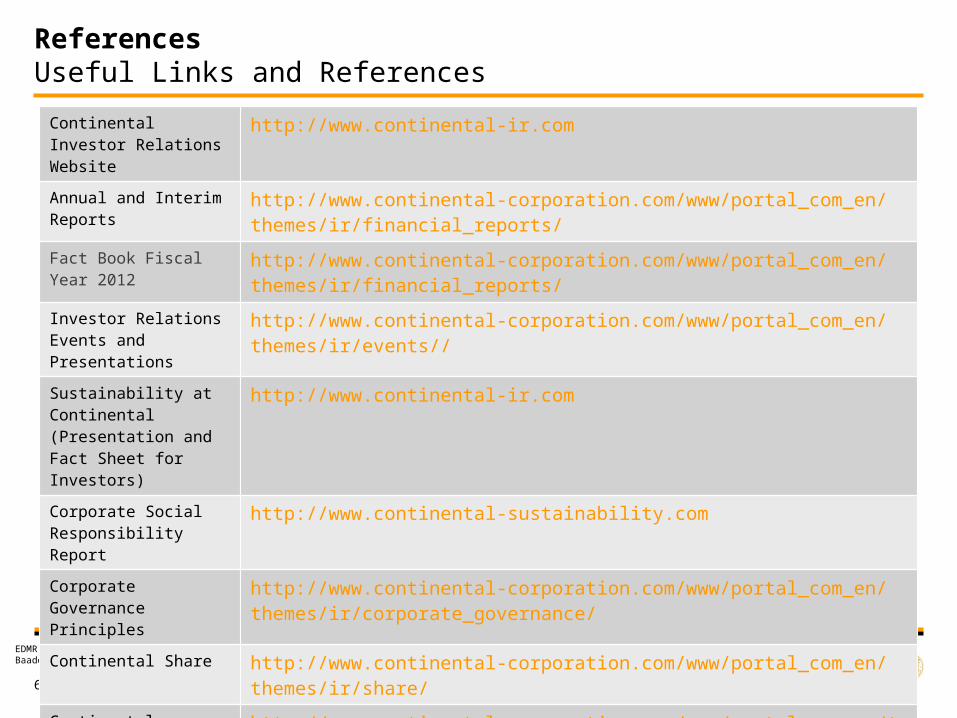
ReferencesUseful Links and References
Continental Investor Relations Website
http://www.continental-ir.com
Annual and Interim Reports
http://www.continental-corporation.com/www/portal_com_en/themes/ir/financial_reports/
Fact Book Fiscal Year 2012
http://www.continental-corporation.com/www/portal_com_en/themes/ir/financial_reports/
Investor RelationsEvents and Presentations
http://www.continental-corporation.com/www/portal_com_en/themes/ir/events//
Sustainability at Continental (Presentation and Fact Sheet for Investors)
http://www.continental-ir.com
Corporate Social Responsibility Report
http://www.continental-sustainability.com
Corporate Governance Principles
http://www.continental-corporation.com/www/portal_com_en/themes/ir/corporate_governance/
Continental Share http://www.continental-corporation.com/www/portal_com_en/themes/ir/share/
Continental Bonds and Rating
http://www.continental-corporation.com/www/portal_com_en/themes/ir/bonds/