Embed Size (px)
Citation preview
1. Construction employment in the United States, 2003-2014 (All employment)
2003 2004 2005 2006 2007 2008 2009 2010 2011 2012 2013 20140
2
4
6
8
10
12
2.1 2.3 2.6 2.9 3.0 2.7 2.3 2.2 2.2 2.2 2.4 2.7
Hispanic Non-Hispanic
Year
Num
ber o
f em
ploy
ees (
in m
illio
ns)
9.19.1 8.9 9.39.8
Source: U.S. Bureau of Labor Statistics, 2003-2014 Current Population Survey. Calculations by the CPWR Data Center.
10.110.7
11.211.7 11.8
10.9
9.7

2. Number of Hispanic workers in construction, foreign- vs. native-born, 2003-2014(All employment)
2003 2004 2005 2006 2007 2008 2009 2010 2011 2012 2013 20140
500
1,000
1,500
2,000
2,500
3,000
3,500
1,486 1,6461,926
2,250 2,2582,006
1,629 1,679 1,639 1,598 1,7181,983
Foreign-born Hispanic Native-bornYear
Num
ber o
f em
ploy
ees (
in th
ousa
nds)
2,2262,225 2,1612,393
2,705
Source: U.S. Bureau of Labor Statistics, 2003-2014 Current Population Survey. Calculations by the CPWR Data Center.
2,0702,280
2,577
2,946 2,980
2,688
2,260
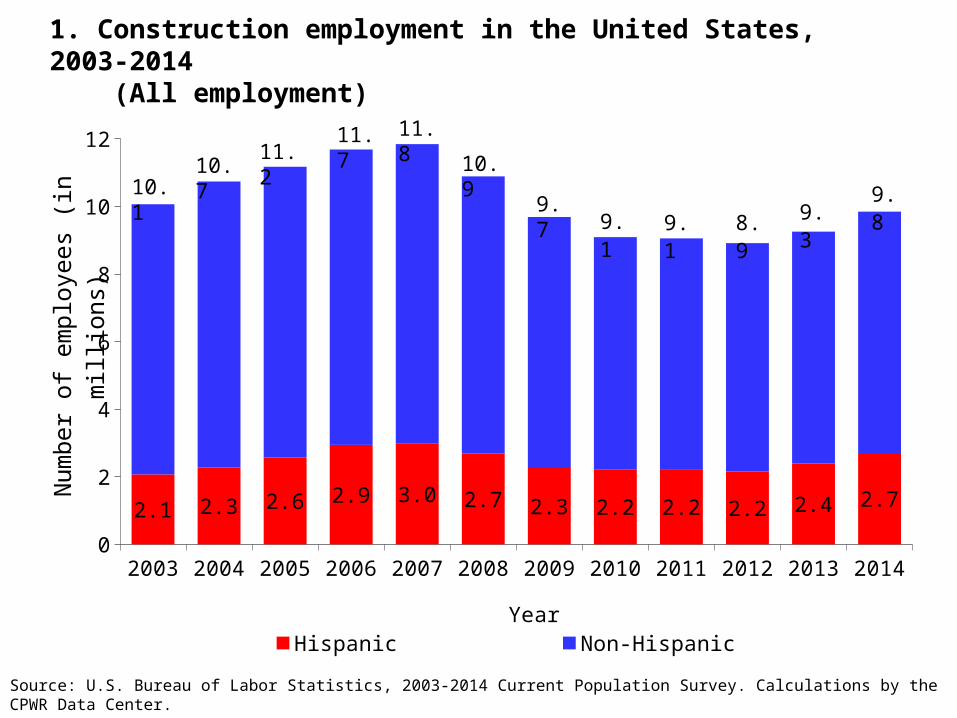
3. Change in construction employment, by major subsector, 2007-2014 (Seasonally adjusted: private wage-and-salary workers)
2007 2008 2009 2010 2011 2012 2013 2014
-35%
-30%
-25%
-20%
-15%
-10%
-5%
0%
5%
Construction of BuildingsHeavy & Civil Engineering ConstructionSpecialty Trade Contractors
Year
Chan
ge si
nce
Janu
ary
2007
(%)
Note: November and December 2014 numbers are preliminary.Source: US Bureau of Labor Statistics, 2007-2014 Current Employment Statistics. Calculations by the CPWR Data Center.
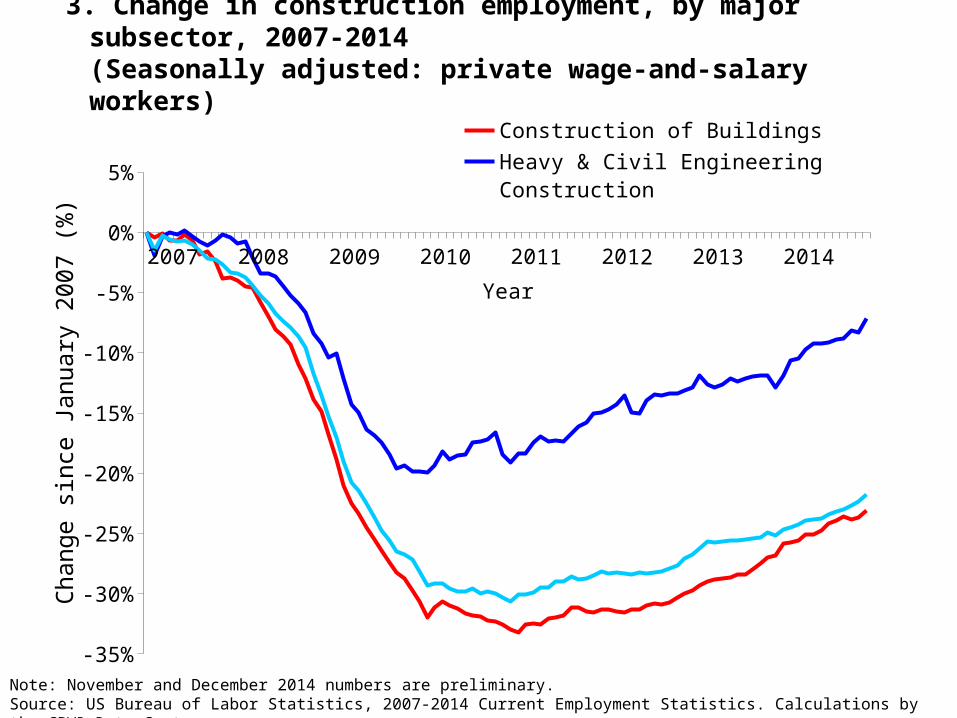
4. Monthly unemployment rate, construction vs. all nonfarm, 2007-2014(Not seasonally adjusted: private wage-and-salary workers)
2007 2008 2009 2010 2011 2012 2013 20140%
5%
10%
15%
20%
25%
30%
Construction
All nonfarm
Year
Une
mpl
oym
ent r
ate
Source: U.S. Bureau of Labor Statistics, 2007-2014 Current Population Survey.
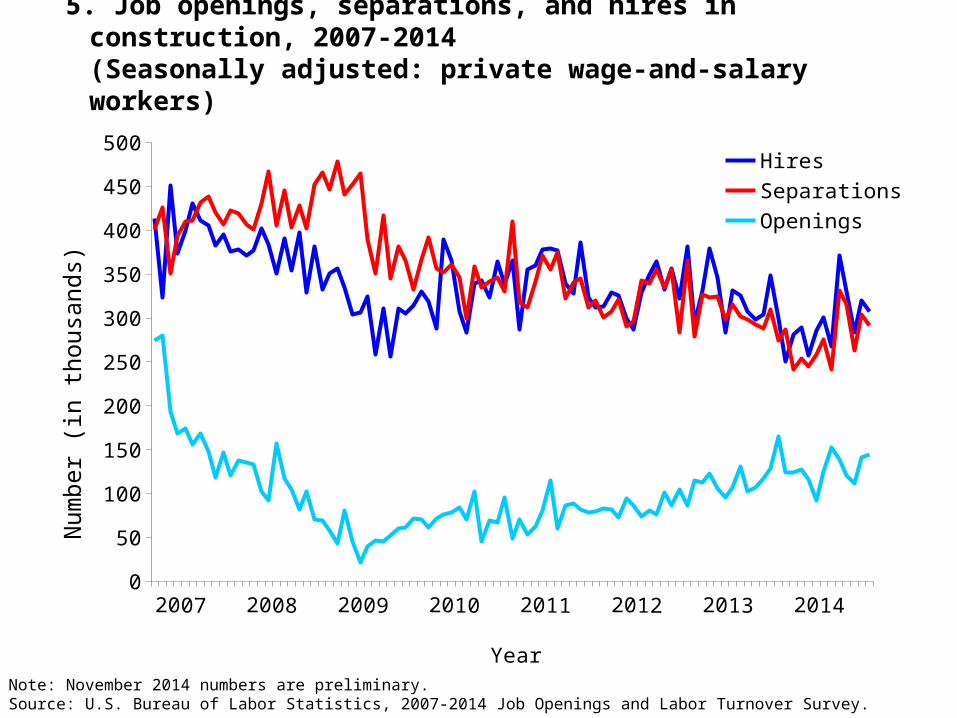
5. Job openings, separations, and hires in construction, 2007-2014(Seasonally adjusted: private wage-and-salary workers)
2007 2008 2009 2010 2011 2012 2013 20140
50
100
150
200
250
300
350
400
450
500HiresSeparationsOpenings
Year
Num
ber (
in th
ousa
nds)
Note: November 2014 numbers are preliminary.Source: U.S. Bureau of Labor Statistics, 2007-2014 Job Openings and Labor Turnover Survey.
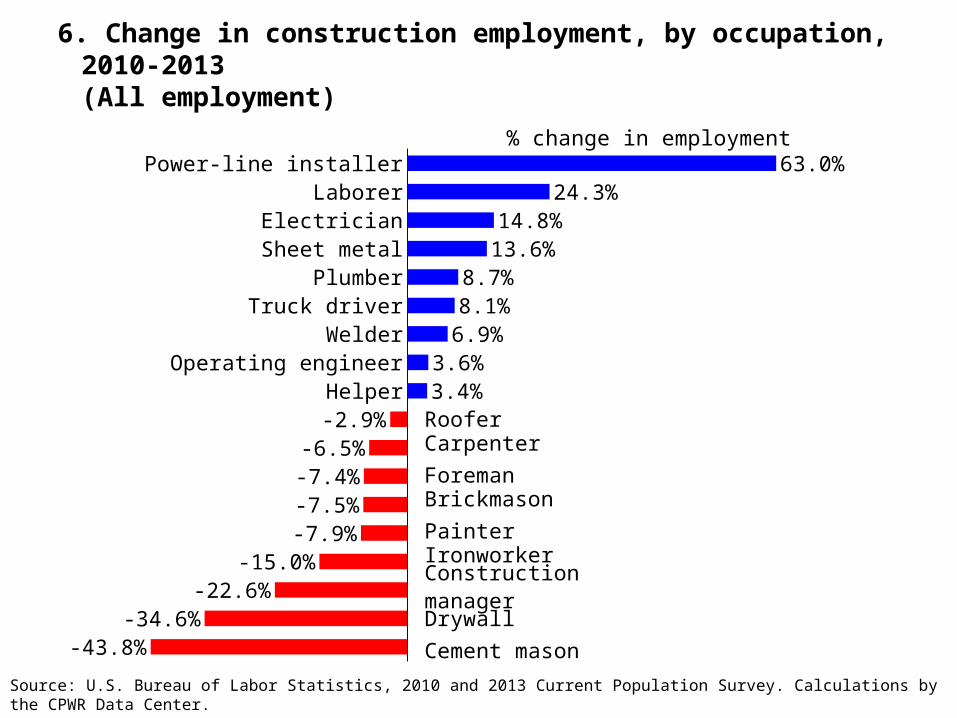
6. Change in construction employment, by occupation, 2010-2013(All employment)
Source: U.S. Bureau of Labor Statistics, 2010 and 2013 Current Population Survey. Calculations by the CPWR Data Center.
Power-line installerLaborer
ElectricianSheet metal
PlumberTruck driver
WelderOperating engineer
Helper
63.0%24.3%
14.8%13.6%
8.7%8.1%
6.9%3.6%3.4%
-2.9%-6.5%
-7.4%-7.5%-7.9%
-15.0%-22.6%
-34.6%-43.8%
% change in employment
RooferCarpenterForemanBrickmasonPainterIronworkerConstruction managerDrywallCement mason
Source: U.S. Bureau of Labor Statistics, 2010 and 2013 Current Employment Statistics. Calculations by the CPWR Data Center.
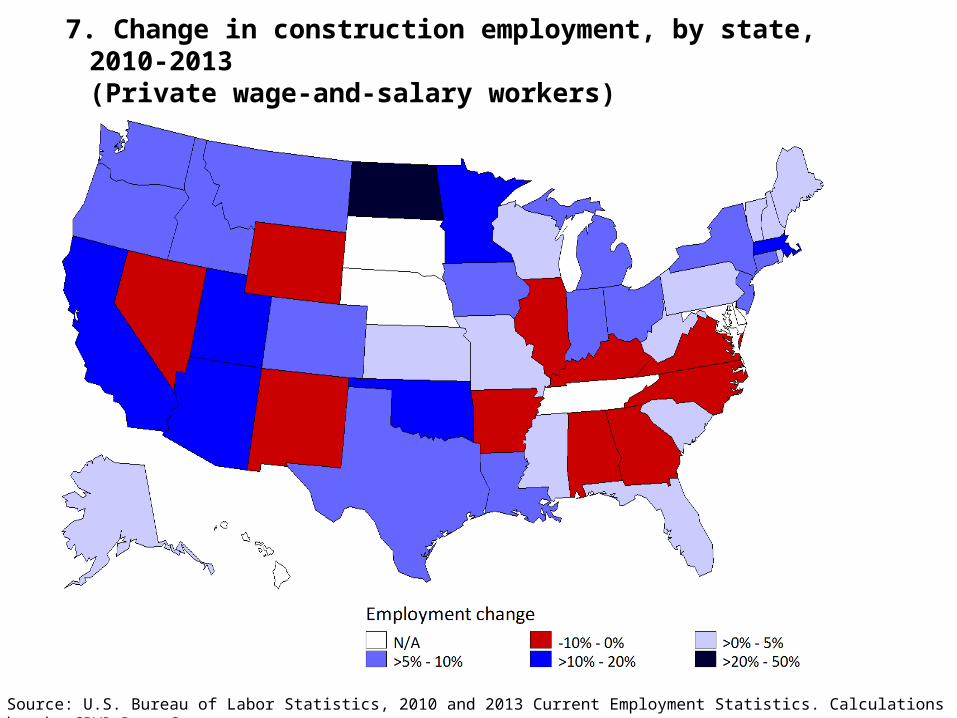
7. Change in construction employment, by state, 2010-2013(Private wage-and-salary workers)
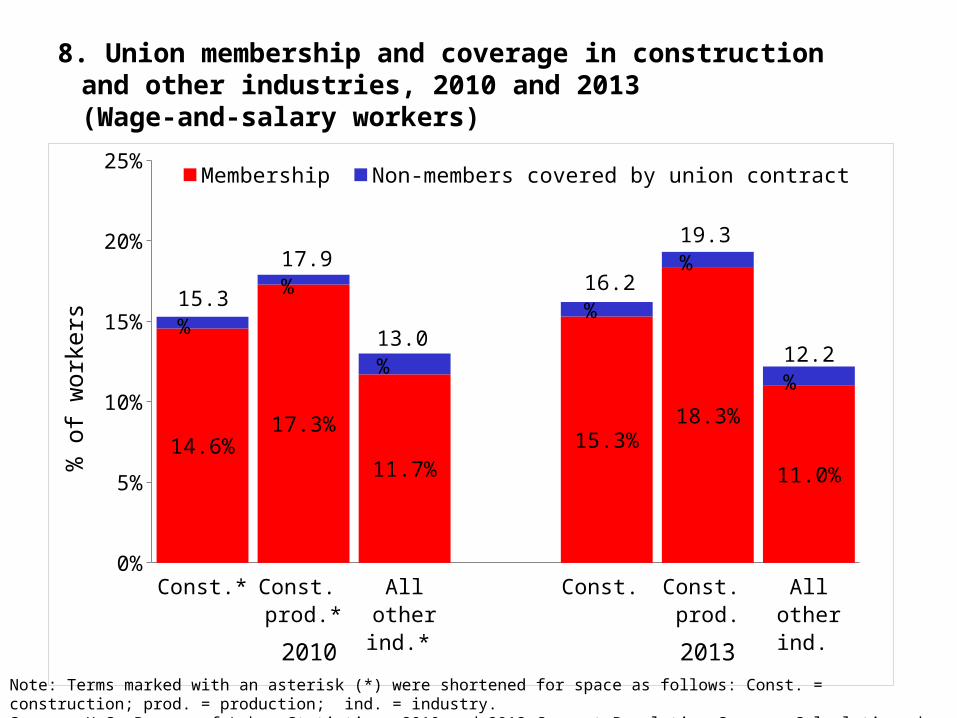
Const.* Const. prod.*
All other ind.*
Const. Const. prod.
All other ind.
0%
5%
10%
15%
20%
25%
14.6%17.3%
11.7%15.3%
18.3%
11.0%
Membership Non-members covered by union contract
% o
f wor
kers
15.3%
13.0%
16.2%
12.2%
17.9% 19.3%
2010 2013
8. Union membership and coverage in construction and other industries, 2010 and 2013(Wage-and-salary workers)
Note: Terms marked with an asterisk (*) were shortened for space as follows: Const. = construction; prod. = production; ind. = industry.Source: U.S. Bureau of Labor Statistics. 2010 and 2013 Current Population Survey. Calculations by the CPWR Data Center.
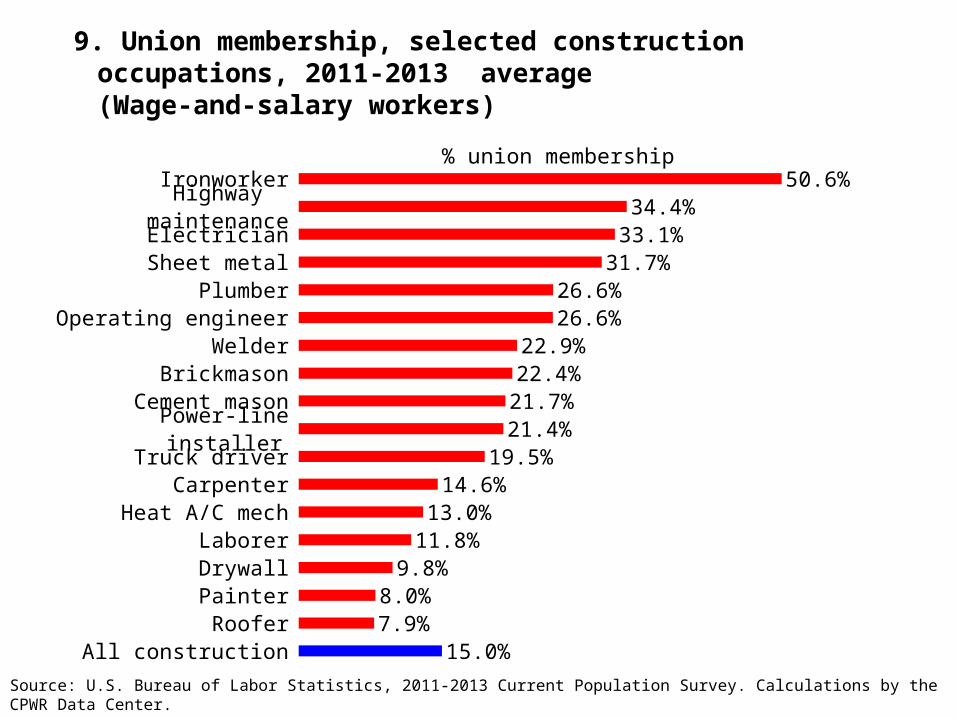
9. Union membership, selected construction occupations, 2011-2013 average (Wage-and-salary workers)
IronworkerHighway maintenance
ElectricianSheet metal
PlumberOperating engineer
WelderBrickmason
Cement masonPower-line installer
Truck driverCarpenter
Heat A/C mechLaborerDrywallPainterRoofer
All construction
50.6%34.4%
33.1%31.7%
26.6%26.6%
22.9%22.4%
21.7%21.4%
19.5%14.6%
13.0%11.8%
9.8%8.0%7.9%
15.0%
% union membership
Source: U.S. Bureau of Labor Statistics, 2011-2013 Current Population Survey. Calculations by the CPWR Data Center.
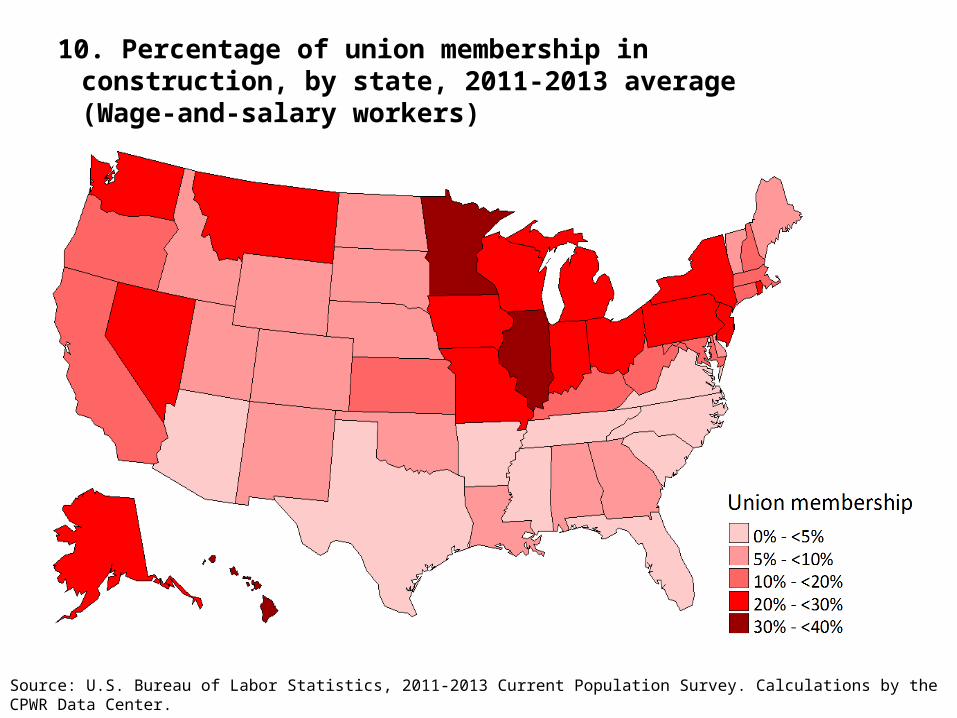
10. Percentage of union membership in construction, by state, 2011-2013 average(Wage-and-salary workers)
Source: U.S. Bureau of Labor Statistics, 2011-2013 Current Population Survey. Calculations by the CPWR Data Center.
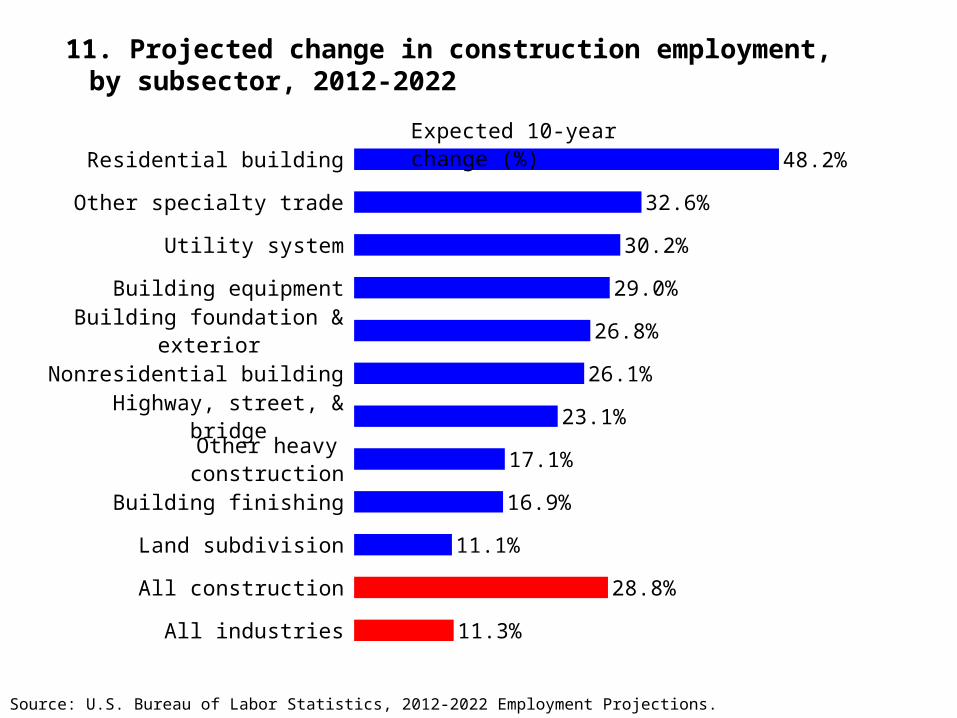
11. Projected change in construction employment, by subsector, 2012-2022
Residential building
Other specialty trade
Utility system
Building equipment
Building foundation & exterior
Nonresidential building
Highway, street, & bridge
Other heavy construction
Building finishing
Land subdivision
All construction
All industries
48.2%
32.6%
30.2%
29.0%
26.8%
26.1%
23.1%
17.1%
16.9%
11.1%
28.8%
11.3%
Expected 10-year change (%)
Source: U.S. Bureau of Labor Statistics, 2012-2022 Employment Projections.
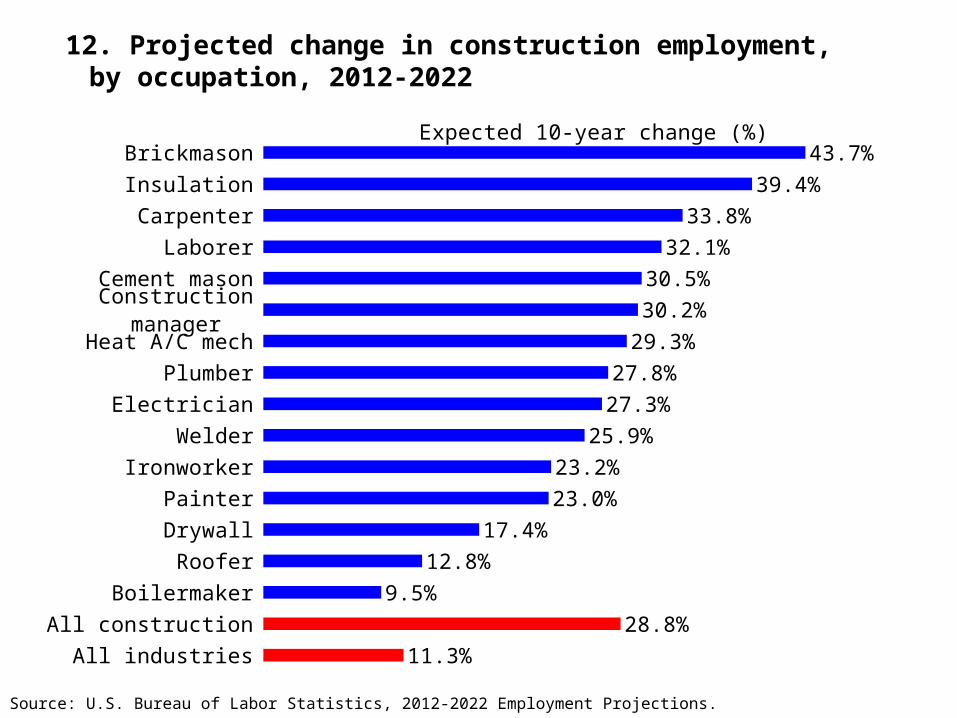
12. Projected change in construction employment, by occupation, 2012-2022
Source: U.S. Bureau of Labor Statistics, 2012-2022 Employment Projections.
BrickmasonInsulationCarpenter
LaborerCement mason
Construction managerHeat A/C mech
PlumberElectrician
WelderIronworker
PainterDrywallRoofer
BoilermakerAll construction
All industries
43.7%39.4%
33.8%32.1%
30.5%30.2%
29.3%27.8%
27.3%25.9%
23.2%23.0%
17.4%12.8%
9.5%28.8%
11.3%
Expected 10-year change (%)
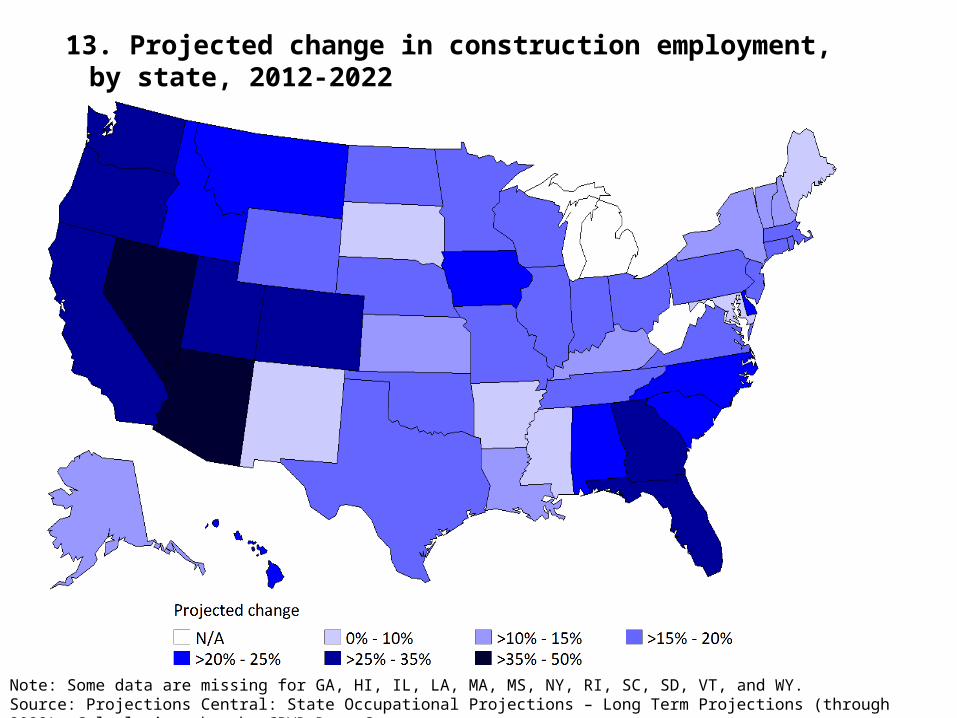
Note: Some data are missing for GA, HI, IL, LA, MA, MS, NY, RI, SC, SD, VT, and WY. Source: Projections Central: State Occupational Projections – Long Term Projections (through 2022). Calculations by the CPWR Data Center.
13. Projected change in construction employment, by state, 2012-2022