Embed Size (px)
Citation preview
1
Journal of Banking & Finance, 2008, Volume 32, Number 8, Pages 1541-1551.
Comparing the performance of market-based and accounting-based bankruptcy
prediction models
Vineet Agarwal a and Richard Taffler b,*
a Cranfield School of Management, Cranfield, Bedford, MK43 0AL, UKb The Management School, University of Edinburgh, 50 George Square, Edinburgh, EH8
9JY, UK
Abstract
Recently developed corporate bankruptcy prediction models adopt a contingent-
claims valuation approach. However, despite their theoretical appeal, tests of their
performance compared with traditional simple accounting-ratio-based approaches are limited
in the literature. We find the two approaches capture different aspects of bankruptcy risk, and
while there is little difference in their predictive ability in the UK, the z-score approach leads
to significantly greater bank profitability in conditions of differential decision error costs and
competitive pricing regime.
JEL classifications: C52, G13, G33, M41
Keywords: failure prediction, credit risk, option-pricing models, z-score, bank profitability
*Corresponding author. Tel: +44 (0) 131 6511375; Fax: +44 (0) 131 6508837.
E-mail address: [email protected] paper has benefited, in particular, from the comments of the anonymous referee, who has helped insignificantly improving its contribution, Jonathan Crook, Sudi Sudarsanam, Alexander Reisz, and participants atthe 30th anniversary conference of the Journal of Banking and Finance, Beijing, 2006, and the EuropeanFinancial Management Association annual meeting, Vienna, 2007.This paper was reviewed and accepted while Prof. Giorgio Szego was the Managing Editor of the Journal ofBanking and Finance and by the past editorial board.
2
1. Introduction
There is renewed interest in credit risk assessment, inter alia, driven by the requirements
of Basle II and explosive growth in the credit derivatives market.1 This, and the concern
about the lack of theoretical underpinning of traditional accounting-ratio-based models such
as the Altman (1968) z-score, has led to the application of the contingent claims valuation
methodology for predicting corporate failure with the KMV model now extensively
employed by banks and financial institutions. However, empirical tests of the relative power
of the two approaches are lacking in the literature. The only published study, that of
Hillegeist et al. (2004), is deficient in comparing the market-based approach with the Altman
(1968) and Ohlson (1980) accounting-ratio-based models which are known to suffer from
high misclassification rates (e.g. Begley et al., 1996). It also does not take into account
differential error misclassification costs and the economic benefits of using different credit
risk assessment approaches. In any case, a more valid comparison would be with the
commercially available Zeta® (Altman et al., 1977) model which has far superior
performance (e.g. Altman, 1993:219-220).
Under Basel II, banks are allowed to use internal ratings-based approaches to set capital
charges with respect to the credit risks of their portfolios. Hence, research in this area
assumes greater significance because a poor credit risk model could lead to sub-optimal
capital allocation.
Accounting-ratio based models are typically built by searching through a large number of
accounting ratios with the ratio weightings estimated on a sample of failed and non-failed
firms. Since the ratios and their weightings are derived from sample analysis, such models are
likely to be sample specific. Mensah (1984) finds that the distribution of accounting ratios
1 This interest is also demonstrated by the wide range of papers in the special issue on ‘Credit Ratings and the
Proposed New BIS Guidelines on Capital Adequacy for Bank Credit Assets’ in the Journal of Banking and
Finance (ed. Altman, 2001).
3
changes over time, and hence recommends that such models be redeveloped periodically. In
addition, the very nature of the accounting statements on which these models are based casts
doubt on their validity: (i) accounting statements present past performance of a firm and may
or may not be informative in predicting the future, (ii) conservatism and historical cost
accounting mean that the true asset values may be very different from the recorded book
values, (iii) accounting numbers are subject to manipulation by management, and in addition,
(iv) Hillegeist et al. (2004) argue that since the accounting statements are prepared on a
going-concern basis, they are, by design, of limited utility in predicting bankruptcy.
Market-based models using the Black and Scholes (1973) and Merton (1974) contingent
claims approach provide a more appealing alternative and there have been several recent
papers using this approach for assessing the likelihood of corporate failure (e.g., Bharath and
Shumway, 2004; Hillegeist et al., 2004; Reisz and Perlich, 2004; Vassalou and Xing, 2004;
Campbell et al., 2006). Such a methodological approach counters most of the above
criticisms of accounting-ratio-based models: (i) it provides a sound theoretical model for firm
bankruptcy, (ii) in efficient markets, stock prices will reflect all the information contained in
accounting statements and will also contain information not in the accounting statements, (iii)
market variables are unlikely to be influenced by firm accounting policies, (iv) market prices
reflect future expected cashflows, and hence should be more appropriate for prediction
purposes, and (v) the output of such models is not time or sample dependent.
However, the Merton model is a structural model and operationalizing it requires a
number of assumptions. For instance, as Saunders and Allen (2002: 58-61) point out, the
underlying theoretical model requires the assumption of normality of stock returns. It also
does not distinguish between different types of debt and assumes that the firm only has a
single zero coupon loan. In addition, it requires measures of asset value and volatility which
are unobservable. It is therefore not surprising that the empirical evidence on the performance
4
of market-based models is mixed. Kealhofer (2003) and Oderda et al. (2003) find that such
models outperform credit ratings, and in their empirical comparisons Hillegeist et al. (2004)
suggest their derived model carries more information about the probability of bankruptcy
than poorly performing accounting-ratio based models. On the other hand, Campbell et al.
(2006) find such market-based models have little forecasting power after controlling for other
variables. Similarly, Reisz and Perlich (2004) find that Altman’s (1968) z-score does a
slightly better job at failure prediction over a 1-year period than both their KMV-type and
computationally much more intensive down-and-out barrier option models, though their
market-based models are better over longer horizons (3 to 10 years).
This paper compares the performance of the well-known and widely used UK-based z-
score model of Taffler (1984) originally published in a special issue of this journal on
international credit risk models against carefully developed market-based models over a 17-
year period from 1985 to 2001 using Receiver Operating Characteristic (ROC) curves and
information content tests. Importantly, we use the framework of Stein (2005) and Blöchlinger
and Leippold (2006a), and extend the analysis to compare the market shares, revenues and
profitability of banks employing these competing models taking into consideration
differential error misclassification costs. Using a sample of middle-market borrowers, Stein
(2005), in a largely theoretical paper, demonstrates that small differences in model power can
lead to significant economic impact for the user. In contrast, we use the mixed regime
framework of Blochlinger and Leippold (2006a), and apply this to all UK-listed firms over a
17-year period. We also introduce a specific risk-based performance measure based on the
Foundation Approach under Basel II. As Caouette et al. (1998:148) point out:
“Ultimately, however, the real issue is how well the models work and to what extent their
use contributes to improved financial performance of the institution. A conceptual model
that does not perform has no advantage over a statistical model that does.”

5
The main conclusions of this study are: (i) while the z-score model is marginally more
accurate, the difference is statistically not significant, (ii) in a competitive loan market, a
bank using the z-score approach would realize significantly higher risk-adjusted revenues,
profits, return on capital employed, and return on risk adjusted capital than a bank employing
the comparative market-based credit risk assessment approach, and (iii) relative information
content tests find that both the z-score and market-based approaches yield estimates that carry
significant information about failure, but neither method subsumes the other.
Our results demonstrate that traditional accounting-ratio-based bankruptcy risk models
are, in fact, not inferior to KMV-type option-based models for credit risk assessment
purposes, and dominate in terms of potential bank profitability when differential error
misclassification costs and loan prices are taken into account. The apparent superiority of the
market-based model approach claimed by Hillegeist et al. (2004) reflects the poor
performance of their comparator models, not a particularly strong performance by their
option-pricing model.
The paper proceeds as follows: the next section describes data sources and different
models used, and section 3 presents the evaluation metrics adopted. Results are reported in
section 4 and conclusions drawn in section 5.
2. Data and method
This section describes our sample, data and market-based and accounting-ratio-based
models.
2.1. Sample selection
This study covers all non-finance industry UK firms fully listed on the London Stock
Exchange (LSE) at any time during the period 1985-2001. If a firm changes industry or
exchange of listing, it enters the respective portfolio only after it has been listed on the (main)
6
London Stock Exchange and/or is classified as non-financial for twenty-four months. To be
included in the sample, firms are required to have been listed for at least 24 months before the
portfolio formation date to ensure that only post-listing accounting information is used.
To ensure that the required accounting information is available at the time of portfolio
formation, a five-month lag between the fiscal year-end date and the reporting date is
assumed. So, for the portfolio formed on 30th September, book value of equity and z-score
are derived from the latest available financial statements with fiscal year-end on or before
April 30th. The final sample consists of 2,006 firms, a total of 15,384 firm years, and 103
failures (0.67%), with the failure event defined as entry into administration, receivership, or
creditors’ voluntary liquidation procedures. The yearly number of firms in the sample ranges
from a minimum of 798 in 1992 to a maximum of 1,014 in 1997.
Table 1 here
2.2. Data
The accounting data is collected from Thomson Financial Company Analysis, EXSTAT,
MicroEXSTAT and DATASTREAM databases in that order. Exchange of listing and firm
stock exchange industrial classifications are collected from the London Business School
London Share Price Database (LSPD). The risk free rates (1-month Treasury bill (T-Bill)
rates), market value of equity and daily stock prices are collected from DATASTREAM. The
list of firm failures is compiled from LSPD (codes 7, 16 and 20), the Stock Exchange Official
Yearbook, and CGT Capital Losses published by FT Interactive.
2.3. Method
A. Market-based models
Two market-based models, one following Hillegeist et al. (2004), and the other a naïve
market-based model following Bharath and Shumway (2004) are used. Both the models are
7
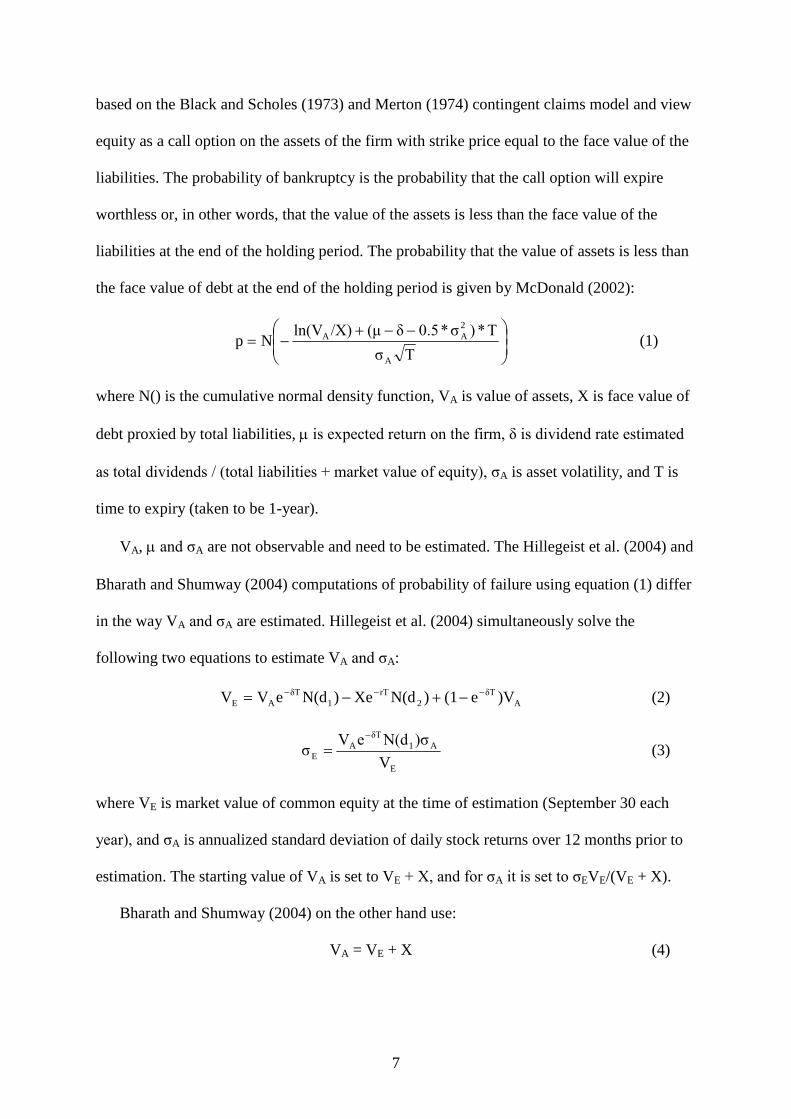
based on the Black and Scholes (1973) and Merton (1974) contingent claims model and view
equity as a call option on the assets of the firm with strike price equal to the face value of the
liabilities. The probability of bankruptcy is the probability that the call option will expire
worthless or, in other words, that the value of the assets is less than the face value of the
liabilities at the end of the holding period. The probability that the value of assets is less than
the face value of debt at the end of the holding period is given by McDonald (2002):
Tσ
T*)σ*0.5δ(μ/X)ln(VNp
A
2AA (1)
where N() is the cumulative normal density function, VA is value of assets, X is face value of
debt proxied by total liabilities, is expected return on the firm, δ is dividend rate estimated
as total dividends / (total liabilities + market value of equity), σA is asset volatility, and T is
time to expiry (taken to be 1-year).
VA, and σA are not observable and need to be estimated. The Hillegeist et al. (2004) and
Bharath and Shumway (2004) computations of probability of failure using equation (1) differ
in the way VA and σA are estimated. Hillegeist et al. (2004) simultaneously solve the
following two equations to estimate VA and σA:
AδT
2rT
1δT
AE )Ve(1)N(dXe)N(deVV (2)
E
A1δT
AE
V
)σN(deVσ
(3)
where VE is market value of common equity at the time of estimation (September 30 each
year), and σA is annualized standard deviation of daily stock returns over 12 months prior to
estimation. The starting value of VA is set to VE + X, and for σA it is set to σEVE/(VE + X).
Bharath and Shumway (2004) on the other hand use:
VA = VE + X (4)
8
D
A
E
A
EA σ
V
Xσ
V
Vσ (5)
ED σ*0.250.05σ (6)
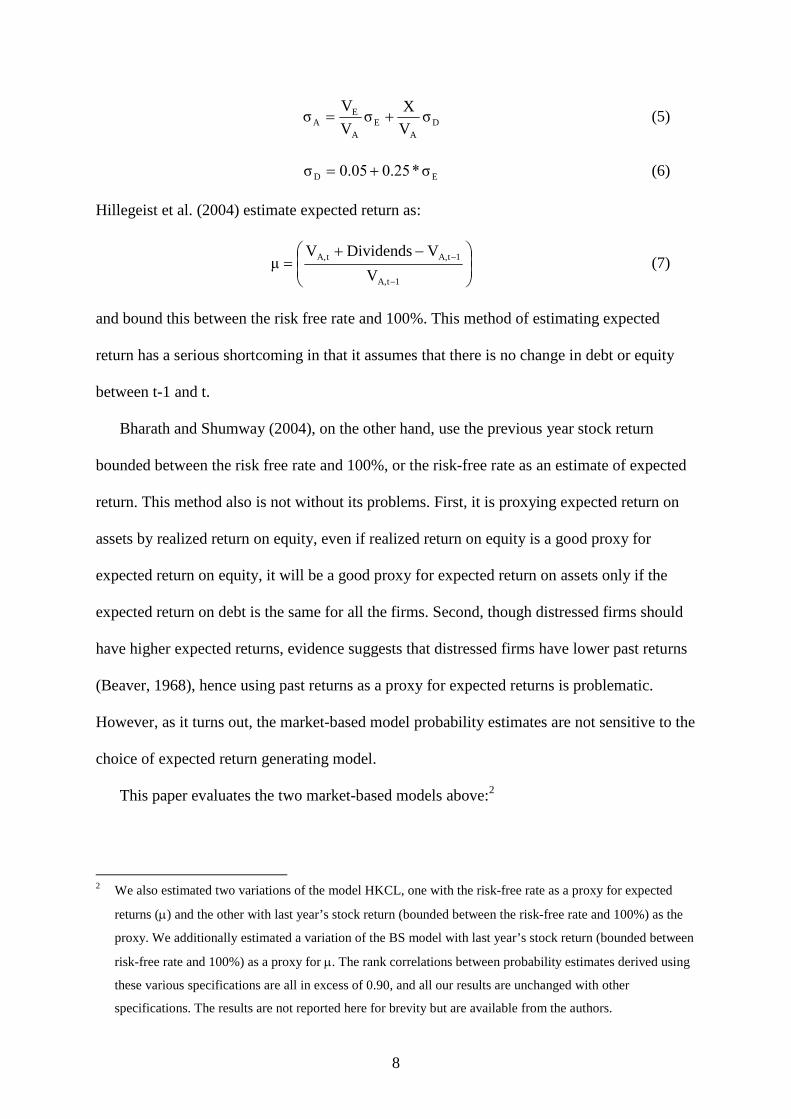
Hillegeist et al. (2004) estimate expected return as:
1tA,
1tA,tA,
V
VDividendsVμ (7)
and bound this between the risk free rate and 100%. This method of estimating expected
return has a serious shortcoming in that it assumes that there is no change in debt or equity
between t-1 and t.
Bharath and Shumway (2004), on the other hand, use the previous year stock return
bounded between the risk free rate and 100%, or the risk-free rate as an estimate of expected
return. This method also is not without its problems. First, it is proxying expected return on
assets by realized return on equity, even if realized return on equity is a good proxy for
expected return on equity, it will be a good proxy for expected return on assets only if the
expected return on debt is the same for all the firms. Second, though distressed firms should
have higher expected returns, evidence suggests that distressed firms have lower past returns
(Beaver, 1968), hence using past returns as a proxy for expected returns is problematic.
However, as it turns out, the market-based model probability estimates are not sensitive to the
choice of expected return generating model.
This paper evaluates the two market-based models above:2
2 We also estimated two variations of the model HKCL, one with the risk-free rate as a proxy for expected
returns () and the other with last year’s stock return (bounded between the risk-free rate and 100%) as the
proxy. We additionally estimated a variation of the BS model with last year’s stock return (bounded between
risk-free rate and 100%) as a proxy for . The rank correlations between probability estimates derived using
these various specifications are all in excess of 0.90, and all our results are unchanged with other
specifications. The results are not reported here for brevity but are available from the authors.
9
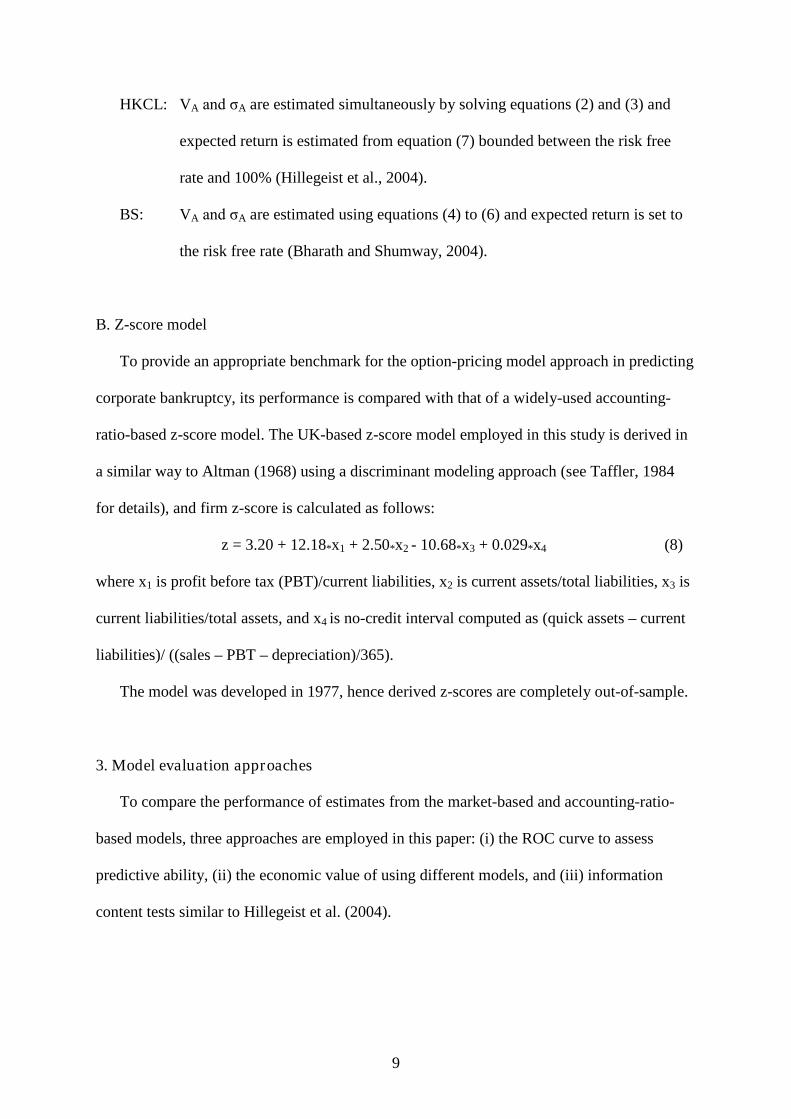
HKCL: VA and σA are estimated simultaneously by solving equations (2) and (3) and
expected return is estimated from equation (7) bounded between the risk free
rate and 100% (Hillegeist et al., 2004).
BS: VA and σA are estimated using equations (4) to (6) and expected return is set to
the risk free rate (Bharath and Shumway, 2004).
B. Z-score model
To provide an appropriate benchmark for the option-pricing model approach in predicting
corporate bankruptcy, its performance is compared with that of a widely-used accounting-
ratio-based z-score model. The UK-based z-score model employed in this study is derived in
a similar way to Altman (1968) using a discriminant modeling approach (see Taffler, 1984
for details), and firm z-score is calculated as follows:
z = 3.20 + 12.18*x1 + 2.50*x2 - 10.68*x3 + 0.029*x4 (8)
where x1 is profit before tax (PBT)/current liabilities, x2 is current assets/total liabilities, x3 is
current liabilities/total assets, and x4 is no-credit interval computed as (quick assets – current
liabilities)/ ((sales – PBT – depreciation)/365).
The model was developed in 1977, hence derived z-scores are completely out-of-sample.
3. Model evaluation approaches
To compare the performance of estimates from the market-based and accounting-ratio-
based models, three approaches are employed in this paper: (i) the ROC curve to assess
predictive ability, (ii) the economic value of using different models, and (iii) information
content tests similar to Hillegeist et al. (2004).
10
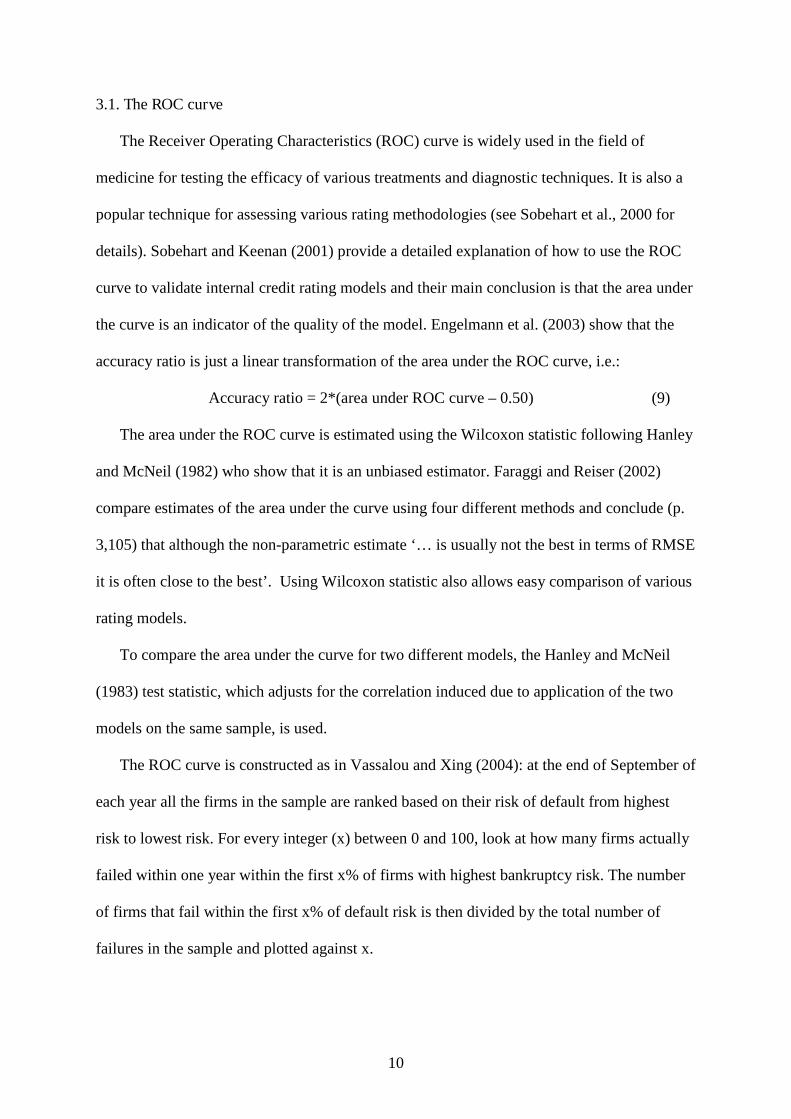
3.1. The ROC curve
The Receiver Operating Characteristics (ROC) curve is widely used in the field of
medicine for testing the efficacy of various treatments and diagnostic techniques. It is also a
popular technique for assessing various rating methodologies (see Sobehart et al., 2000 for
details). Sobehart and Keenan (2001) provide a detailed explanation of how to use the ROC
curve to validate internal credit rating models and their main conclusion is that the area under
the curve is an indicator of the quality of the model. Engelmann et al. (2003) show that the
accuracy ratio is just a linear transformation of the area under the ROC curve, i.e.:
Accuracy ratio = 2*(area under ROC curve – 0.50) (9)
The area under the ROC curve is estimated using the Wilcoxon statistic following Hanley
and McNeil (1982) who show that it is an unbiased estimator. Faraggi and Reiser (2002)
compare estimates of the area under the curve using four different methods and conclude (p.
3,105) that although the non-parametric estimate ‘… is usually not the best in terms of RMSE
it is often close to the best’. Using Wilcoxon statistic also allows easy comparison of various
rating models.
To compare the area under the curve for two different models, the Hanley and McNeil
(1983) test statistic, which adjusts for the correlation induced due to application of the two
models on the same sample, is used.
The ROC curve is constructed as in Vassalou and Xing (2004): at the end of September of
each year all the firms in the sample are ranked based on their risk of default from highest
risk to lowest risk. For every integer (x) between 0 and 100, look at how many firms actually
failed within one year within the first x% of firms with highest bankruptcy risk. The number
of firms that fail within the first x% of default risk is then divided by the total number of
failures in the sample and plotted against x.
11
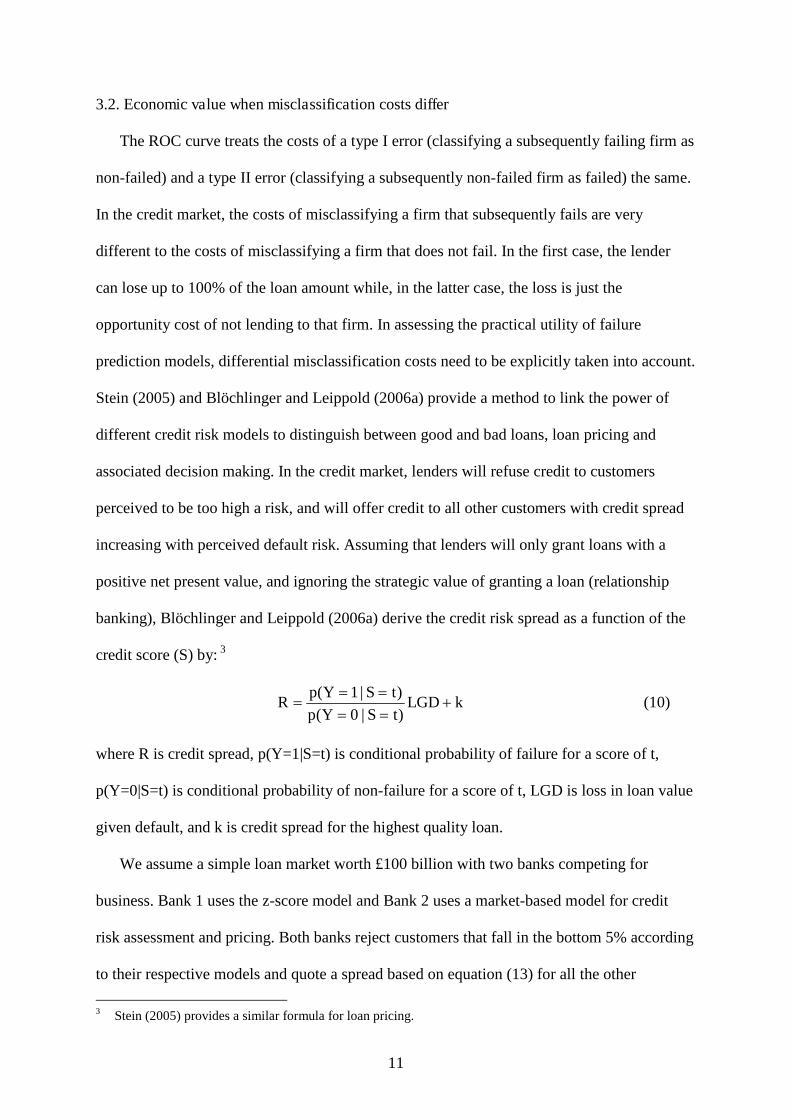
3.2. Economic value when misclassification costs differ
The ROC curve treats the costs of a type I error (classifying a subsequently failing firm as
non-failed) and a type II error (classifying a subsequently non-failed firm as failed) the same.
In the credit market, the costs of misclassifying a firm that subsequently fails are very
different to the costs of misclassifying a firm that does not fail. In the first case, the lender
can lose up to 100% of the loan amount while, in the latter case, the loss is just the
opportunity cost of not lending to that firm. In assessing the practical utility of failure
prediction models, differential misclassification costs need to be explicitly taken into account.
Stein (2005) and Blöchlinger and Leippold (2006a) provide a method to link the power of
different credit risk models to distinguish between good and bad loans, loan pricing and
associated decision making. In the credit market, lenders will refuse credit to customers
perceived to be too high a risk, and will offer credit to all other customers with credit spread
increasing with perceived default risk. Assuming that lenders will only grant loans with a
positive net present value, and ignoring the strategic value of granting a loan (relationship
banking), Blöchlinger and Leippold (2006a) derive the credit risk spread as a function of the
credit score (S) by: 3
kLGD)tS|0Y(p
)tS|1Y(pR
(10)
where R is credit spread, p(Y=1|S=t) is conditional probability of failure for a score of t,
p(Y=0|S=t) is conditional probability of non-failure for a score of t, LGD is loss in loan value
given default, and k is credit spread for the highest quality loan.
We assume a simple loan market worth £100 billion with two banks competing for
business. Bank 1 uses the z-score model and Bank 2 uses a market-based model for credit
risk assessment and pricing. Both banks reject customers that fall in the bottom 5% according
to their respective models and quote a spread based on equation (13) for all the other
3 Stein (2005) provides a similar formula for loan pricing.
12
customers. Further, the customer chooses the bank which quotes the lower spread. If the
quoted spreads are equal, the customer randomly chooses one of the two banks (or
equivalently, the business is split 50:50 between the two banks). In this regime, there may be
some customers who are refused credit by both the banks, hence, the market share of the two
banks may not sum to 1. Since we have a small number of failures in our sample (103), for
each of the two models we group the scores into 20 categories. Similar to Stein (2005) and
Blöchlinger and Leippold (2006a), we also assume that LGD is exogenous and the same for
all firms, and all loans are of the same size. Finally, we work with credit spread to 3 decimal
places.
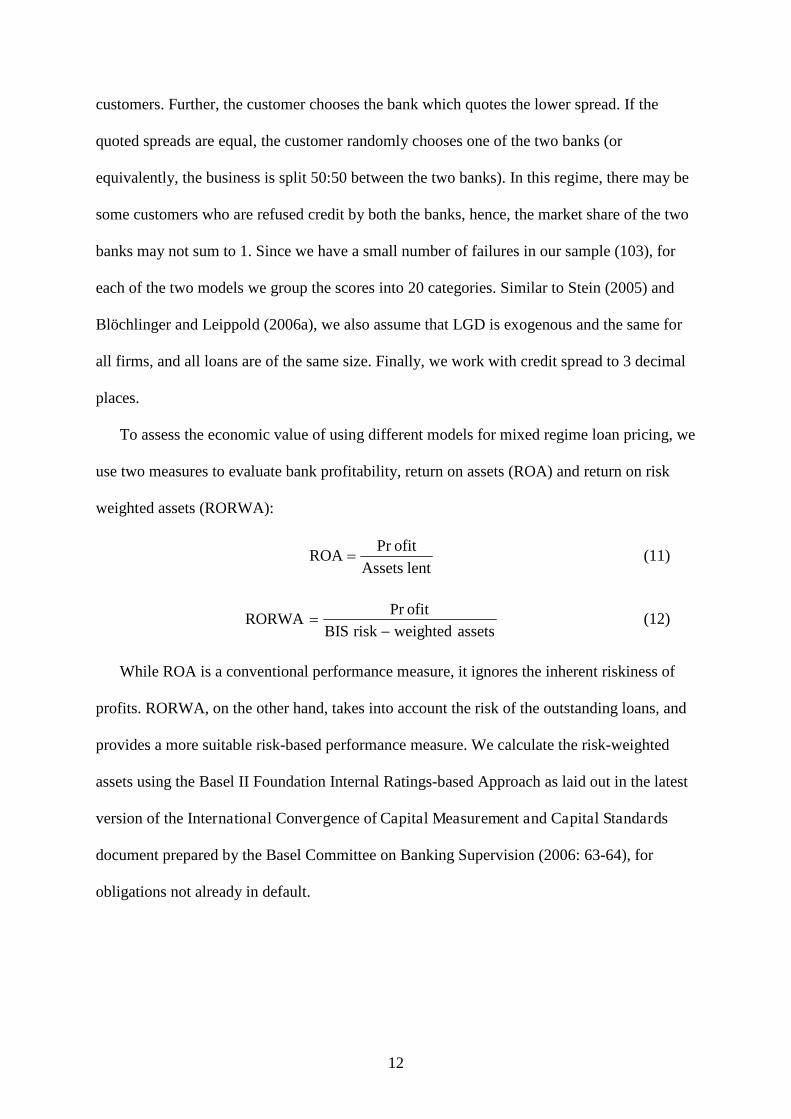
To assess the economic value of using different models for mixed regime loan pricing, we
use two measures to evaluate bank profitability, return on assets (ROA) and return on risk
weighted assets (RORWA):
lentAssets
ofitPrROA (11)
assetsweightedriskBIS
ofitPrRORWA
(12)
While ROA is a conventional performance measure, it ignores the inherent riskiness of
profits. RORWA, on the other hand, takes into account the risk of the outstanding loans, and
provides a more suitable risk-based performance measure. We calculate the risk-weighted
assets using the Basel II Foundation Internal Ratings-based Approach as laid out in the latest
version of the International Convergence of Capital Measurement and Capital Standards
document prepared by the Basel Committee on Banking Supervision (2006: 63-64), for
obligations not already in default.
13
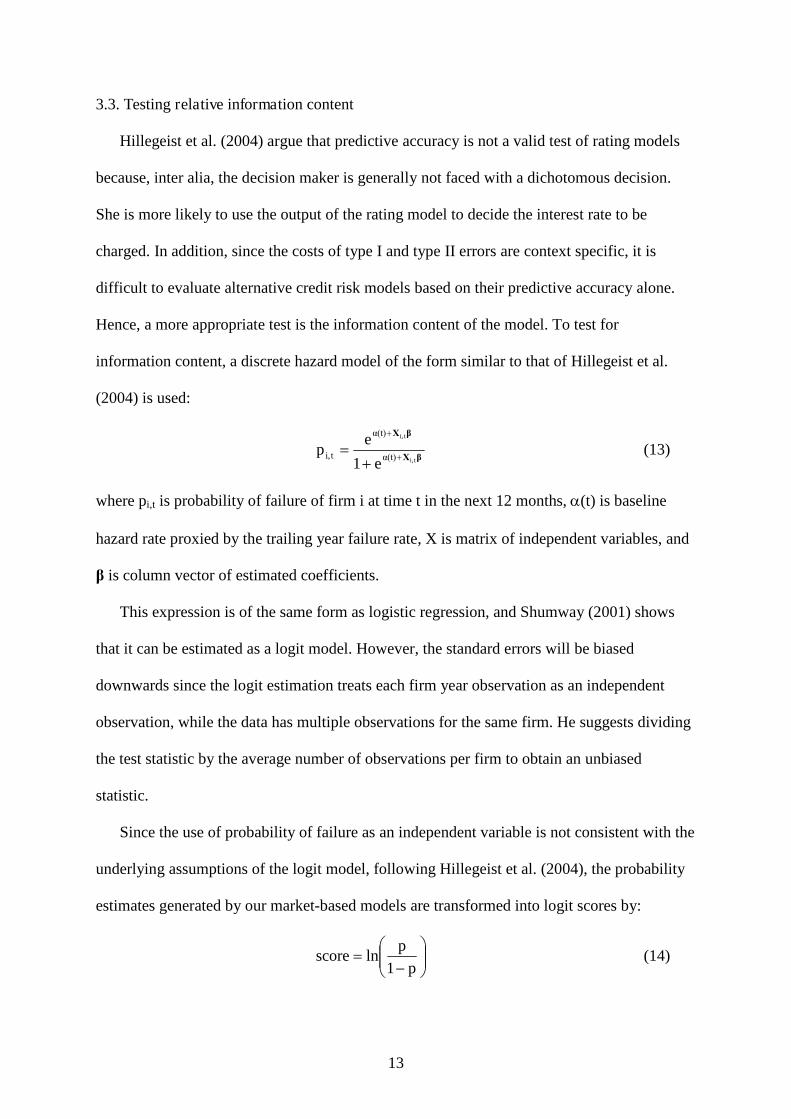
3.3. Testing relative information content
Hillegeist et al. (2004) argue that predictive accuracy is not a valid test of rating models
because, inter alia, the decision maker is generally not faced with a dichotomous decision.
She is more likely to use the output of the rating model to decide the interest rate to be
charged. In addition, since the costs of type I and type II errors are context specific, it is
difficult to evaluate alternative credit risk models based on their predictive accuracy alone.
Hence, a more appropriate test is the information content of the model. To test for
information content, a discrete hazard model of the form similar to that of Hillegeist et al.
(2004) is used:
βX
βX
ti,
ti,
α(t)
α(t)
ti,e1
ep
(13)
where pi,t is probability of failure of firm i at time t in the next 12 months, (t) is baseline
hazard rate proxied by the trailing year failure rate, X is matrix of independent variables, and
β is column vector of estimated coefficients.
This expression is of the same form as logistic regression, and Shumway (2001) shows
that it can be estimated as a logit model. However, the standard errors will be biased
downwards since the logit estimation treats each firm year observation as an independent
observation, while the data has multiple observations for the same firm. He suggests dividing
the test statistic by the average number of observations per firm to obtain an unbiased
statistic.
Since the use of probability of failure as an independent variable is not consistent with the
underlying assumptions of the logit model, following Hillegeist et al. (2004), the probability
estimates generated by our market-based models are transformed into logit scores by:
p1
plnscore (14)
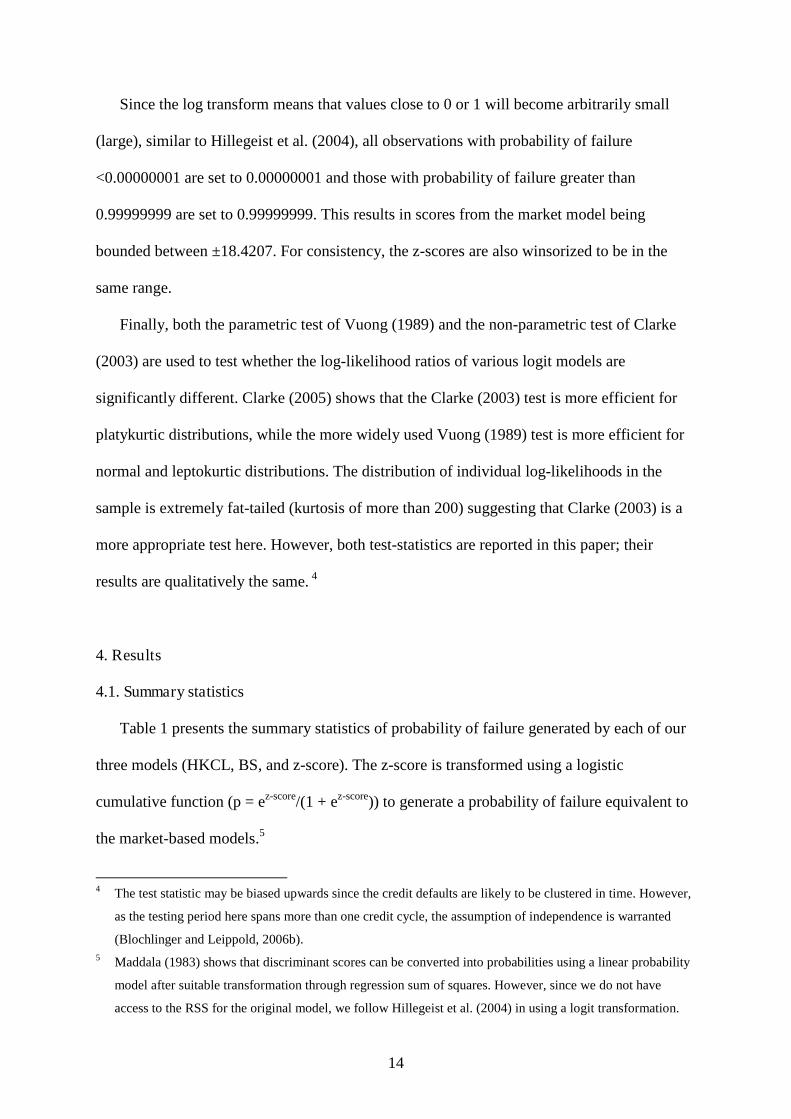
14
Since the log transform means that values close to 0 or 1 will become arbitrarily small
(large), similar to Hillegeist et al. (2004), all observations with probability of failure
<0.00000001 are set to 0.00000001 and those with probability of failure greater than
0.99999999 are set to 0.99999999. This results in scores from the market model being
bounded between ±18.4207. For consistency, the z-scores are also winsorized to be in the
same range.
Finally, both the parametric test of Vuong (1989) and the non-parametric test of Clarke
(2003) are used to test whether the log-likelihood ratios of various logit models are
significantly different. Clarke (2005) shows that the Clarke (2003) test is more efficient for
platykurtic distributions, while the more widely used Vuong (1989) test is more efficient for
normal and leptokurtic distributions. The distribution of individual log-likelihoods in the
sample is extremely fat-tailed (kurtosis of more than 200) suggesting that Clarke (2003) is a
more appropriate test here. However, both test-statistics are reported in this paper; their
results are qualitatively the same. 4
4. Results
4.1. Summary statistics
Table 1 presents the summary statistics of probability of failure generated by each of our
three models (HKCL, BS, and z-score). The z-score is transformed using a logistic
cumulative function (p = ez-score/(1 + ez-score)) to generate a probability of failure equivalent to
the market-based models.5
4 The test statistic may be biased upwards since the credit defaults are likely to be clustered in time. However,
as the testing period here spans more than one credit cycle, the assumption of independence is warranted
(Blochlinger and Leippold, 2006b).
5 Maddala (1983) shows that discriminant scores can be converted into probabilities using a linear probability
model after suitable transformation through regression sum of squares. However, since we do not have
access to the RSS for the original model, we follow Hillegeist et al. (2004) in using a logit transformation.
15
Table 1 here
Table 1 shows that the average probability of failure for firms that subsequently fail is
significantly higher than that for firms that do not fail for all the models considered. The
miscalibration of the model outputs is also obvious, while the average failure rate in our
sample is 0.67%, the two market-based models produce average probability of failure of 1.4
and 3.2 times that, while the z-score model produces an extremely high average probability of
failure. The average probabilities in Hillegeist et al. (2004) are around 5.8%, much higher
than those reported here. However, poor calibration is not relevant for tests of predictive
ability or information content as calibration provides a test of how close the model default
probabilities are to actual default probabilities, and not a test of how good a model is at
discriminating between good and bad credits (Stein, 2004). Similarly, Hillegeist et al. (2004)
argue that poor calibration does not necessarily mean that these models will not carry
information about the true probability of failure in cross-section.
The extremely high rank correlation of 0.93 between the two market-based model
estimates, HKCL and BS, shows that using simultaneous equations to estimate VA and σA, or
the choice of , do not have a material impact on probability estimates. The results here are
similar to those of Bharath and Shumway (2004) who find similar high correlations among
the various specifications they use. Further, estimates of σA obtained by simultaneously
solving a system of equations (as by Hillegeist et al., 2004), and those obtained by a simpler
approach (as by Bharath and Shumway, 2004), have a Pearson (Spearman) correlation of 0.97
(0.91)6 showing there is little value in solving simultaneous equations to obtain an estimate of
σA. Correlations between market-based models estimates and those from the z-score model
are relatively low (0.39 for HKCL and 0.52 for BS) indicating the two modelling approaches
6 Bharath and Shumaway (2004) report a rank correlation of 0.87.
16
are carrying information incremental to each other.7 All the probability estimates have low
correlation with the actual outcome indicating such measures will not have high explanatory
power in our cross-section regressions.8
4.2. Test of predictive ability
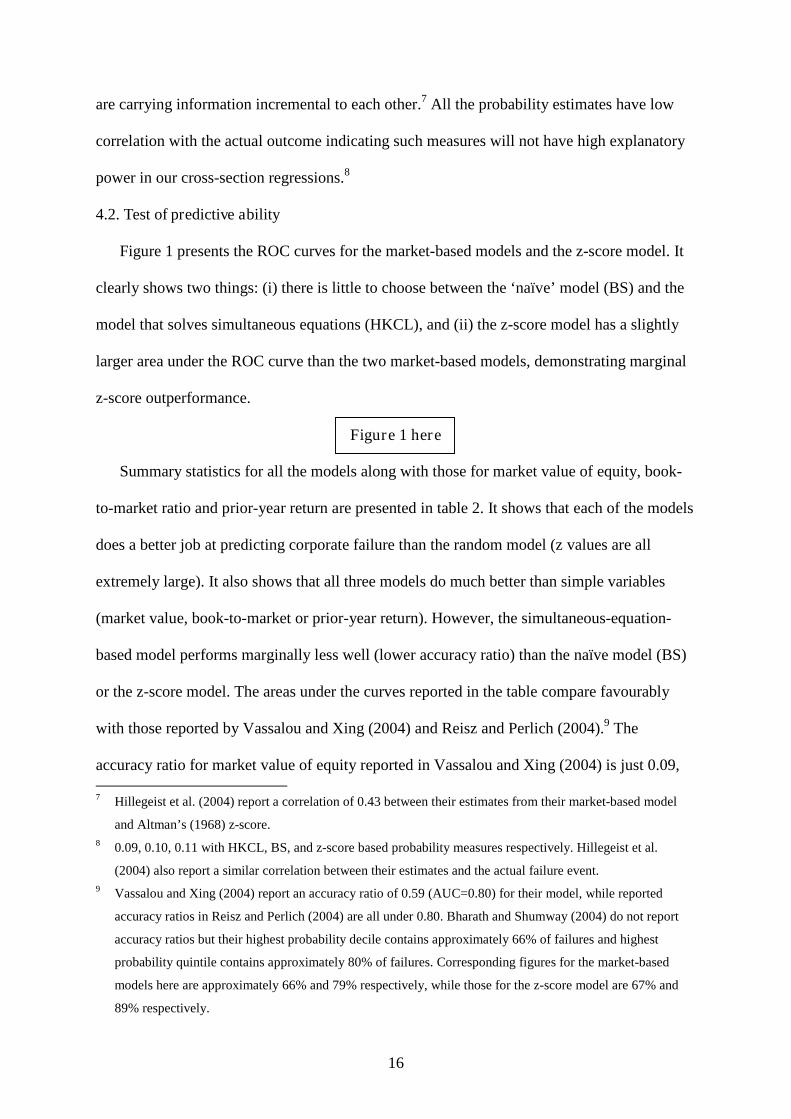
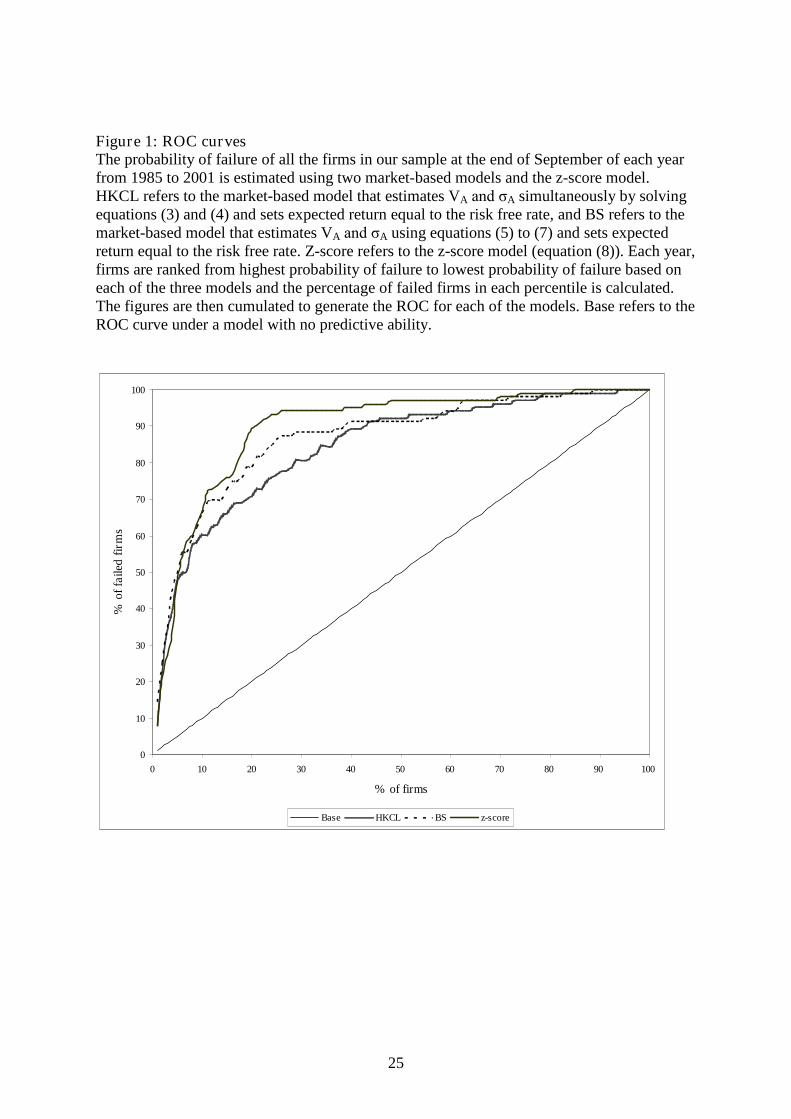
Figure 1 presents the ROC curves for the market-based models and the z-score model. It
clearly shows two things: (i) there is little to choose between the ‘naïve’ model (BS) and the
model that solves simultaneous equations (HKCL), and (ii) the z-score model has a slightly
larger area under the ROC curve than the two market-based models, demonstrating marginal
z-score outperformance.
Figure 1 here
Summary statistics for all the models along with those for market value of equity, book-
to-market ratio and prior-year return are presented in table 2. It shows that each of the models
does a better job at predicting corporate failure than the random model (z values are all
extremely large). It also shows that all three models do much better than simple variables
(market value, book-to-market or prior-year return). However, the simultaneous-equation-
based model performs marginally less well (lower accuracy ratio) than the naïve model (BS)
or the z-score model. The areas under the curves reported in the table compare favourably
with those reported by Vassalou and Xing (2004) and Reisz and Perlich (2004).9 The
accuracy ratio for market value of equity reported in Vassalou and Xing (2004) is just 0.09,
7 Hillegeist et al. (2004) report a correlation of 0.43 between their estimates from their market-based model
and Altman’s (1968) z-score.
8 0.09, 0.10, 0.11 with HKCL, BS, and z-score based probability measures respectively. Hillegeist et al.
(2004) also report a similar correlation between their estimates and the actual failure event.
9 Vassalou and Xing (2004) report an accuracy ratio of 0.59 (AUC=0.80) for their model, while reported
accuracy ratios in Reisz and Perlich (2004) are all under 0.80. Bharath and Shumway (2004) do not report
accuracy ratios but their highest probability decile contains approximately 66% of failures and highest
probability quintile contains approximately 80% of failures. Corresponding figures for the market-based
models here are approximately 66% and 79% respectively, while those for the z-score model are 67% and
89% respectively.
17
much lower than the 0.49 here. The z-score model outperforms all other models with an
accuracy ratio of 0.79.
Table 2 here
To test whether the z-score model does significantly better than our market-based models,
the area under the ROC curve for the z-score model is again compared with that for the two
market-based models. The z-score model strongly outperforms the simultaneous-equation-
based market model (z = 2.39) while there is no significant difference between the
performance of the z-score model and the naïve market-based model (z = 1.32).
4.3. Economic value when misclassification costs are different
In this sub-section we use the BS model as our market-based model because of its
superiority over other formulations. To evaluate the economic value of using different model
approaches, we use equation (10) to derive the credit spread which is a function of the
probability of both failure and non-failure, and hence both the power of the model, and its
calibration. Since our focus here is on the impact of model power differences on bank
profitability, and all our models are miscalibrated (as table 1 shows), we recalibrate our z-
score and BS models by assigning each rating category its actual default rate over the entire
17-year period. We assume that the two banks are following the Basel II Foundation Internal
Ratings-based approach, and that all loans are unsecured senior debt (i.e., the loss given
default is 45%). Further, similar to Blöchlinger and Leippold (2006a), we assume the risk
premium for a high quality customer (k) to be 0.30%.
Table 3 presents the revenue, profitability, and other statistics for the two banks (Bank 1
using the z-score model and Bank 2 using the BS model for making lending and pricing
decisions) under the competitive loan market described earlier.
18
Table 3 here
Table 3 shows that Bank 1 has a market share of 53% as compared to the market share of
45% for Bank 2. The quality of loans granted by Bank 1 is also better since it has 34% of the
defaulters while Bank 2 has 39% of the defaulters. The better credit quality of Bank 1 loans is
also reflected in the lower average spread it earns (39bp against 42bp for Bank 2). The risk-
adjusted revenue of Bank 1 is 11% higher than Bank 2 and risk-adjusted profit is 55% higher
than that for Bank 2.10 Perhaps most importantly, Bank 1 outperforms Bank 2 by 57% on the
risk-based performance measure, return on risk-weighted capital, clearly demonstrating the
superior performance of the z-score model.11 On this basis, the economic benefit of using the
z-score approach over the market-based approach is clear.
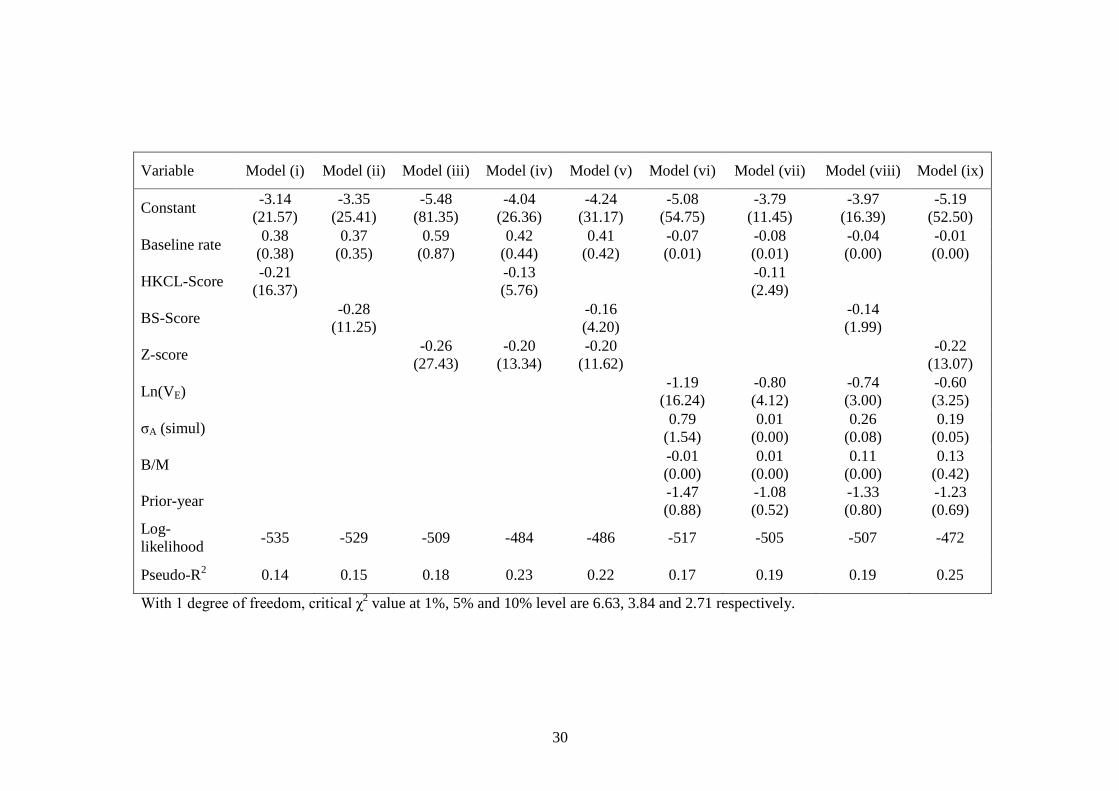
4.4. Test of information content
Table 4 presents comparative tests of information content for different formulations of a
simple hazard model, similar to that of Hillegeist et al. (2004) estimated by logistic
regression, with the test statistics adjusted for the fact that there are multiple observations for
the same firm.
Table 4 here
The coefficient on baseline hazard rate (proxied by last year’s failure rate) is, unlike in
Hillegeist et al. (2004), insignificant across all the models showing it does not carry
incremental information about corporate bankruptcy. Models (i), (ii) and (iii) in table 4,
(HKCL, BS and z-score respectively), show that the scores produced by the market-based
models and the z-score model all carry a significant amount of information about failure
10 Assuming a LGD of 30%, Bank 1 has 22% higher revenues and 57% higher profits. The corresponding
figures for LGD of 50% are 8% and 61% respectively in favor of Bank 1. The conclusions also remain
unchanged for different values of risk premium for a high quality customer (k).
11 Using the calibration technique of Burgt (2007), Bank 1earns 14% more revenue, 33% more profits, and
20% more RORWA than Bank 2.
19
within a year (the coefficients are all significantly different to 0 at the 1% level). The Clarke
test shows that the log-likelihood of model (i) is significantly lower than that of both model
(ii) (z = 7.0) and model (iii) (z = 50.2). 12 Model (ii) also does significantly better than model
(i) using the Clarke test (z = 11.3), though there is no difference using the Vuong test (z =
1.4). These results show that there is little to choose between the three credit risk models in
terms of information content, though the Clarke test does suggest that the naïve market-based
model (BS) carries marginally more information about future bankruptcy than the other two
models.
Models (iv) and (v) combine market-based and accounting-based models and carry
incremental information compared to any model separately, though the z-score coefficients
are larger than the coefficients on the market-based scores. The differences in the log-
likelihood of models (i) and (iv), (ii) and (v), (iii) and (iv), and (iii) and (v) are all highly
significant,13 showing that neither of the two approaches produce a sufficient statistic for
failure prediction: both modelling approaches carry unique information.14
Model (vi) uses only the control variables, with firm size as the only variable with
significant information about firm bankruptcy. While it produces a lower log-likelihood than
both models (i) and (ii), the Clarke test actually shows that models (i) and (ii) do better than
model (vi).15 It also shows that the models (iii) to (v) all carry more information than model
(vi) with control variables only. Models (vii) and (viii) combine market-based model scores
and control variables. Similar to the evidence of Campbell et al. (2006), they show the
12 The Vuong test statistics are 1.9 and 0.8 respectively.
13 The Clarke test statistics are 40.7, 22.4, 49.5 and 36.4 respectively. The corresponding Vuong statistics are
5.4, 4.9, 3.3 and 3.0 respectively.
14 More than one market-based model estimate is not used in the same regression due to the extremely high
correlations between the estimates from the two market-based models.
15 The test statistics are 3.3 and 27.1 respectively. Model (iii) also carries more information than model (vi) with
a test-statistic of 17.1. The corresponding Vuong statistics are 1.5, 1.3 and 0.5 respectively.

20
market-based models’ estimates lose their information content once conditioned on control
variables though the Clarke test shows that both models have significantly more explanatory
power than model (vi) (test statistics are 31.4 and 33.1 respectively).16 Model (ix) combines
z-score with control variables and shows that the z-score of a firm carries incremental
information about bankruptcy after controlling for other simpler variables in model (vi) with
Clarke test statistic of 37.3 (Vuong statistic = 4.7). However, a significantly lower log-
likelihood for model (ix), as compared to model (iii), (Clarke statistic = 53.9 and Vuong
statistic = 3.8), shows that z-score does not capture all the information about firm failure.
Table 4 provides clear evidence that neither the market-based nor z-score approach
reflects all the information embedded in the other method. This is not surprising given the
moderate correlations between the estimates of the market-based models and z-score model.
The evidence here is consistent with that of Hillegeist et al. (2004) in this respect.
Importantly, the market-based models do not seem to carry much information once simpler
market-based variables, in particular market capitalization, are incorporated.
5. Conclusions
This paper compares the performance of two alternative formulations of market-based
models for the prediction of corporate bankruptcy with a well-established UK-based z-score
model. The results show that in terms of predictive accuracy, there is little difference between
the market-based and accounting models. However, employing the analytical approach of
Stein (2005) and Blöchlinger and Leippold (2006a), which takes into account differential
misclassification costs and loan pricing considerations, a small difference in the area under
the ROC curve produces economically large differences in profitability for credit risk model
users with employment of the z-score model generating much higher risk-adjusted revenues,
profits, and return on risk-weighted assets.
16 The corresponding Vuong statistics are 2.5 and 2.2 respectively.

21
However, neither of the market-based models nor the accounting-ratio based model is a
sufficient statistic for failure prediction and both carry unique information about firm failure
(Hillegeist et al., 2004 reach the same conclusion with their data). While market-based
models are conceptually attractive, their lack of superior performance empirically should not
be surprising. Hillegeist et al. (2004) suggest two fundamental problems with
operationalizing Merton’s (1974) contingent claims approach: mis-specification due to the
restrictive assumptions of the model (e.g. single class of zero coupon debt, all liabilities
mature in one-year, costless bankruptcy, no safety covenants, default triggered only at
maturity etc.), and measurement errors (e.g. value and volatility of assets are unobservable).
Although the accounting-ratio based approach is criticized for lack of theoretical grounding,
it has three things in its favor: corporate failure is generally not a sudden event, it is rare that
firms with good profitability and strong balance sheets file for bankruptcy because of a
sudden change in the economic environment. Usually, corporate failure is the culmination of
several years of adverse performance and, hence, will be largely captured by the firm’s
accounting statements. Second, the double entry system of accounting ensures that window
dressing the accounts or change in accounting policies will have minimal effect on a measure
that combines different facets of accounting information simultaneously. Finally, loan
covenants are generally based on accounting numbers and this information is more likely to
be reflected in accounting-ratio based models.
We conclude that despite extensive criticism of traditional accounting-ratio based credit
risk assessment approaches, and the theoretically appealing contingent claims framework, in
practice such conventional approaches are robust and not dominated empirically by KMV-
type option-based models. In fact, the accounting-based approach produces significant
economic benefit over the market-based approach.
22
References
Altman, E.I., 1968. Financial ratios, discriminant analysis and the prediction of corporate
bankruptcy. Journal of Finance 23, 589-609.
Altman, E.I., 1993. Corporate financial distress and bankruptcy. New York: John Wiley, 2nd
edition.
Altman, E.I., Haldeman, R.G. and Narayanan, P., 1977. ZETA analysis: a new model to
identify bankruptcy risk of corporations. Journal of Banking and Finance 1, 29-51.
Altman E.I., Narayanan, P., 1997. An international survey of business failure classification
models. Financial Markets and Institutions 6(2), 1-57.
Basel Committee on Banking Supervision, 2006. International convergence of capital
measurement and capital standards: a revised framework, June.
Beaver, W.H., 1968. Market prices, financial ratios, and the prediction of failure. Journal of
Accounting Research 6, 179-192.
Begley, J., Ming, J., Watts, S., 1996. Bankruptcy classification errors in the 1980s: an
empirical analysis of Altman’s and Ohlson’s models. Review of Accounting Studies 1(4),
267-284.
Bharath, S., Shumway, T., 2004. Forecasting default with the KMV-Merton model. Working
paper, University of Michigan.
Black, F., Scholes, M., 1973. The pricing of options and corporate liabilities. Journal of
Political economy 7, 637-654.
Blöchlinger, A., Leippold, M., 2006a. Economic benefit of powerful credit scoring. Journal
of Banking and Finance 30, 851-873.
Blöchlinger, A., Leippold, M., 2006b. Testing probability calibrations for credit scoring
models. Credit Suisse Working Paper.
Burgt, M., 2007. Calibrating low-default portfolios using the cumulative accuracy profile.
ABN AMRO Group Risk Management Tools and Modelling.
Campbell, J. Y., Hilscher, J., Szilagyi, J., 2006. In search of distress risk. Working paper,
Harvard University.
Caouette, J.B., Altman, E.I., Narayanan, P., 1998. Managing credit risk: the next great
financial challenge. New York: John Wiley and Sons.
Clarke, K.A., 2003. Nonparametric model discrimination in international relations. Journal of
Conflict Resolution 47(1), 72-93.
23
Clarke, K.A., 2005. A simple distribution-free test for non-nested model selection. Working
paper, University of Rochester.
Engelmann, B., Hayden, E., Tasche, D., 2003. Testing rating accuracy. Risk 16, 82-86.
Faraggi, D., Reiser, R., 2002. Estimation of the area under the ROC curve. Statistics in
Medicine 21, 3093-3106.
Hanley, J., McNeil, B., 1982. The meaning and use of the area under a receiver operating
characteristic (ROC) curve. Radiology 143 (1), 29-36.
Hanley, J., McNeil, B., 1983. A method of comparing the areas under receiver operating
characteristic curves derived from the same cases. Radiology 148 (3), 839-843.
Hillegeist, S., Keating, E., Cram, D., Lundstedt, K., 2004. Assessing the probability of
bankruptcy. Review of Accounting Studies 9, 5-34.
Journal of Banking and Finance (2001). Special issue on credit ratings and the proposed new
BIS guidelines on capital adequacy for bank credit assets. 25(1).
Kealhofer, S., 2003. Quantifying credit risk I: default prediction. Financial Analysts Journal
Jan/Feb, 30-44.
Maddala, G., 1983. Limited-dependent and qualitative variables in econometrics.
Econometric Society Monographs, Cambridge University Press.
McDonald, R., 2002. Derivative Markets. Boston, MA: Addison Wesley.
Mensah, Y.M., 1984. An examination of the stationarity of multivariate bankruptcy
prediction models: a methodological study. Journal of Accounting Research 22(1), 380-
395.
Merton, R.C., 1974. On the pricing of corporate debt: the risk structure of interest rates.
Journal of Finance 29, 449-470.
Oderda, G., Dacorogna, M., Jung, T., 2003. Credit risk models: do they deliver their
promises? a quantitative assessment. Review of Banking, Finance and Monetary
Economics 32, 177-195.
Ohlson, J.A., 1980. Financial ratios and the probabilistic prediction of bankruptcy. Journal of
Accounting Research 18, 109-131.
Reisz, A., Perlich, C., 2004. A market based framework for bankruptcy prediction. Working
paper, Baruch College, City University of New York.
Saunders, A., Allen, L., 2002. Credit risk measurement: new approaches to Value at Risk and
other paradigms. New York:Wiley Finance, 2nd edition.
Shumway, T., 2001. Forecasting bankruptcy more accurately: a simple hazard model. Journal
of Business 74, 101-124.
24
Sobehart, J., Keenan, S., 2001. Measuring default accurately. Risk (March), 31–33.
Sobehart J., Keenan, S., Stein, R., 2000. Benchmarking quantitative default risk models: a
validation methodology. Moody’s Rating Methodology.
Stein, R. 2004. Benchmarking default prediction models: pitfalls and remedies in model
validation. Moody’s KMV Technical Report No. 030124.
Stein, R. 2005. The relationship between default prediction and lending profits: integrating
ROC analysis and loan pricing. Journal of Banking and Finance 29, 1213-1236.
Taffler, R.J., 1984. Empirical models for the monitoring of UK corporations. Journal of
Banking and Finance 8, 199-227.
Vassalou, M., Xing, Y., 2004. Default risk in equity returns. Journal of Finance 59 (2), 831-
868.
Vuong, Q., 1989. Likelihood ratio tests for model selection and non-nested hypotheses.
Econometrica 57, 307-333.
25
Figure 1: ROC curvesThe probability of failure of all the firms in our sample at the end of September of each yearfrom 1985 to 2001 is estimated using two market-based models and the z-score model.HKCL refers to the market-based model that estimates VA and σA simultaneously by solvingequations (3) and (4) and sets expected return equal to the risk free rate, and BS refers to themarket-based model that estimates VA and σA using equations (5) to (7) and sets expectedreturn equal to the risk free rate. Z-score refers to the z-score model (equation (8)). Each year,firms are ranked from highest probability of failure to lowest probability of failure based oneach of the three models and the percentage of failed firms in each percentile is calculated.The figures are then cumulated to generate the ROC for each of the models. Base refers to theROC curve under a model with no predictive ability.
0
10
20
30
40
50
60
70
80
90
100
0 10 20 30 40 50 60 70 80 90 100
% of firms
%o
ffa
iled
firm
s
Base HKCL BS z-score

26
Table 1: Summary statisticsThe probability of failure of all the firms in our sample at the end of September of each yearfrom 1985 to 2001 is estimated using market-based models or the z-score model. HKCLrefers to the market-based model that estimates VA and σA simultaneously by solvingequations (3) and (4), and estimates expected return using equation (8) bounded between therisk free rate and 100%, and BS refers to the market-based model that estimates VA and σA
using equations (5) to (7), and sets expected return equal to the risk-free rate. Z-score refersto the z-score model (equation (8)). Figures in column 2 are the mean probability of failureestimates generated by the six models for all the firms in the sample at the end of Septemberof each year, column 3 provides the mean probability of failure for firms that fail in the next12 months, and column 4 has the mean probability estimates for firms that do not fail within12 months of the estimation date. Column 5 has the test statistic for difference between themean probability of failure for firms that fail and firms that do not fail. The probability offailure for the z-score model is calculated as exp(z-score)/(1+exp(z-score)).
ModelMean probability of failure (%) t-statistic for
differenceAll Failed Non-FailedHKCL 0.96 8.29 0.91 5.55
BS 2.12 15.88 2.03 9.85z-score 26.33 88.10 25.91 27.76
27
Table 2: Area under the ROC curve and accuracy ratiosThe probability of failure of all the firms in our sample at the end of September of each yearfrom 1985 to 2001 is estimated using two market-based models and a z-score model. HKCLrefers to the market-based model that estimates VA and σA simultaneously by solvingequations (3) and (4), and estimates expected return using equation (8) bounded between therisk-free rate and 100%, and BS refers to the market-based model that estimates VA and σA
using equations (5) to (7), and sets expected return equal to the risk-free rate and Z-scorerefers to the z-score model (equation (8)). The probability of failure for the z-score model iscalculated as exp(z-score)/(1+exp(z-score)). Size refers to the market value of equity, B/Mrefers to the ratio of book value of equity and market value of equity and Prior-Year refers tothe buy-and-hold return over the previous 12 months for all the firms in the sample at the endof September of each year. Figures in column 2 are the area under the ROC curve (AUC)estimated as the Wilcoxon statistic. Column 3 has the standard error of the estimated area andcolumn 4 has the test statistic for the null hypothesis that the area under the ROC curve isequal to 0.5. Column 5 has the accuracy ratio (AR= 2*(AUC – 0.5)).
AUC SE z ARHKCL 0.84 0.0187 18.18 0.68BS 0.87 0.0171 21.64 0.73z-score 0.89 0.0184 21.20 0.79Size 0.75 0.0233 10.73 0.49B/M 0.68 0.0203 8.87 0.36Prior-Year 0.71 0.0204 10.29 0.42

28
Table 3: Comparative economic value of different credit modelsThe probability of failure of all the firms in our sample at the end of September of each yearfrom 1985 to 2001 is estimated using the BS model and z-score model. BS refers to themarket-based model that estimates VA and σA using equations (5) to (7), and sets expectedreturn equal to the risk-free rate. Bank 1 uses the z-score model and Bank 2 uses the BSmodel. Both banks reject all firms with score in the bottom 5% based on their respectivemodels while offering credit to all others at a credit spread derived using equation (10). Firmsare assumed to split their loan equally between the two banks if both offer the same creditspread, otherwise they choose the bank offering the lower spread. Market share is the totalnumber of loans granted as a percentage of total number of firm years, share of defaulters isthe number of defaulters to whom a loan is granted as a percentage of total number ofdefaulters. Revenue is market size * market share * average credit spread, and Loss is marketsize * prior probability of failure * share of defaulters * loss given default. Profit is Revenue– Loss. Return on assets is profit divided by market size * market share, and return on risk-weighted assets is the profit divided by risk-weighted assets computed using the Basel IIFoundation Internal Ratings-based Approach. For illustrative purposes, we assume the marketsize to be £100 billion, equal size loans, loss given default to be 45%, and credit spread forthe highest quality customers to be 0.30%. The prior probability of failure is taken to be thesame as the ex-post failure rate of 0.67% during the sample period.
Bank 1(z-score model)
Bank 2(BS model)
Market share (%) 53.1 45.2
Share of defaulters (%) 33.5 39.3
Average credit spread (%) 0.39 0.42
Revenue (£m) 209.2 188.2
Loss (£m) 100.9 118.5
Profit (£m) 108.3 69.8
Return on Assets (%) 0.20 0.15
Return on Risk-weighted Assets (%) 0.69 0.44
29
Table 4: Information content testsThe probability of failure of all the firms in our sample at the end of September of eachyear from 1985 to 2001 is estimated using two market-based models and the z-scoremodel. HKCL refers to the market-based model that estimates VA and σA simultaneouslyby solving equations (3) and (4), and estimates expected return using equation (8)bounded between the risk-free rate and 100%, and BS refers to the market-based modelthat estimates VA and σA using equations (5) to (7), and sets expected return equal to therisk-free rate. The probability estimates from HKCL and BS are converted to scores byScore = (p/(1-p)), with p winsorized to be between 0.00000001 and 0.99999999. Z-scorerefers to the estimates from the z-score model (equation (8)) winsorized to be in thecorresponding range (± 18.4207). The baseline rate is the failure rate over the previousyear (in percent), ln(VE) is the natural logarithm of the market value of equity, σA is theasset volatility estimated from simultaneously solving equations (3) and (4), B/M is thebook-to-market ratio, and Prior-year is the buy-and-hold return over the previous 12months, all estimated at the end of September of year t. Figures in brackets are the Waldstatistic from the logistic regression with dependent variable taking a value of 1 if thefirm fails in 12 months, 0 otherwise. The Wald statistic is adjusted for the fact that thereare several observations from the same firm by dividing by 7.67, the average number ofobservations per firm.
30
Variable Model (i) Model (ii) Model (iii) Model (iv) Model (v) Model (vi) Model (vii) Model (viii) Model (ix)
Constant-3.14
(21.57)-3.35
(25.41)-5.48
(81.35)-4.04
(26.36)-4.24
(31.17)-5.08
(54.75)-3.79
(11.45)-3.97
(16.39)-5.19
(52.50)
Baseline rate0.38
(0.38)0.37
(0.35)0.59
(0.87)0.42
(0.44)0.41
(0.42)-0.07(0.01)
-0.08(0.01)
-0.04(0.00)
-0.01(0.00)
HKCL-Score-0.21
(16.37)-0.13(5.76)
-0.11(2.49)
BS-Score-0.28
(11.25)-0.16(4.20)
-0.14(1.99)
Z-score-0.26
(27.43)-0.20
(13.34)-0.20
(11.62)-0.22
(13.07)
Ln(VE)-1.19
(16.24)-0.80(4.12)
-0.74(3.00)
-0.60(3.25)
σA (simul)0.79
(1.54)0.01
(0.00)0.26
(0.08)0.19
(0.05)
B/M-0.01(0.00)
0.01(0.00)
0.11(0.00)
0.13(0.42)
Prior-year-1.47(0.88)
-1.08(0.52)
-1.33(0.80)
-1.23(0.69)
Log-likelihood
-535 -529 -509 -484 -486 -517 -505 -507 -472
Pseudo-R2 0.14 0.15 0.18 0.23 0.22 0.17 0.19 0.19 0.25
With 1 degree of freedom, critical χ2 value at 1%, 5% and 10% level are 6.63, 3.84 and 2.71 respectively.