Embed Size (px)
Citation preview
1
Common Cents
About Common Cents
• Funded by the Bush Foundation• Share information and perspectives about
Minnesota’s fiscal situation• 50+ workshops around the state
• State budget balancing• Tax reform
2
Common Cents
About the Citizens League
• Nonpartisan nonprofit for 60 years• Vision is to create the common ground where
“we the People” can achieve the common good• Principle: People who are affected by a
problem should have the opportunity to define it and weigh in on how it’s solved
3
Common CentsWhy We Are Here
1) Better understand the trends and challenges facing Minnesota’s budget
2) Share your vision and values
3) Provide input on your priorities
4) Inform the Bush Foundation’s work
4
Common Cents
Why We Are Here
5) Model meaningful civic discussion on important issues
--expect disagreement
--mixed views at tables
--feel free to respectfully disagree
5
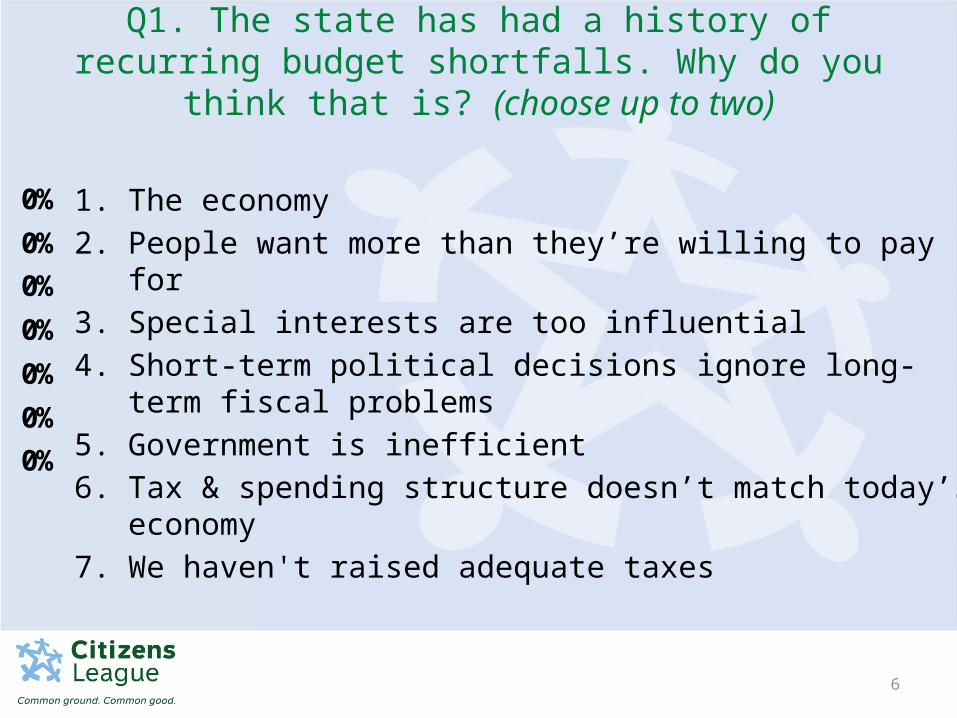
Q1. The state has had a history of recurring budget shortfalls. Why do you think that is? (choose up to two)
6
0%0%0%0%0%0%0% 1. The economy
2. People want more than they’re willing to pay for
3. Special interests are too influential
4. Short-term political decisions ignore long-term fiscal problems
5. Government is inefficient
6. Tax & spending structure doesn’t match today’s economy
7. We haven't raised adequate taxes
Common Cents
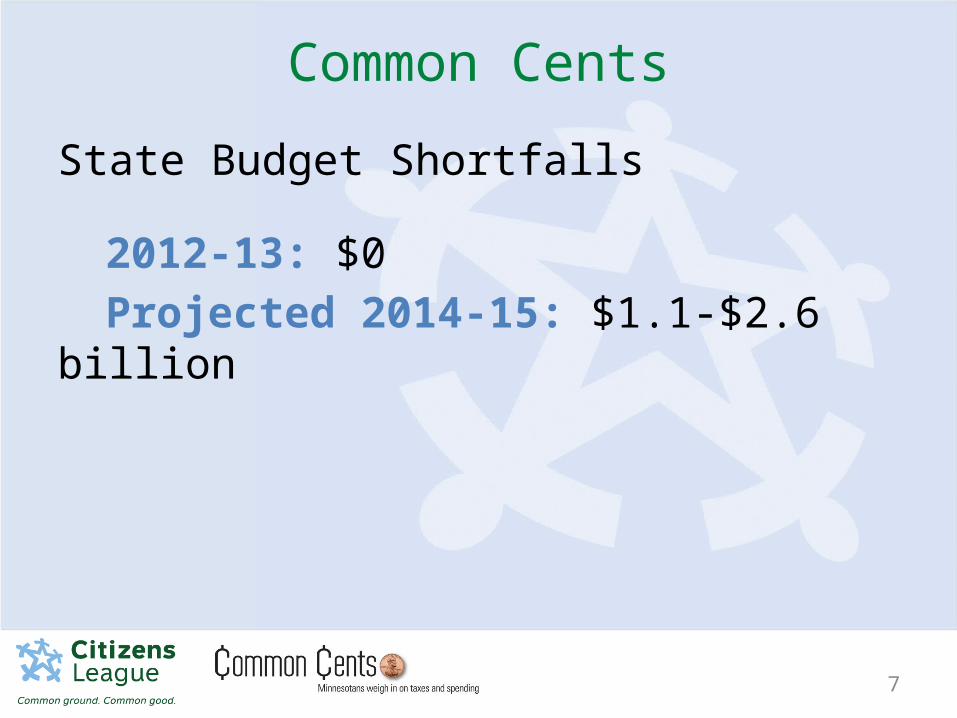
State Budget Shortfalls
2012-13: $0
Projected 2014-15: $1.1-$2.6 billion
7
8
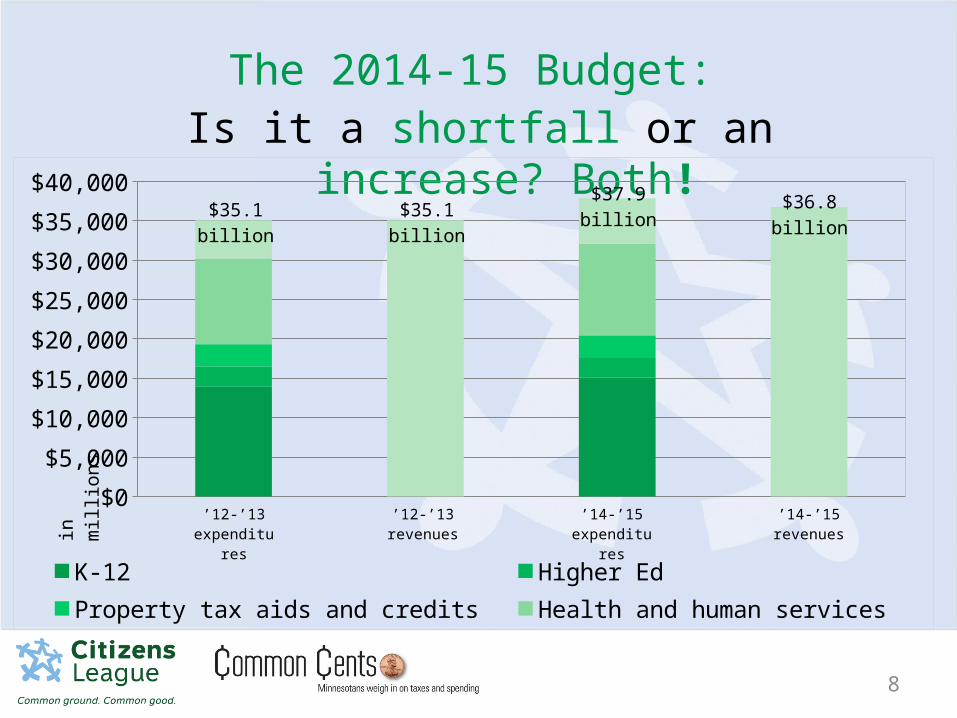
The 2014-15 Budget:Is it a shortfall or an increase? Both!
$0
$5,000
$10,000
$15,000
$20,000
$25,000
$30,000
$35,000
$40,000
K-12 Higher Ed Property tax aids and credits Health and human services All other
in m
illio
ns
’12-’13 ex-penditures
’12-’13 rev-enues
’14-’15 rev-enues
’14-’15 ex-penditures
$35.1 billion $35.1 billion$37.9 billion $36.8 billion
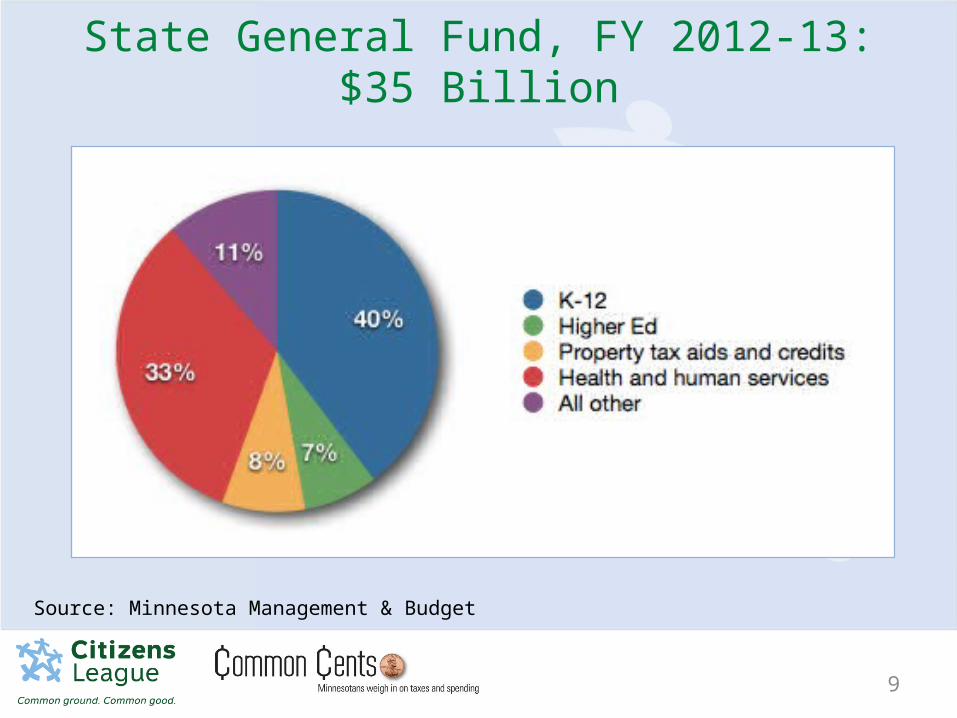
State General Fund, FY 2012-13: $35 Billion
9
Source: Minnesota Management & Budget
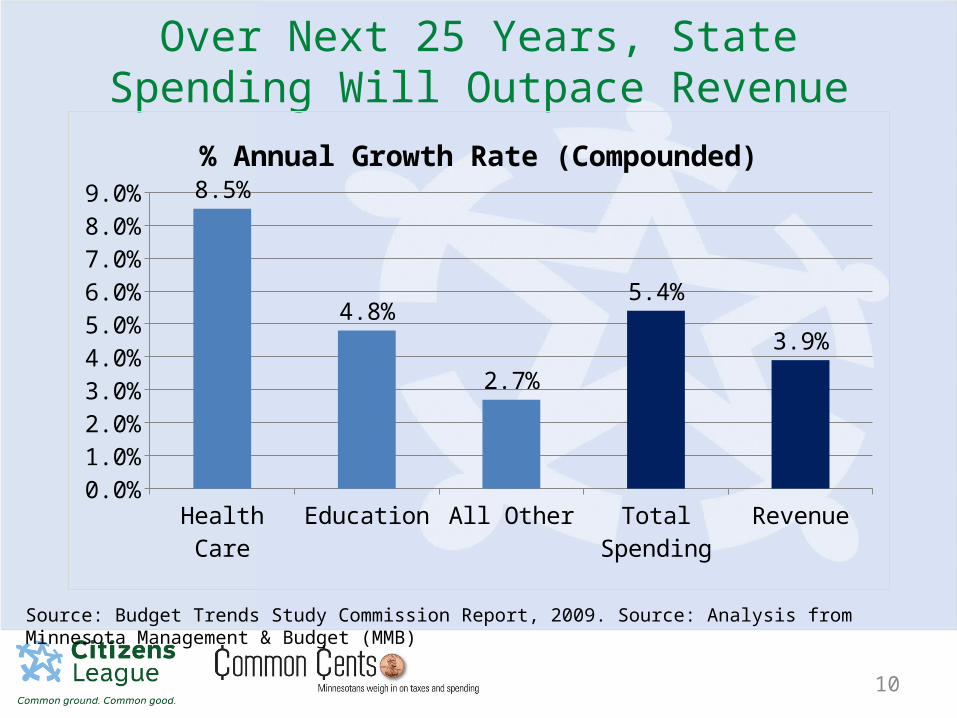
Over Next 25 Years, State Spending Will Outpace Revenue
10
Health Care Education All Other Total Spending Revenue0.0%
1.0%
2.0%
3.0%
4.0%
5.0%
6.0%
7.0%
8.0%
9.0% 8.5%
4.8%
2.7%
5.4%
3.9%
% Annual Growth Rate (Compounded)
Source: Budget Trends Study Commission Report, 2009. Source: Analysis from Minnesota Management & Budget (MMB)
11
Why Is This Happening?
1. Minnesota is aging2. Labor force growth is slowing

Population 65+ is Increasing Dramatically
12
Source: Bush Foundation. MNCompass from U.S. Census Bureau and State Demographic Center Projections.
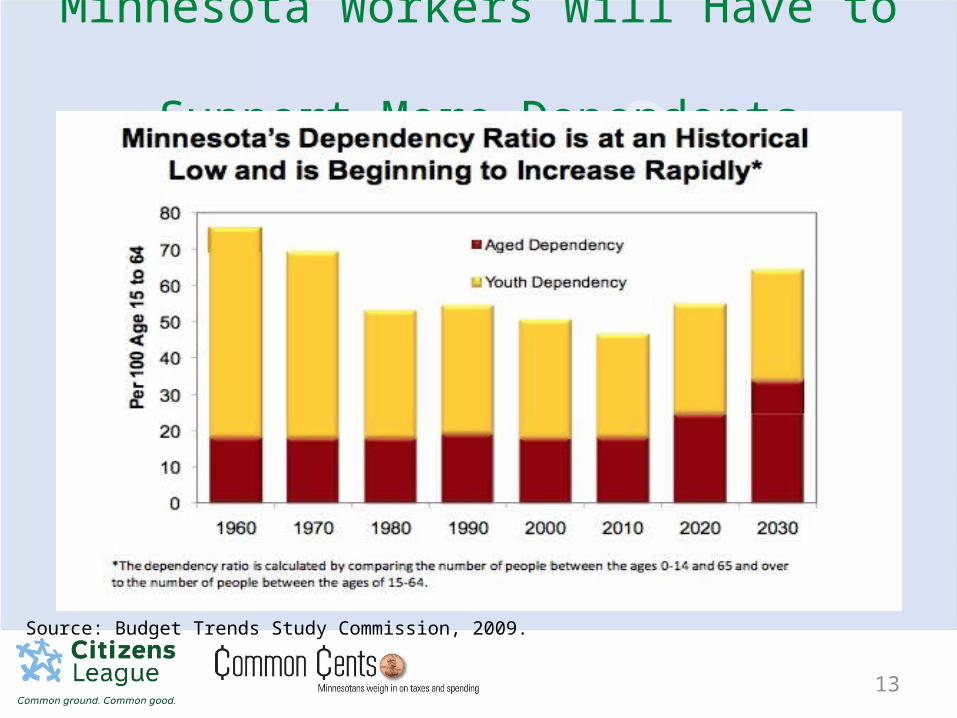
Minnesota Workers Will Have to Support More Dependents
13
Source: Budget Trends Study Commission, 2009.
14
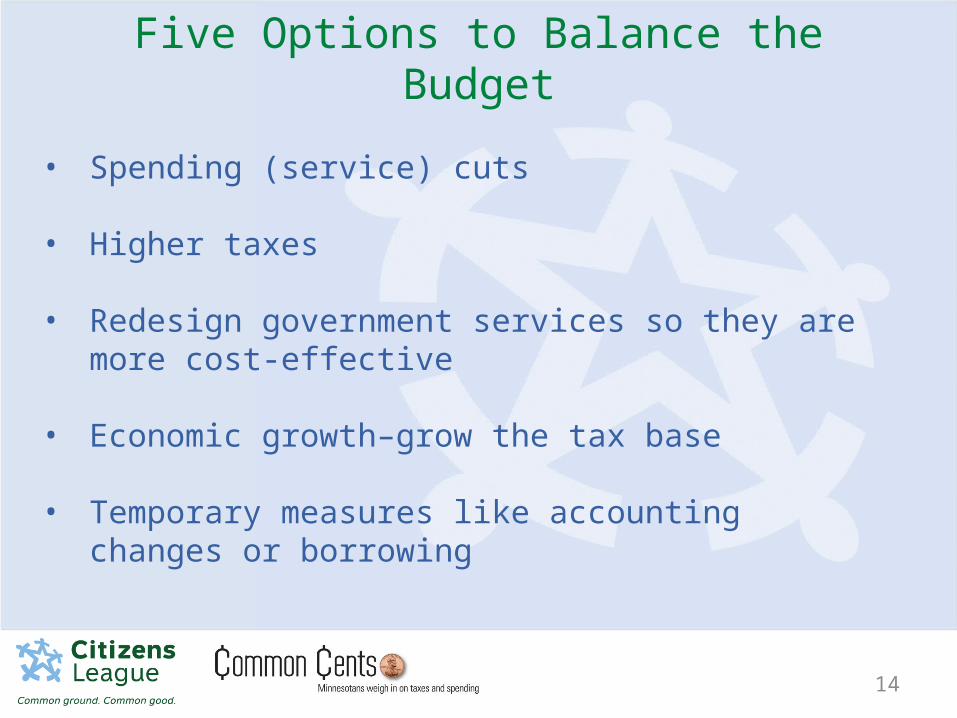
• Spending (service) cuts
• Higher taxes
• Redesign government services so they are more cost-effective
• Economic growth–grow the tax base
• Temporary measures like accounting changes or borrowing
Five Options to Balance the Budget
Spending
15
Common Cents
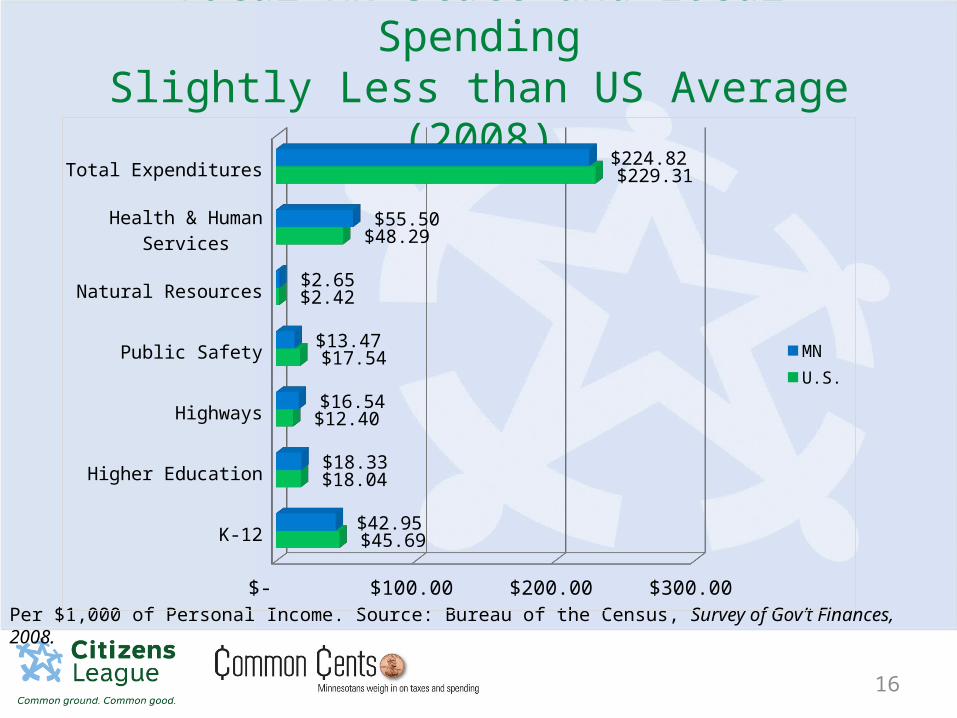
Total MN State and Local SpendingSlightly Less than US Average (2008)
16
Per $1,000 of Personal Income. Source: Bureau of the Census, Survey of Gov’t Finances, 2008.
K-12
Higher Education
Highways
Public Safety
Natural Resources
Health & Human Services
Total Expenditures
$- $50.00 $100.00 $150.00 $200.00 $250.00
$45.69
$18.04
$12.40
$17.54
$2.42
$48.29
$229.31
$42.95
$18.33
$16.54
$13.47
$2.65
$55.50
$224.82
MNU.S.
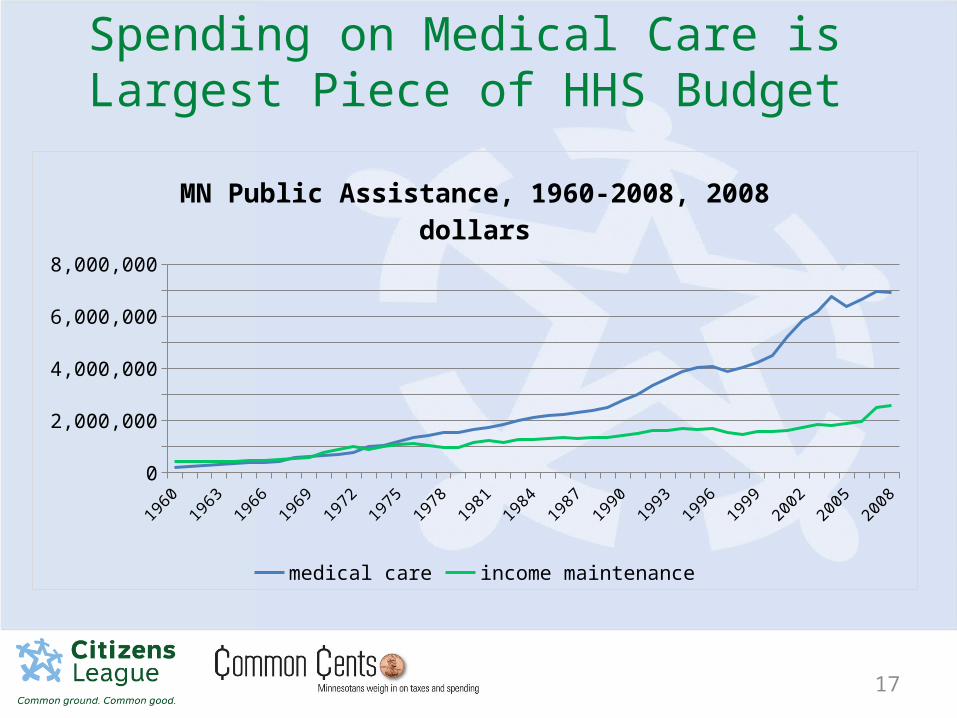
Spending on Medical Care is Largest Piece of HHS Budget
17
19601962
19641966
19681970
19721974
19761978
19801982
19841986
19881990
19921994
19961998
20002002
20042006
20080
1,000,000
2,000,000
3,000,000
4,000,000
5,000,000
6,000,000
7,000,000
8,000,000
MN Public Assistance, 1960-2008, 2008 dollars
medical care income maintenance
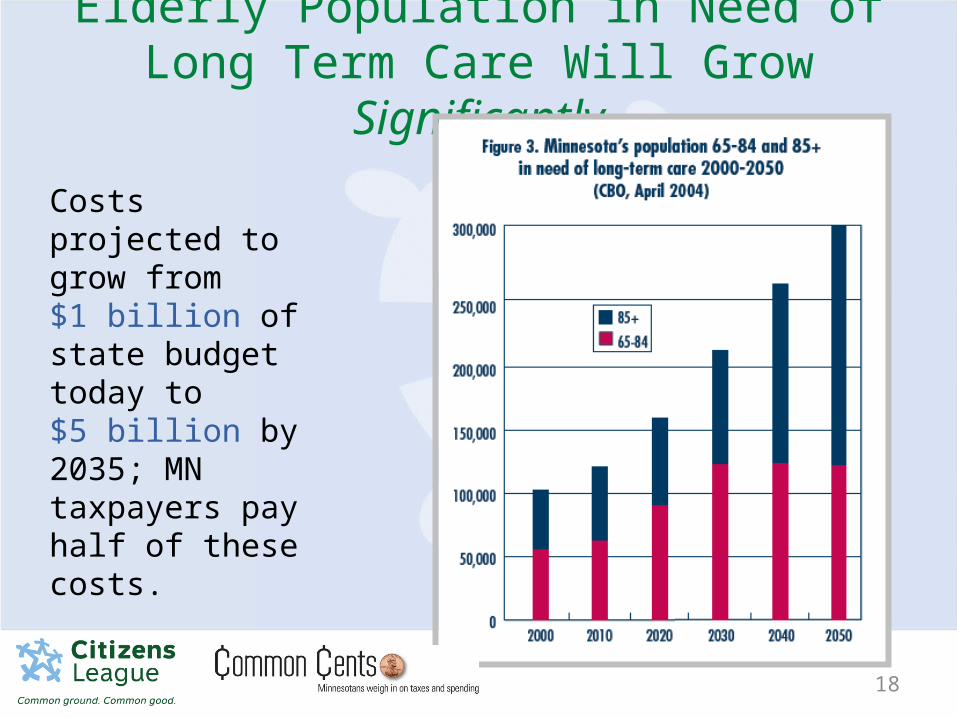
Elderly Population in Need of Long Term Care Will Grow Significantly
18
Costs projected to grow from $1 billion of state budget today to$5 billion by 2035; MN taxpayers pay half of these costs.
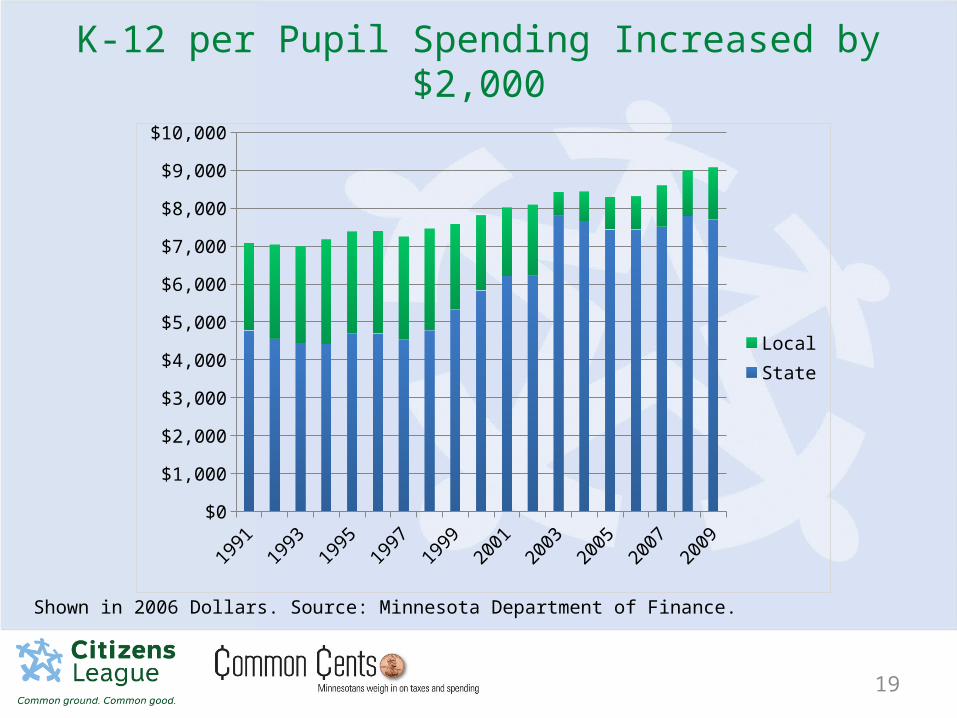
K-12 per Pupil Spending Increased by $2,000
19
19911993
19951997
19992001
20032005
20072009
$0
$1,000
$2,000
$3,000
$4,000
$5,000
$6,000
$7,000
$8,000
$9,000
$10,000
LocalState
Shown in 2006 Dollars. Source: Minnesota Department of Finance.
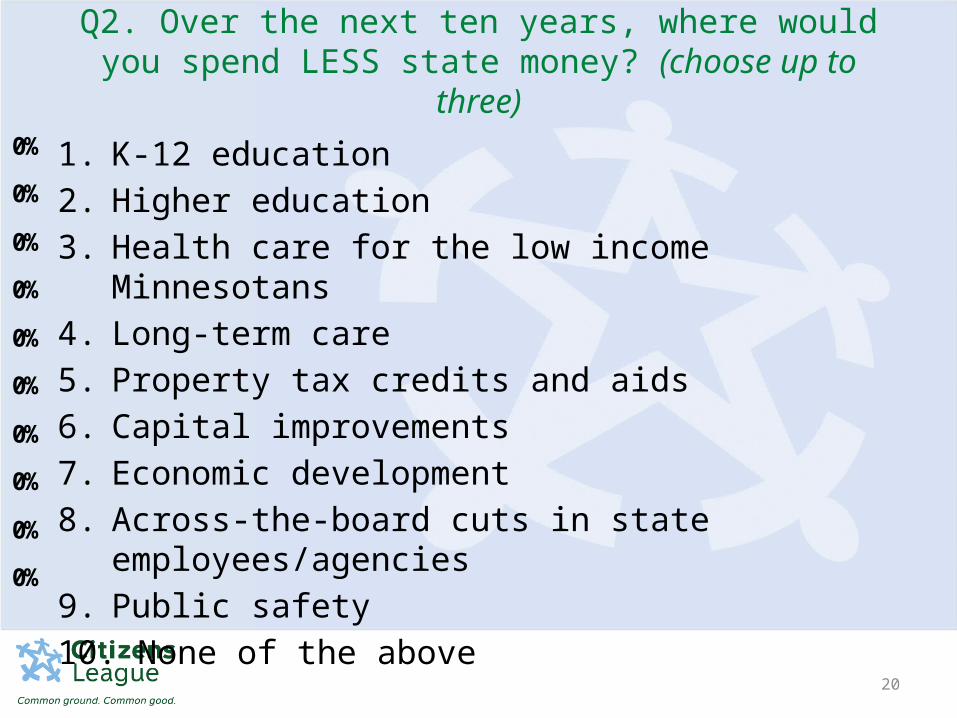
Q2. Over the next ten years, where would you spend LESS state money? (choose up to three)
20
0%
0%
0%
0%
0%
0%
0%
0%
0%
0%1. K-12 education
2. Higher education
3. Health care for the low income Minnesotans
4. Long-term care
5. Property tax credits and aids
6. Capital improvements
7. Economic development
8. Across-the-board cuts in state employees/agencies
9. Public safety
10. None of the above
Common Cents
Taxes and Revenues
21
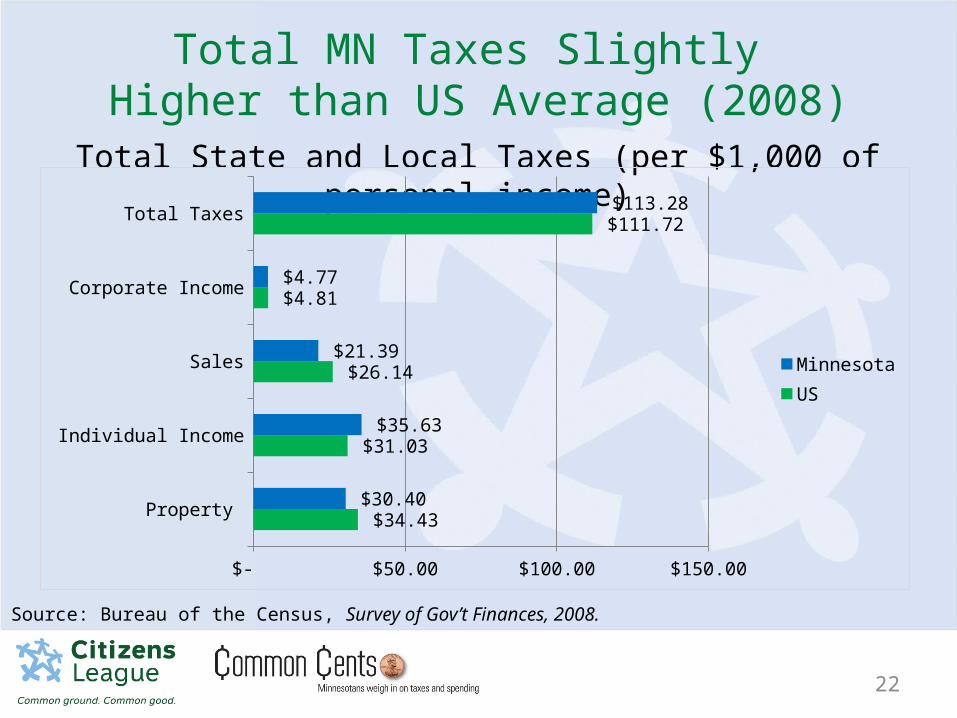
Total MN Taxes Slightly Higher than US Average (2008)
22
Total State and Local Taxes (per $1,000 of personal income)
Property
Individual Income
Sales
Corporate Income
Total Taxes
$- $20.00 $40.00 $60.00 $80.00 $100.00 $120.00
$34.43
$31.03
$26.14
$4.81
$111.72
$30.40
$35.63
$21.39
$4.77
$113.28
MinnesotaUS
Source: Bureau of the Census, Survey of Gov’t Finances, 2008.
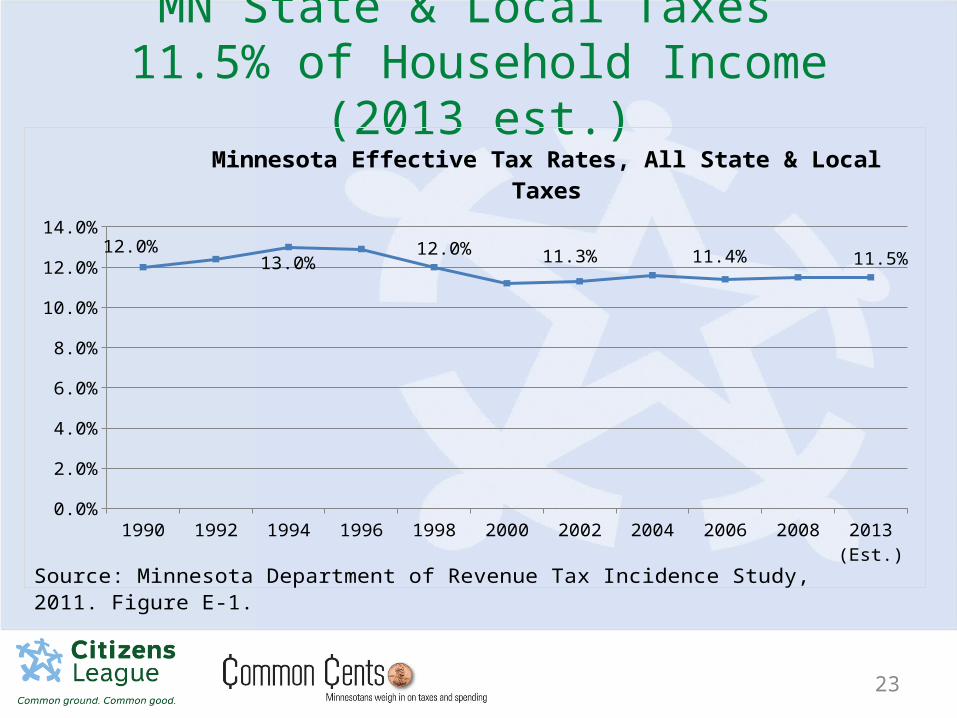
MN State & Local Taxes 11.5% of Household Income (2013 est.)
23
1990 1992 1994 1996 1998 2000 2002 2004 2006 2008 2013 (Est.)
0.0%
2.0%
4.0%
6.0%
8.0%
10.0%
12.0%
14.0%
12.0%13.0% 12.0% 11.3% 11.4% 11.5%
Minnesota Effective Tax Rates, All State & Local Taxes
Source: Minnesota Department of Revenue Tax Incidence Study, 2011. Figure E-1.
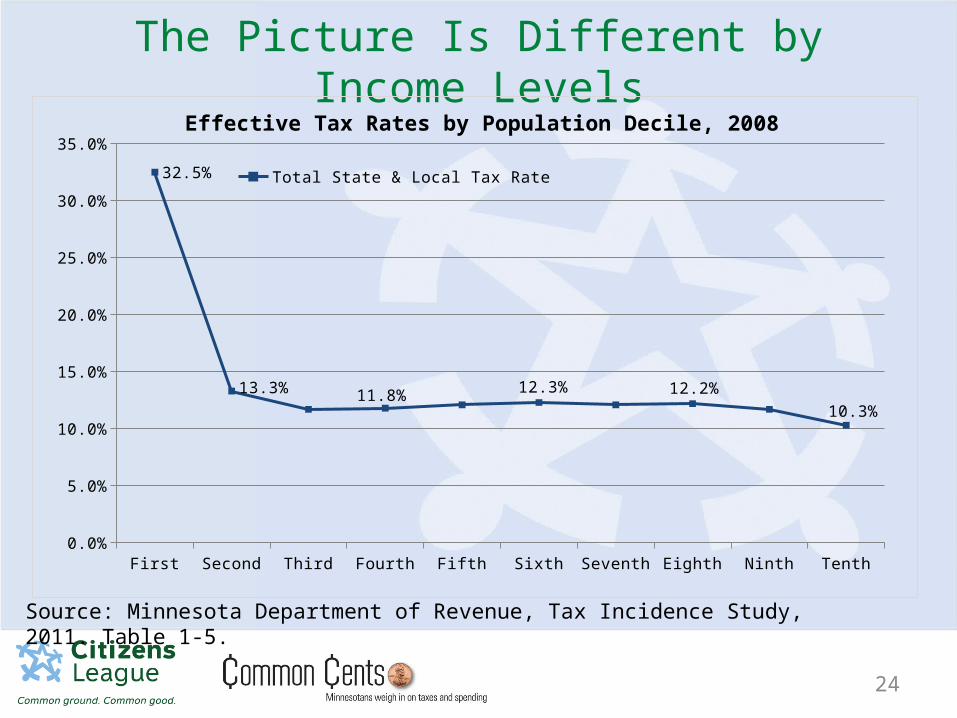
The Picture Is Different by Income Levels
24
Source: Minnesota Department of Revenue, Tax Incidence Study, 2011. Table 1-5.
First Second Third Fourth Fifth Sixth Seventh Eighth Ninth Tenth0.0%
5.0%
10.0%
15.0%
20.0%
25.0%
30.0%
35.0%
32.5%
13.3% 11.8% 12.3% 12.2%10.3%
Total State & Local Tax Rate
Effective Tax Rates by Population Decile, 2008
Q3. Under what circumstances, if any, would you personally be willing to pay higher taxes?
(choose up to two)
25
0%
0%
0%
0%
0%
0%
0% 1. If it’s clear we get more for our money
2. If the overall tax structure is fair
3. For certain services only
4. For certain types of taxes only
5. I’m willing to pay more given the budget situation
6. I am not willing; I am taxed enough
7. Other
Common Cents
Redesign
26
Reform Often Involves Tough Choices
1. Loss of jobs
2. Consolidations that closing places people identify with (e.g., nursing homes, schools) or replace their elected officials (e.g., local to regional park districts)
3. Risk of misuse of funds (e.g., military cash cards)
4. Perceived or real diminution of services
5. Possibility of failure
27
Q4. Let’s say a reform proposal saves money and/or improves services in the aggregate. In principle, which, if any, of these possible negative consequences would concern you the most? (choose up to two)
28
0%
0%
0%
0%
0%
0%
0%
0%
0%1. Loss of jobs
2. Reduced services or benefits for some
3. Reduced pay and/or benefits for employees
4. Less convenience
5. Less local representation
6. Misuse of funds
7. Failure
8. Other
9. None – we need to be willing to accept such consequences.
Common Cents
Group Exercises
29
Common Cents
30
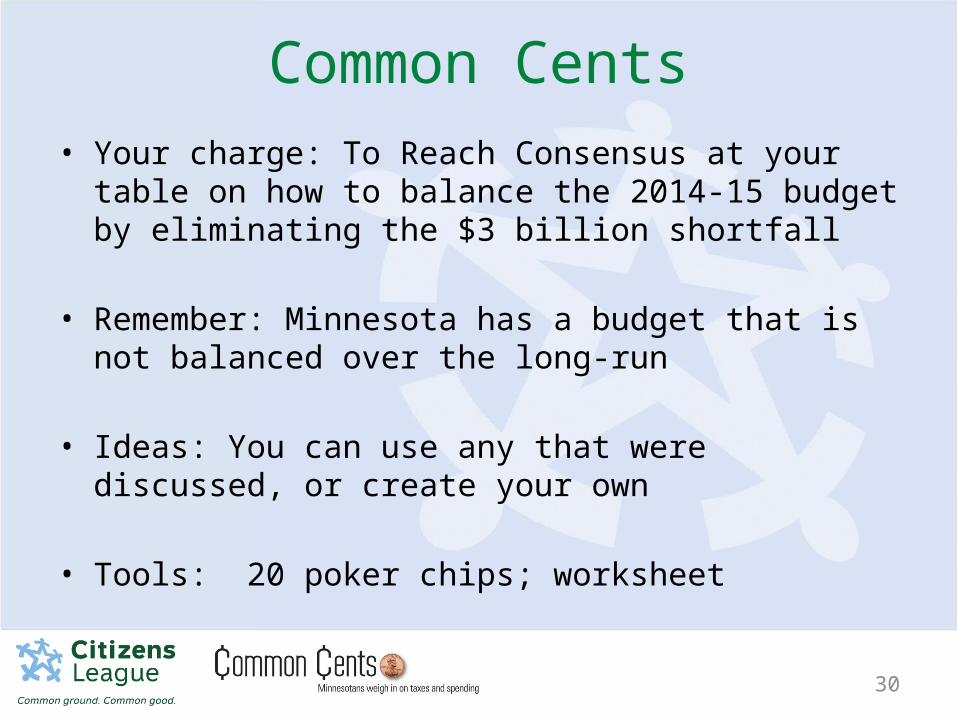
• Your charge: To Reach Consensus at your table on how to balance the 2014-15 budget by eliminating the $3 billion shortfall
• Remember: Minnesota has a budget that is not balanced over the long-run
• Ideas: You can use any that were discussed, or create your own
• Tools: 20 poker chips; worksheet
31
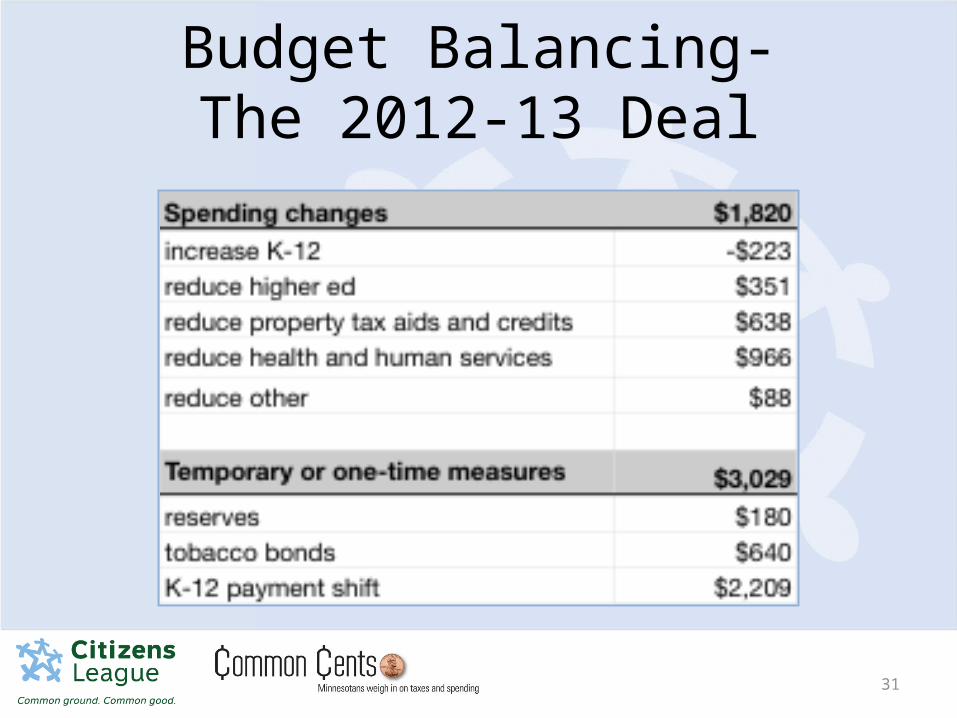
Budget Balancing-The 2012-13 Deal
Common Cents
32
Demographics
Q6. What is your gender?
33
0%
0% 1. Male
2. Female
Q7. How old are you?
34
0%
0%
0%
0%
0% 1. Under 18
2. 19-35
3. 36-50
4. 51-65
5. 66+

Q8. What ethnicity best represents you?
35
0%
0%
0%
0%
0%
0%
0% 1. American Indian or Alaskan Native
2. Asian
3. Black or African American
4. Hispanic or Latino
5. Multiracial
6. White or Caucasian (non-Hispanic)
7. Other
Q9. What best describes your political leanings?
36
0%
0%
0%
0%
0%
0%
0% 1. Conservative
2. Liberal
3. Libertarian
4. Socialist
5. Moderate
6. Mix
7. Other
Q10. Do you have any children under 18 at home?
37
0%
0% 1. Yes
2. No
Q11. Which of these statements about income best represents you?
38
0%
0%
0% 1. It’s hard to make ends meet each month.
2. I’m reasonably comfortable with my income – for now.
3. I’m financially comfortable and have few worries about the future.
39
Thank you!