Embed Size (px)
Citation preview
1
Climate4Media Workshop: Future of
Low Carbon Transportation
Sponsored by British Council, China 25-30 July 2010
Carbon,Congestion and Climate Change Models
Professor Sheri MarkoseUniversity of Essex, United
Kingdom
Economics DepartmentCentre for Computational Finance and Economic Agents
2
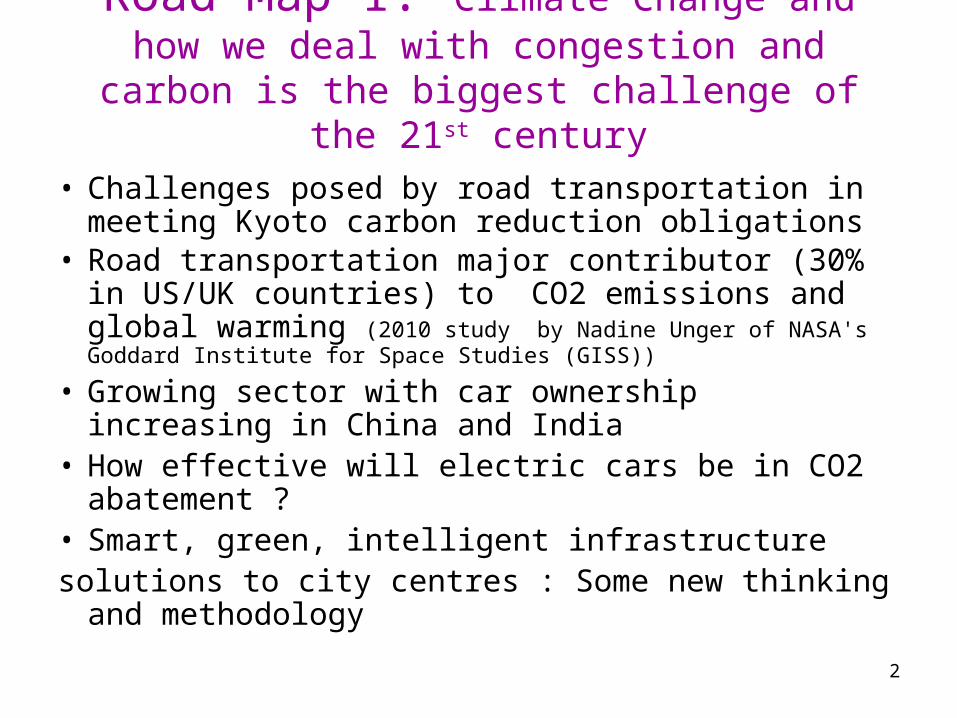
Road Map 1: Climate Change and how we deal with congestion and carbon is the biggest challenge of
the 21st century
• Challenges posed by road transportation in meeting Kyoto carbon reduction obligations
• Road transportation major contributor (30% in US/UK countries) to CO2 emissions and global warming (2010 study by Nadine Unger of NASA's Goddard Institute for Space Studies (GISS))
• Growing sector with car ownership increasing in China and India
• How effective will electric cars be in CO2 abatement ? • Smart, green, intelligent infrastructure solutions to city centres : Some new thinking and
methodology
3
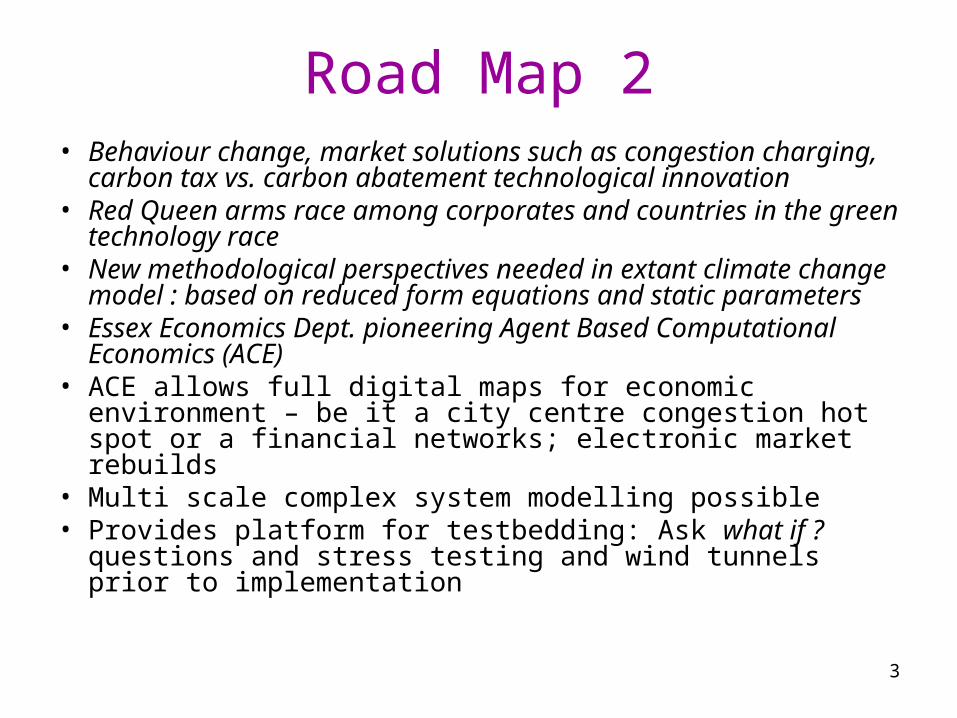
Road Map 2• Behaviour change, market solutions such as congestion
charging, carbon tax vs. carbon abatement technological innovation
• Red Queen arms race among corporates and countries in the green technology race
• New methodological perspectives needed in extant climate change model : based on reduced form equations and static parameters
• Essex Economics Dept. pioneering Agent Based Computational Economics (ACE)
• ACE allows full digital maps for economic environment – be it a city centre congestion hot spot or a financial networks; electronic market rebuilds
• Multi scale complex system modelling possible• Provides platform for testbedding: Ask what if ? questions and
stress testing and wind tunnels prior to implementation
4
• Why have regional workshops with media, business, local and regional authorities and rank and file ?
• Chief Economist Talking to Chief Economist Or Elites Talking behind electrified fences on climate change issues : that is no good
• Why? Individual behaviour change; business and risk management innovation; govt. to coordinate with all three; all being informed and taking responsibility
• 2007 : My experience of regional climate workshops co-hosted a East of England Congestion and Carbon Conference; 2008 East Yorkshire and Humberside Climate Conference
Applaud the Climate Cool Media Workshop: Future of Low Carbon Transportation
5
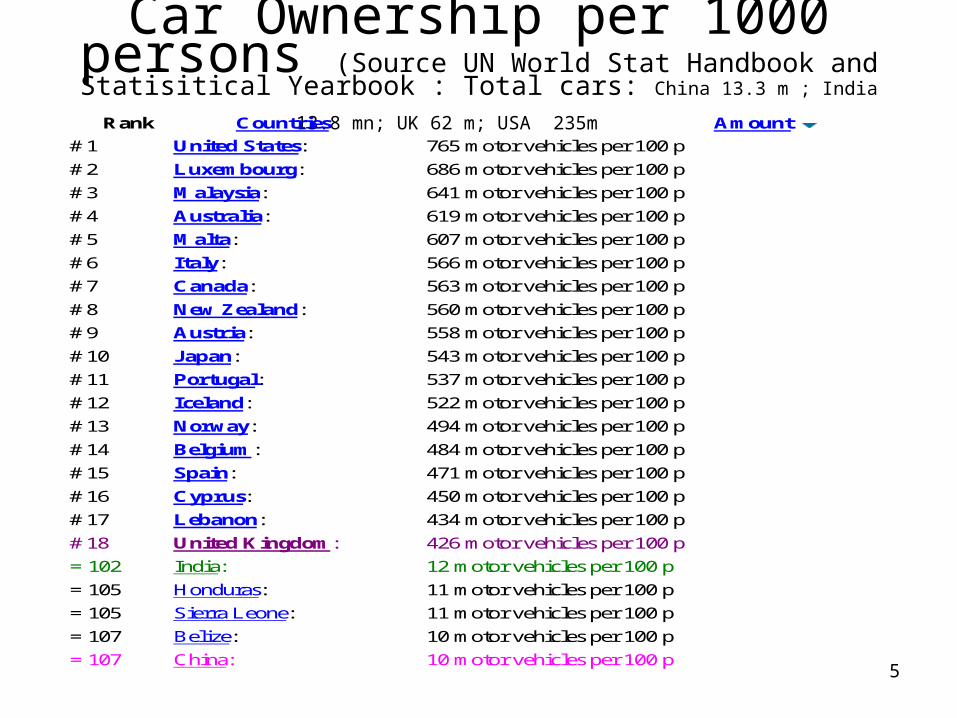
Car Ownership per 1000 persons (Source UN World Stat Handbook and Statisitical Yearbook : Total
cars: China 13.3 m ; India 13.8 mn; UK 62 m; USA 235m Rank Countries Amount
# 1 United States: 765 motor vehicles per 100 p
# 2 Luxembourg: 686 motor vehicles per 100 p
# 3 Malaysia: 641 motor vehicles per 100 p
# 4 Australia: 619 motor vehicles per 100 p
# 5 Malta: 607 motor vehicles per 100 p
# 6 Italy: 566 motor vehicles per 100 p
# 7 Canada: 563 motor vehicles per 100 p
# 8 New Zealand: 560 motor vehicles per 100 p
# 9 Austria: 558 motor vehicles per 100 p
# 10 Japan: 543 motor vehicles per 100 p
# 11 Portugal: 537 motor vehicles per 100 p
# 12 Iceland: 522 motor vehicles per 100 p
# 13 Norway: 494 motor vehicles per 100 p
# 14 Belgium: 484 motor vehicles per 100 p
# 15 Spain: 471 motor vehicles per 100 p
# 16 Cyprus: 450 motor vehicles per 100 p
# 17 Lebanon: 434 motor vehicles per 100 p
# 18 United Kingdom: 426 motor vehicles per 100 p
= 102 India: 12 motor vehicles per 100 p
= 105 Honduras: 11 motor vehicles per 100 p
= 105 Sierra Leone: 11 motor vehicles per 100 p
= 107 Belize: 10 motor vehicles per 100 p
= 107 China: 10 motor vehicles per 100 p
6
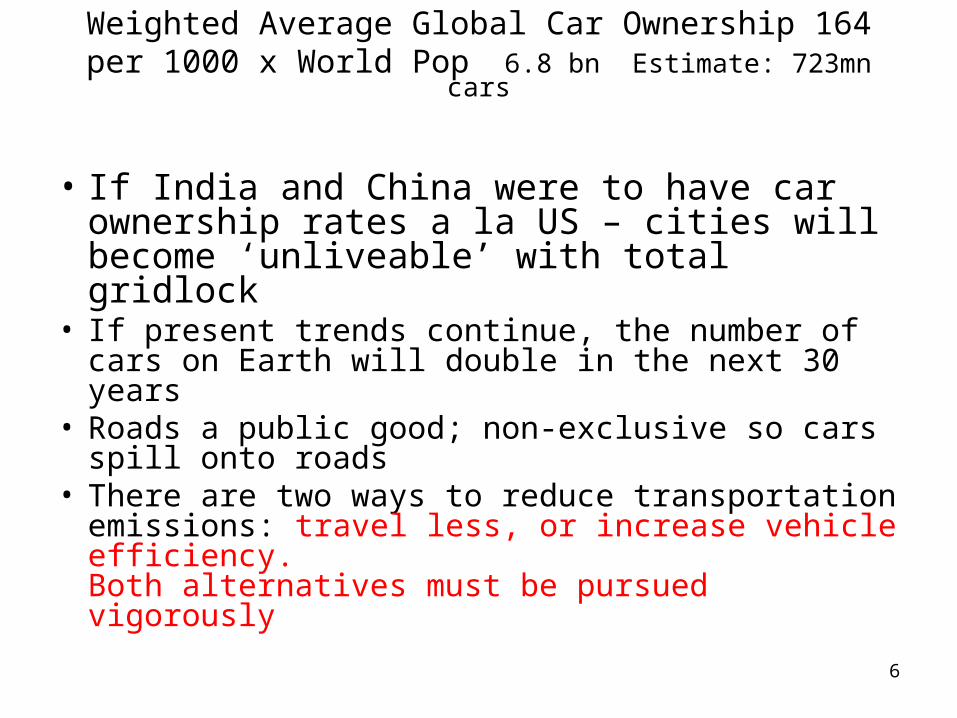
Weighted Average Global Car Ownership 164 per 1000 x World Pop 6.8 bn Estimate: 723mn cars
• If India and China were to have car ownership rates a la US – cities will become ‘unliveable’ with total gridlock
• If present trends continue, the number of cars on Earth will double in the next 30 years
• Roads a public good; non-exclusive so cars spill onto roads
• There are two ways to reduce transportation emissions: travel less, or increase vehicle efficiency.Both alternatives must be pursued vigorously
7
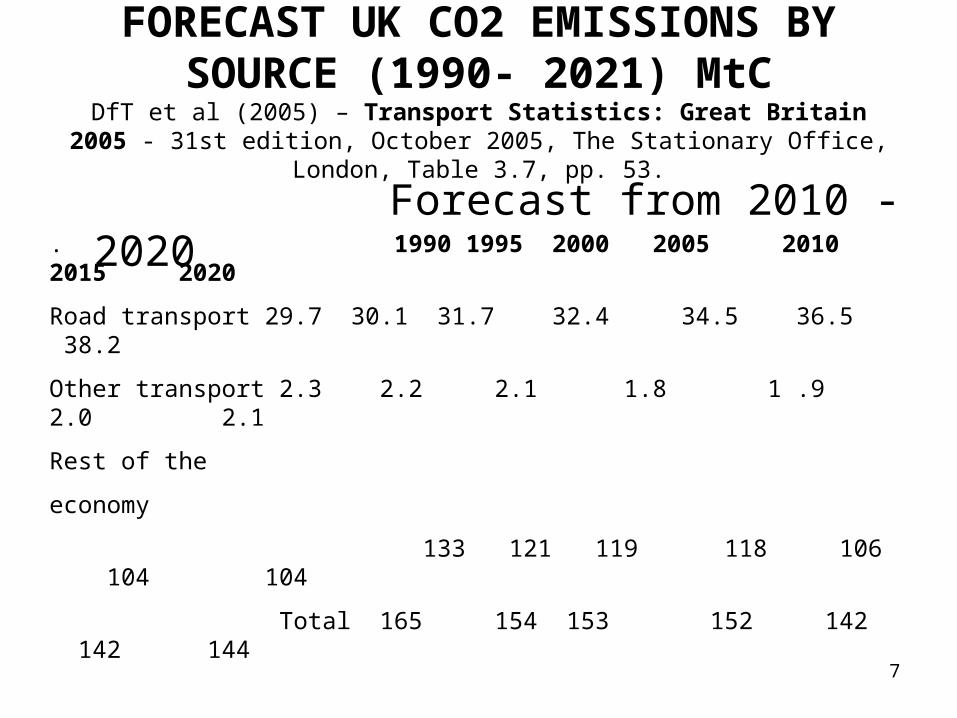
FORECAST UK CO2 EMISSIONS BY SOURCE (1990- 2021) MtC
DfT et al (2005) – Transport Statistics: Great Britain 2005 - 31st edition, October 2005, The Stationary Office,
London, Table 3.7, pp. 53.
Forecast from 2010 -2020. 1990 1995 2000 2005 2010 2015 2020
Road transport 29.7 30.1 31.7 32.4 34.5 36.5 38.2
Other transport 2.3 2.2 2.1 1.8 1 .9 2.0 2.1
Rest of the
economy
133 121 119 118 106 104 104
Total 165 154 153 152 142 142 144
8
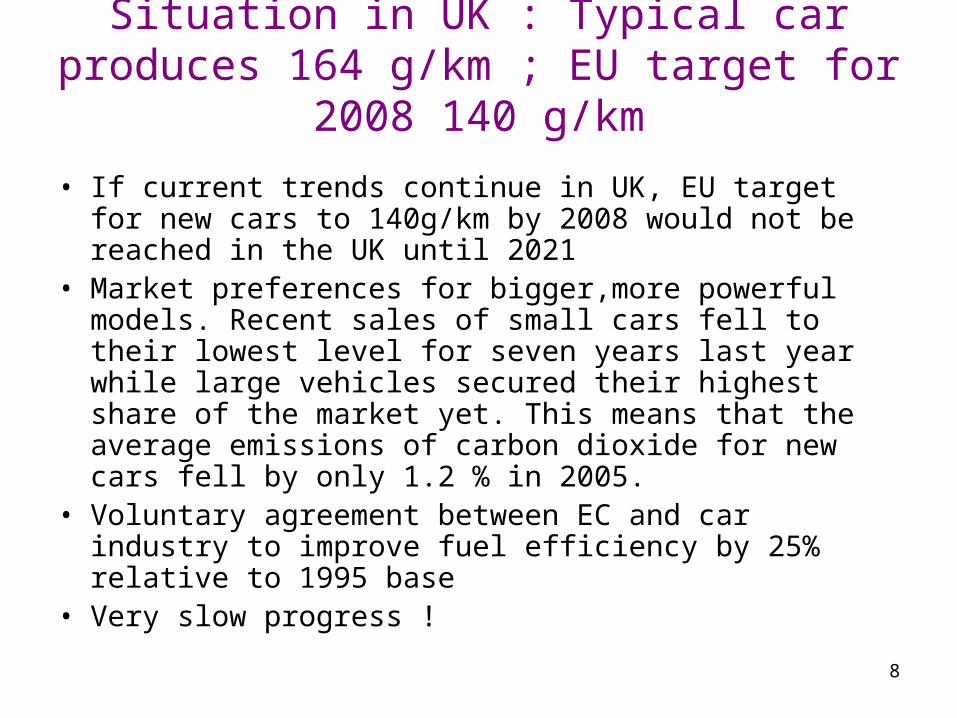
Situation in UK : Typical car produces 164 g/km ; EU target for 2008 140 g/km
• If current trends continue in UK, EU target for new cars to 140g/km by 2008 would not be reached in the UK until 2021
• Market preferences for bigger,more powerful models. Recent sales of small cars fell to their lowest level for seven years last year while large vehicles secured their highest share of the market yet. This means that the average emissions of carbon dioxide for new cars fell by only 1.2 % in 2005.
• Voluntary agreement between EC and car industry to improve fuel efficiency by 25% relative to 1995 base
• Very slow progress !
9
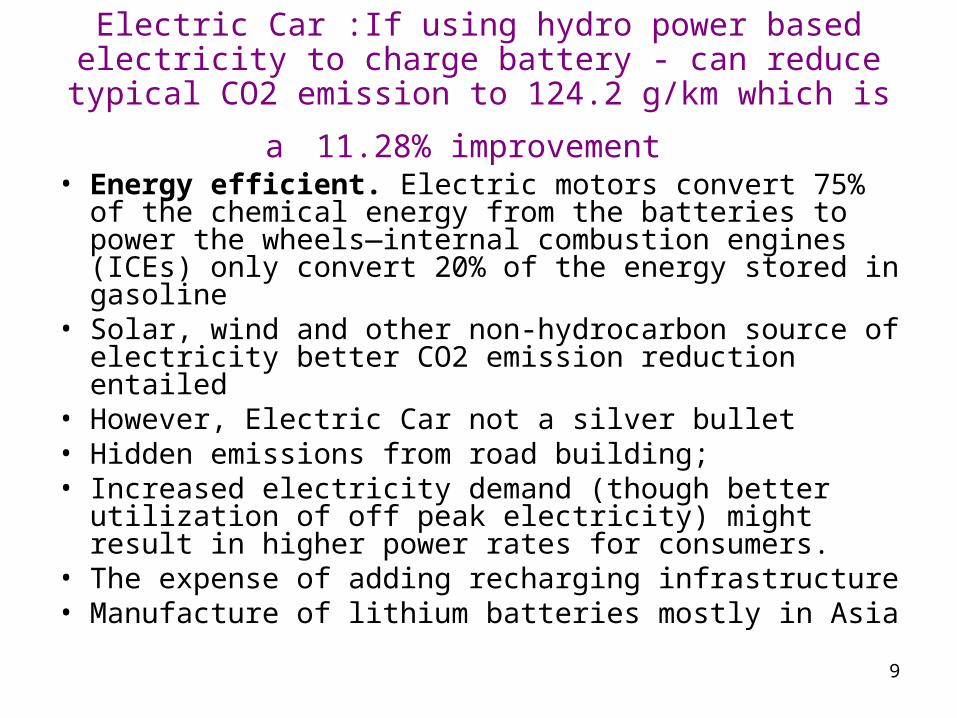
Electric Car :If using hydro power based electricity to charge battery - can reduce typical CO2 emission to 124.2
g/km which is a 11.28% improvement • Energy efficient. Electric motors convert 75% of the
chemical energy from the batteries to power the wheels—internal combustion engines (ICEs) only convert 20% of the energy stored in gasoline
• Solar, wind and other non-hydrocarbon source of electricity better CO2 emission reduction entailed
• However, Electric Car not a silver bullet• Hidden emissions from road building; • Increased electricity demand (though better utilization of
off peak electricity) might result in higher power rates for consumers.
• The expense of adding recharging infrastructure• Manufacture of lithium batteries mostly in Asia
10
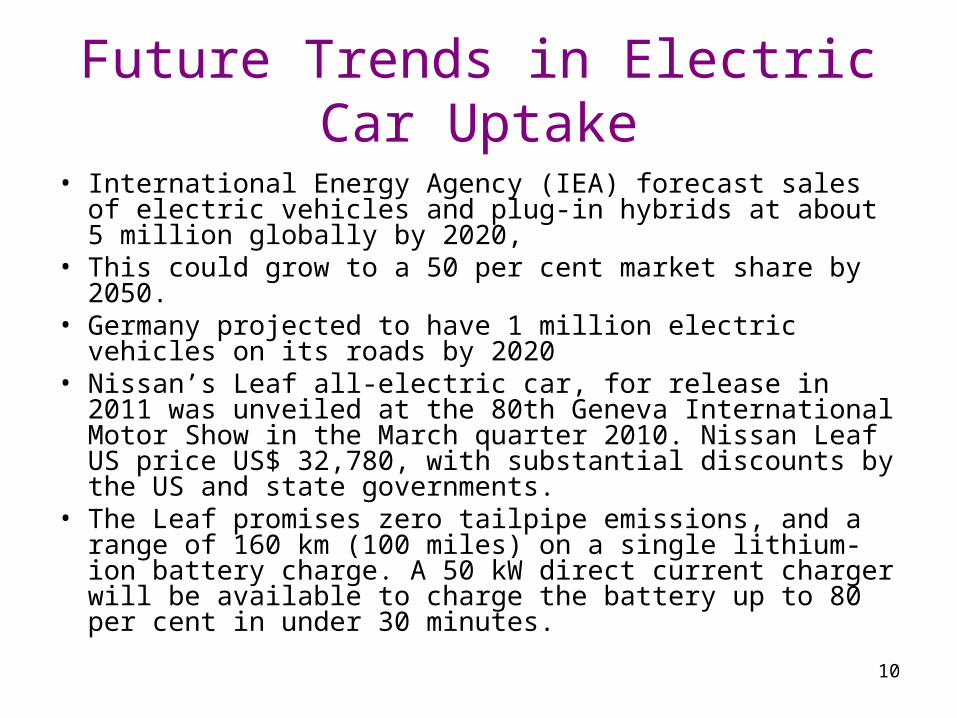
Future Trends in Electric Car Uptake
• International Energy Agency (IEA) forecast sales of electric vehicles and plug-in hybrids at about 5 million globally by 2020,
• This could grow to a 50 per cent market share by 2050. • Germany projected to have 1 million electric vehicles on
its roads by 2020• Nissan’s Leaf all-electric car, for release in 2011 was
unveiled at the 80th Geneva International Motor Show in the March quarter 2010. Nissan Leaf US price US$ 32,780, with substantial discounts by the US and state governments.
• The Leaf promises zero tailpipe emissions, and a range of 160 km (100 miles) on a single lithium-ion battery charge. A 50 kW direct current charger will be available to charge the battery up to 80 per cent in under 30 minutes.
11
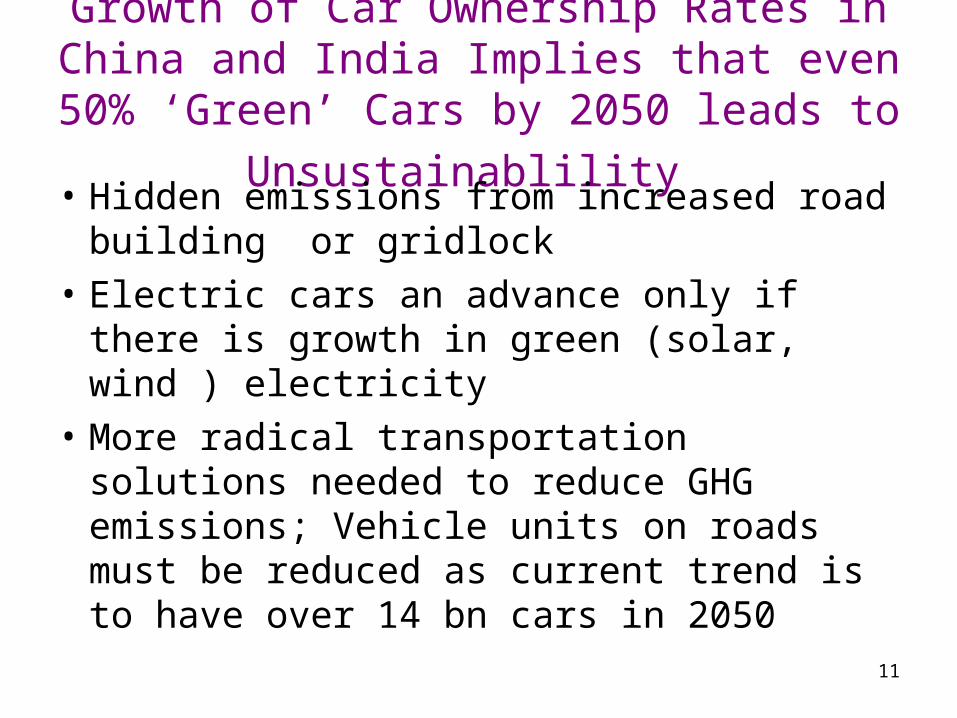
Growth of Car Ownership Rates in China and India Implies that even 50% ‘Green’
Cars by 2050 leads to Unsustainablility • Hidden emissions from increased road
building or gridlock
• Electric cars an advance only if there is growth in green (solar, wind ) electricity
• More radical transportation solutions needed to reduce GHG emissions; Vehicle units on roads must be reduced as current trend is to have over 14 bn cars in 2050
12
Future Intelligent Infrastructure2007 Project funded by
UK Office of Science and Technology Intelligent Charging:
Smart MarketProtocols for Road
Transport
Sheri M. Markose Amadeo Alentorn and Deddy Koesrindartoto Economics Department and Centre For Computational Finance and Economic
Agents (CCFEA), University of Essex,
Phil Blythe, Sergio Grosso, Anett Ehlert and Dilum Dissanayake Transport Operations Research Group (TORG), University of Newcastle upon Tyne
AndPeter Allen
Complex Systems Management Centre, Cranfield School of Management
13
Purpose: How to change travel behaviour, fewer journeys
• Smart Markets could bring intelligence into the road transport network to address congestion; planning of green infrastructure can be done with digitally based agent based models of city centres
• A Smart Market is an on-line auction:– Potential users submit bids
– Auction determines the price and ‘winners’
– Infrastructure operators pre-set the limits (slots)
We explore a road pricing regime which fixes (Cap) the number of vehicles able to use the roads at peak time
14
‘CAP’ and TRADE: Smart Market for Congestion
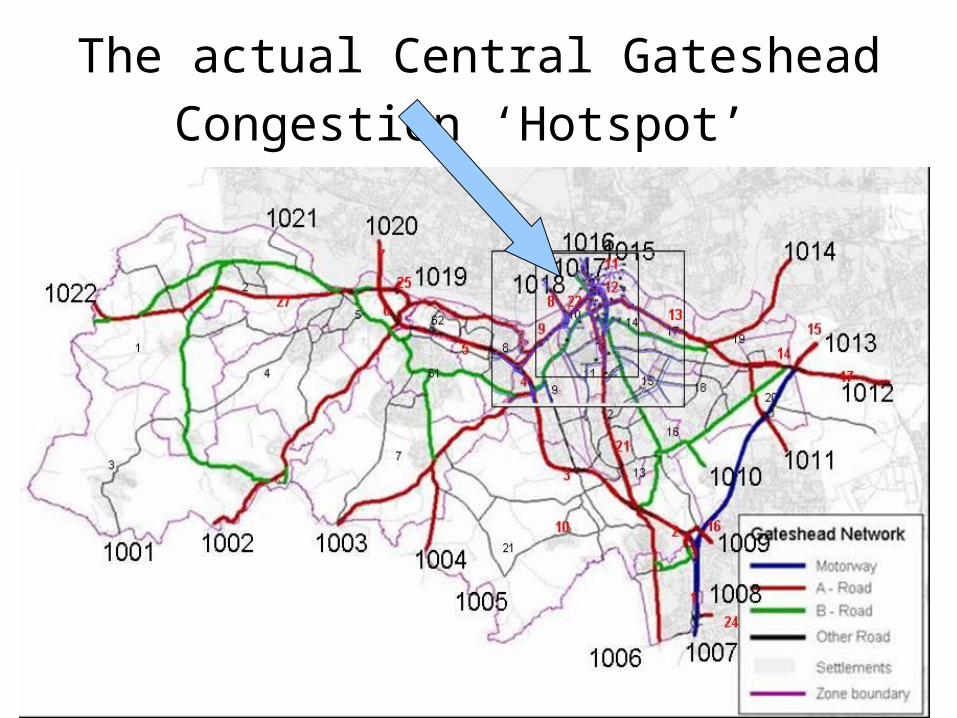
• Rationale : ‘CAP’’ and trade • Application to a typical congestion ‘hotspot’ in
Gateshead• How to ‘cap’ or determine optimal
congestion? TORG /Vissim Traffic Micro Simulator
• Cross Sectional demand analysis : Bid Submission (from individuals)
• SMPRT Algorithm for Price Determination• Winners and losers• Intelligent infra-structure planning
15
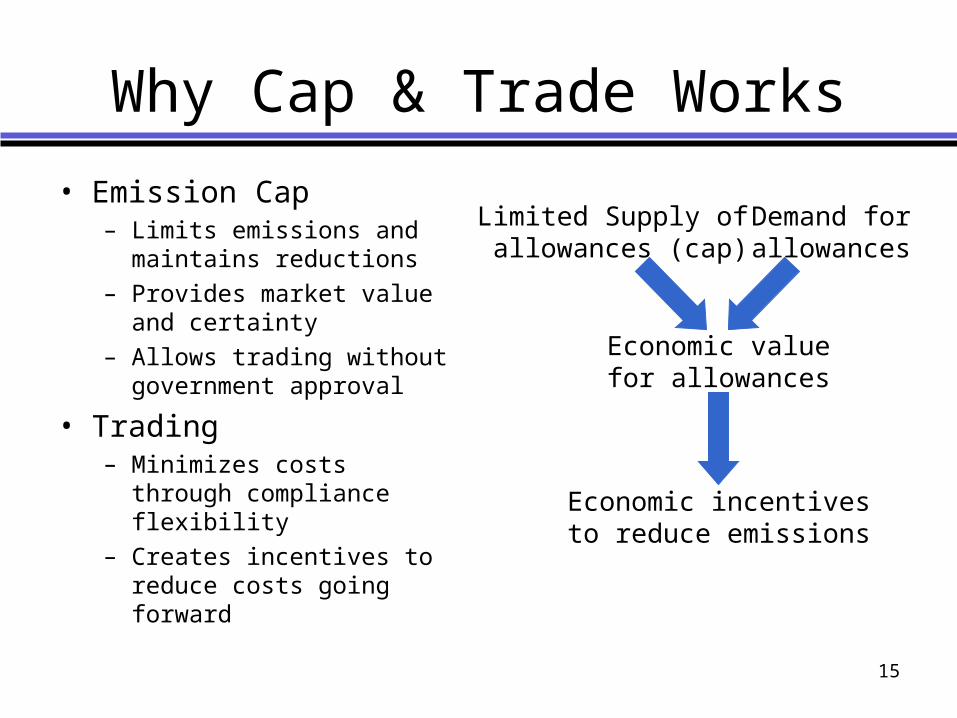
Limited Supply of allowances (cap)
Economic valuefor allowances
Economic incentivesto reduce emissions
Demand forallowances
Why Cap & Trade Works
• Emission Cap– Limits emissions and
maintains reductions– Provides market value and
certainty– Allows trading without
government approval
• Trading– Minimizes costs through
compliance flexibility– Creates incentives to reduce
costs going forward
16
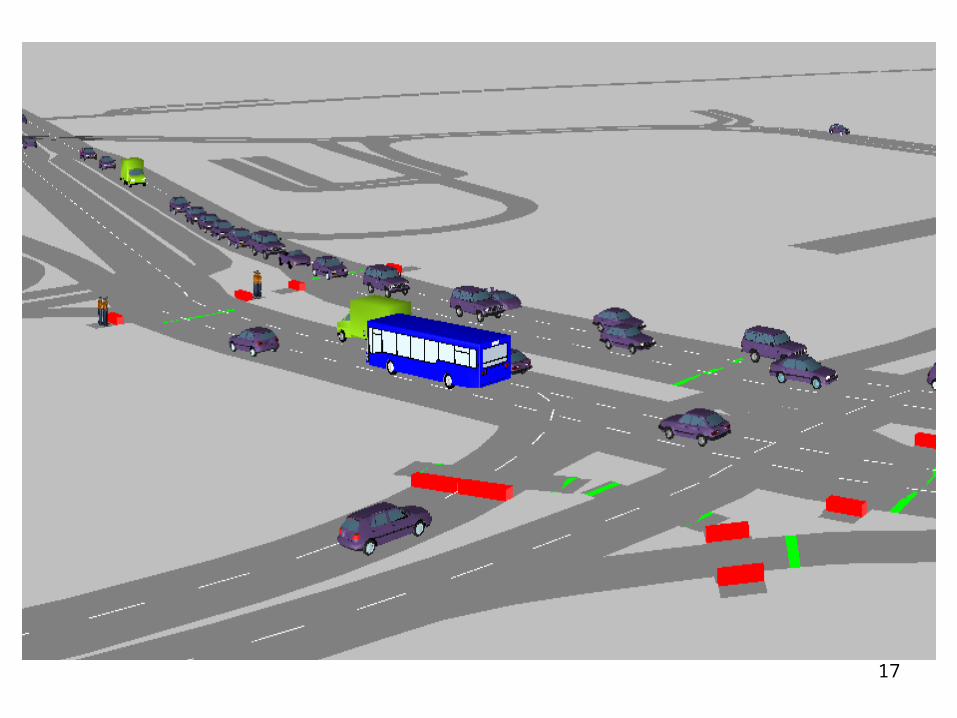
The actual Central Gateshead
Congestion ‘Hotspot’
17
18
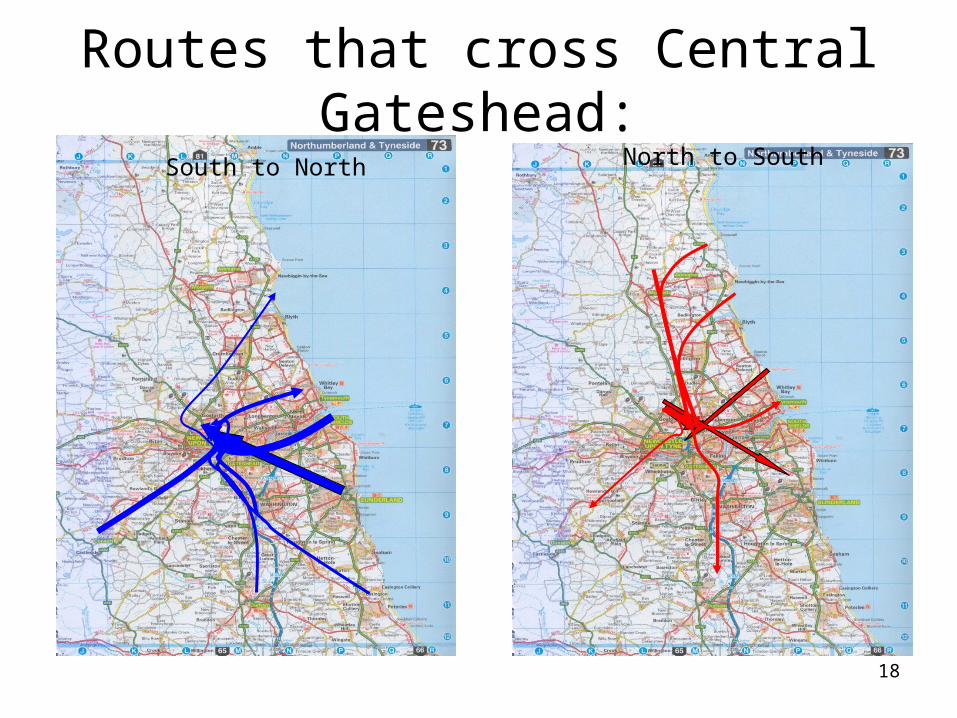
Routes that cross Central Gateshead:
South to North North to South
19
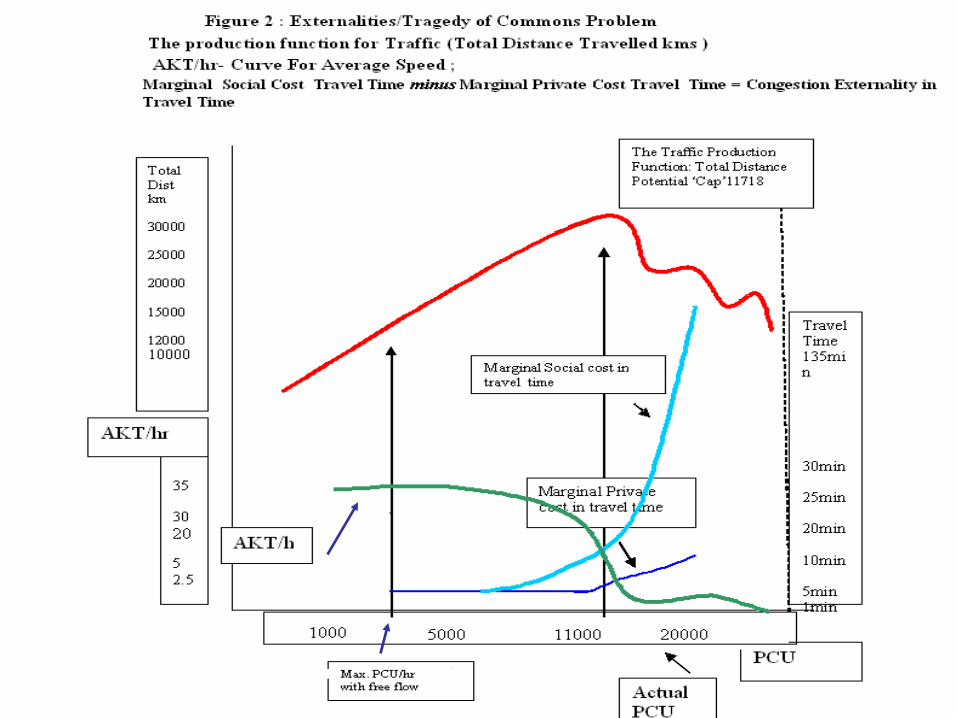
TORG /Vissim Traffic Micro Simulation Results
The cap is • the maximum number of road users permitted to use the road
during a time slice in terms of the criteria.
Based on the ‘production function’ of traffic, the cap is: maximum total distance travelled in the time slice; begins to drop with incremental growth in vehicle volumes;
and the point at which vehicular emissions grow exponentially.
The PCU volumes are scaled from base-line demands in the transport model from between 10% and 170% of current demand
The cap is given as X# passenger car units (PCUs): 11720 PCUs
20
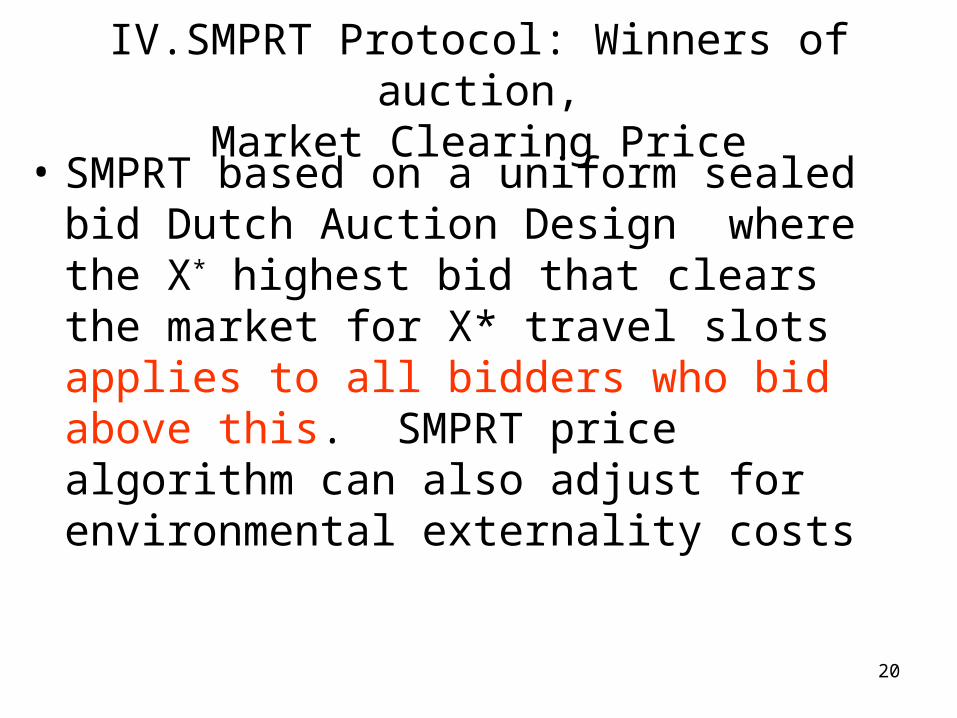
IV.SMPRT Protocol: Winners of auction,Market Clearing Price
• SMPRT based on a uniform sealed bid Dutch Auction Design where the X* highest bid that clears the market for X* travel slots applies to all bidders who bid above this. SMPRT price algorithm can also adjust for environmental externality costs
21
22
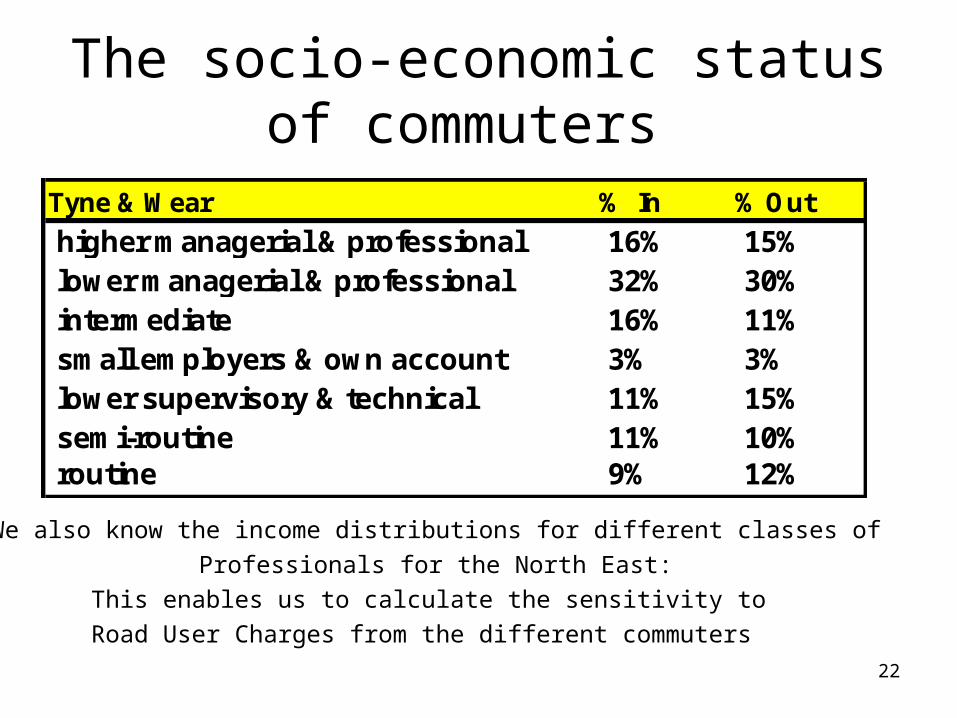
The socio-economic status of commuters
Tyne & Wear % In % Out
higher managerial & professional 16% 15% lower managerial & professional 32% 30% intermediate 16% 11% small employers & own account 3% 3% lower supervisory & technical 11% 15% semi-routine 11% 10% routine 9% 12%
We also know the income distributions for different classes ofProfessionals for the North East:
This enables us to calculate the sensitivity to Road User Charges from the different commuters
23
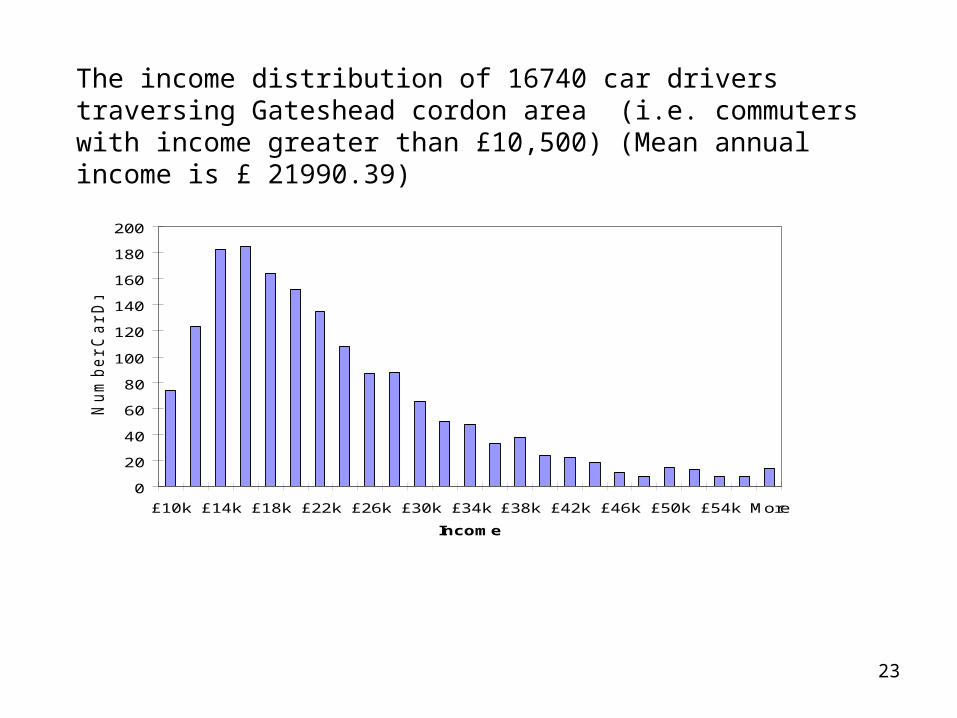
The income distribution of 16740 car drivers traversing Gateshead cordon area (i.e. commuters with income greater than £10,500) (Mean annual income is £ 21990.39)
0
20
40
60
80
100
120
140
160
180
200
£10k £14k £18k £22k £26k £30k £34k £38k £42k £46k £50k £54k More
Income
Nu
mb
er
Ca
r D
rive
rs
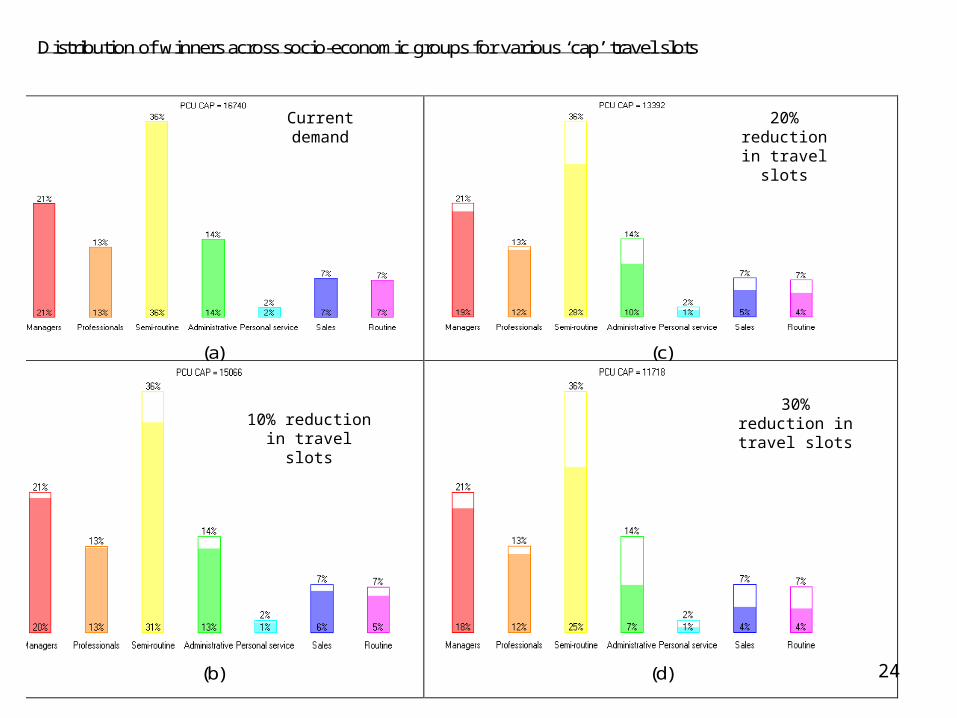
24
Distribution of winners across socio-economic groups for various ‘cap’ travel slots
(a)
(c)
(b)
(d)
10% reduction in travel slots
20% reduction in travel slots
30% reduction in travel slots
Current demand
25
Digital ACE model pin points where persons who are priced out live and
work • Intelligent public transport infrastructure
can be organized for them
• This analysis can be done for any city congestion hotspot
• Radical urban planning solutions needed
• ‘Roll on’ Roll off’ trams/trains for bikes in cities like Beijing
• Over head pathways in high rise buildings
26
Mitigation of Carbon Emissions: Market Solutions and Technology Arms Race
• Mr. Stern presents climate change as the biggest market failure. Over use and degradation of resources due to missing markets
• Appropriate prices that reflect the cost of damage from economic activities
• We need a price for carbon so that companies and consumers would pay for their emissions
27
Economic Impacts of Climate Change: Further modelling
• Examples of this : Statistical models starting from impact of climate change on El Nino and El Nana oceanic systems followed by implied variations on regional of the globe and estimated damage (2006, Calzadilla, Pauli and Roson)
• Modelling climate change risk and extreme climate events still in infancy
• Climate change affects communities and societies ; also companies and the financial sector. Extreme weather events can ruin companies and destroy economical value.
• Growing recognition that with a warming planet, risk and corporate business must factor climate change risk
• Insurance penetration in the West for climate change has grown substantially: courts seek to attribute liability from weather losses
• People living in vulnerable areas of developing countries are the most affected by the effects of climate change due to lack of civil society, market and social insurance
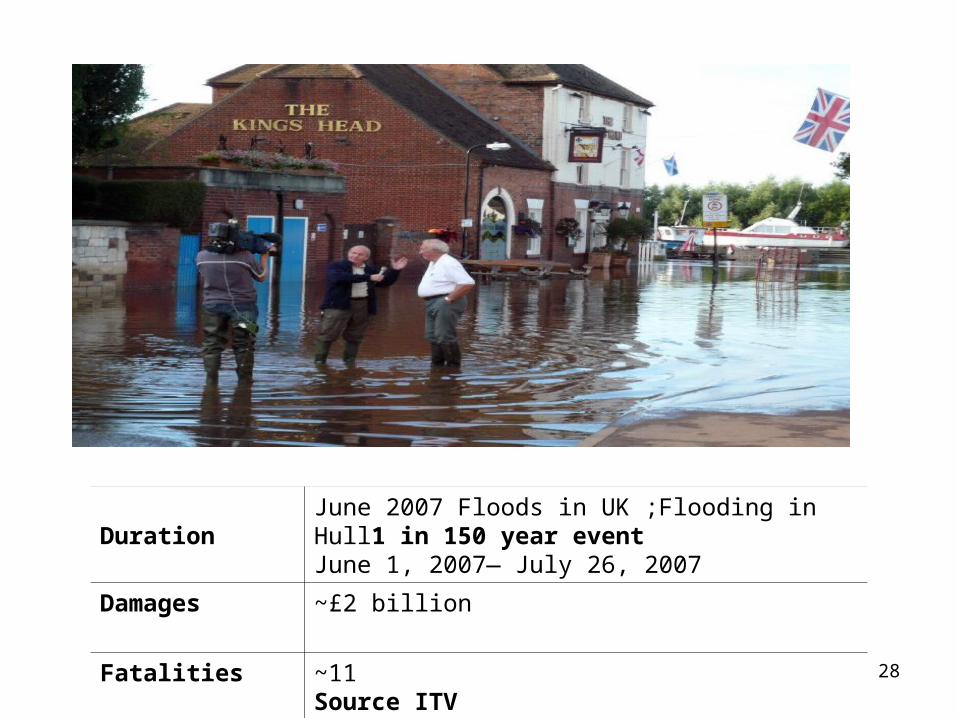
28
DurationJune 2007 Floods in UK ;Flooding in Hull1 in 150 year eventJune 1, 2007— July 26, 2007
Damages ~£2 billion
Fatalities ~11Source ITV
29
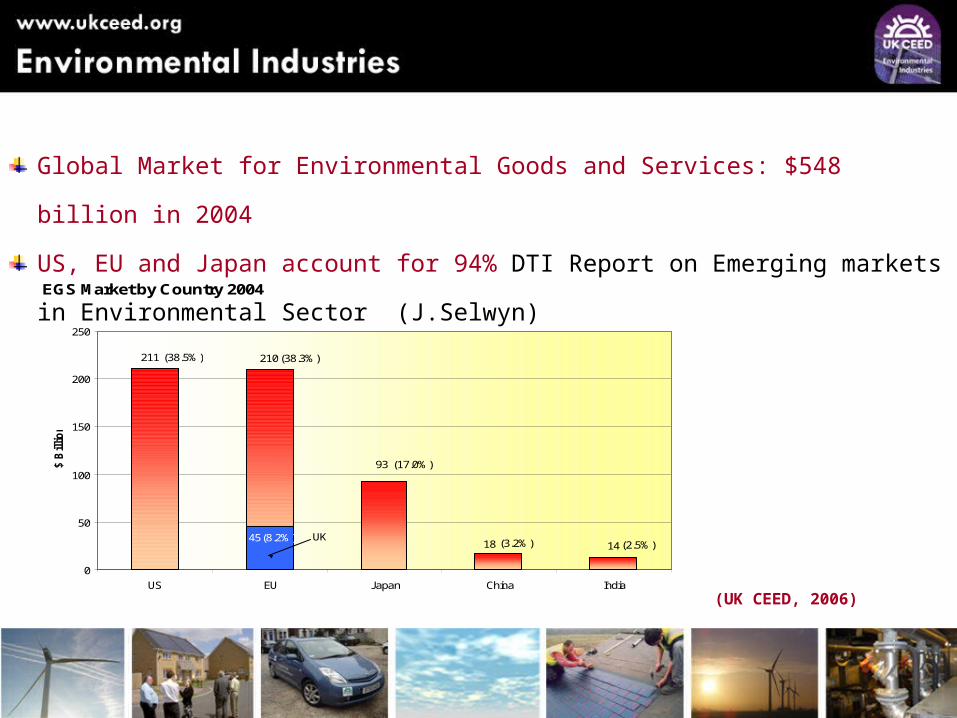
Global Market for Environmental Goods and Services: $548 billion in 2004
US, EU and Japan account for 94% DTI Report on Emerging markets in
Environmental Sector (J.Selwyn)EGS Market by Country 2004
1418
93
210211
(3.2%)
(17.0%)
(38.3%)(38.5%)
(2.5%)UK45(8.2%)
0
50
100
150
200
250
US EU Japan China India
$ B
illio
n
(UK CEED, 2006)
30
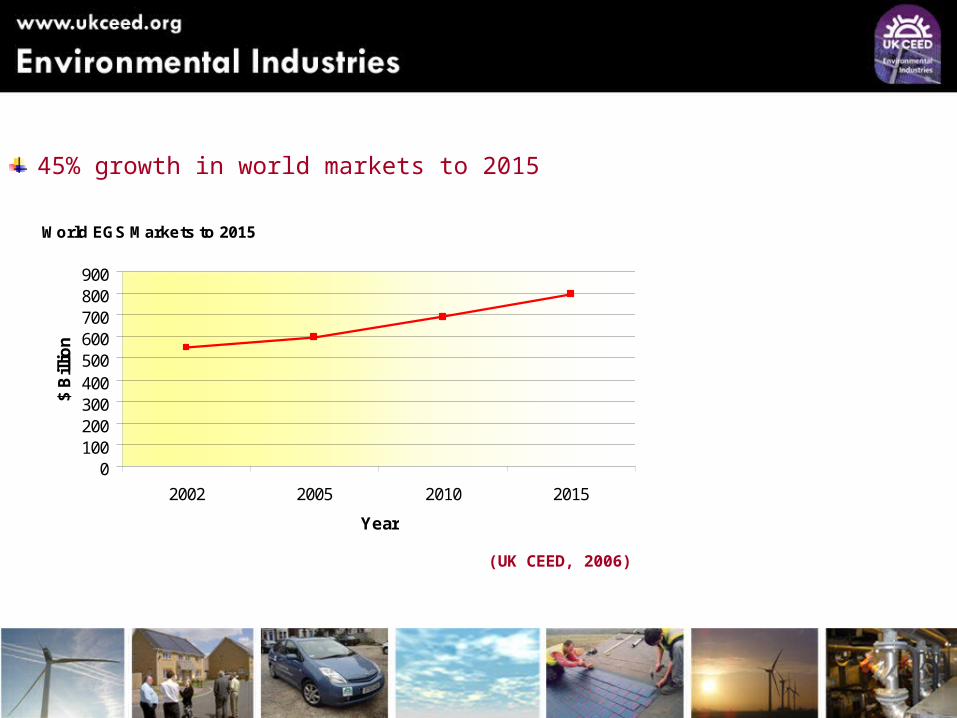
45% growth in world markets to 2015
World EGS Markets to 2015
0100200300400500600700800900
2002 2005 2010 2015
Year
$ B
illio
n
(UK CEED, 2006)
31
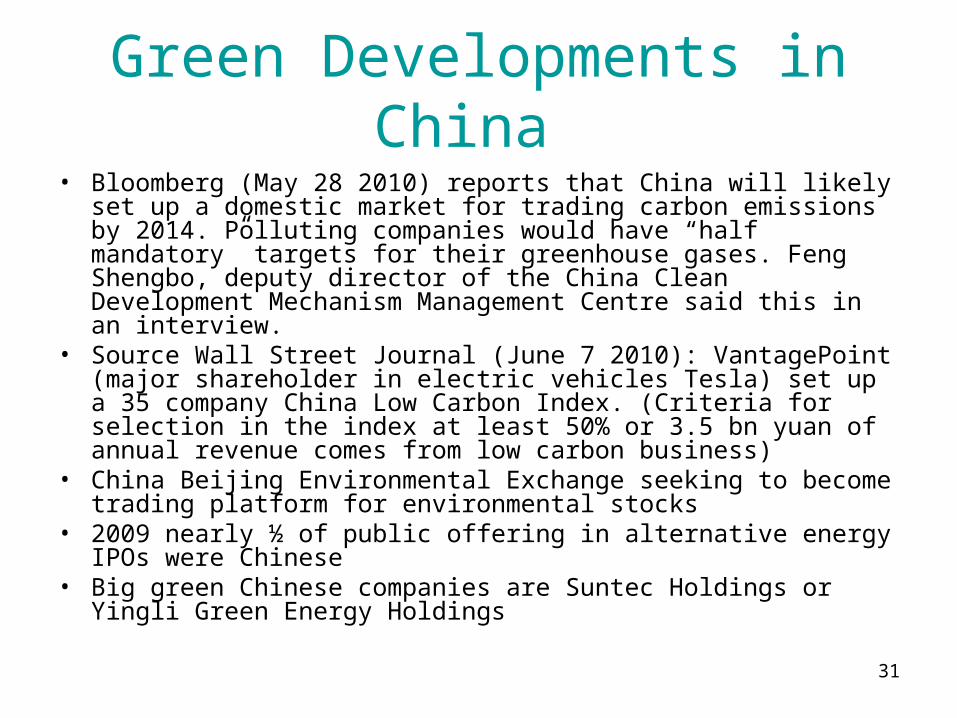
Green Developments in China • Bloomberg (May 28 2010) reports that China will likely set up a
domestic market for trading carbon emissions by 2014. Polluting companies would have “half mandatory” targets for their greenhouse gases. Feng Shengbo, deputy director of the China Clean Development Mechanism Management Centre said this in an interview.
• Source Wall Street Journal (June 7 2010): VantagePoint (major shareholder in electric vehicles Tesla) set up a 35 company China Low Carbon Index. (Criteria for selection in the index at least 50% or 3.5 bn yuan of annual revenue comes from low carbon business)
• China Beijing Environmental Exchange seeking to become trading platform for environmental stocks
• 2009 nearly ½ of public offering in alternative energy IPOs were Chinese
• Big green Chinese companies are Suntec Holdings or Yingli Green Energy Holdings
32
More Radical Ideas: Personal carbon allowances- Not Regressive like Carbon
Tax or Petrol Tax
• At the moment it’s about governments and ‘installations’, not about individuals.
What would an optimal system look like? • Individuals given a tradable carbon
allowance;• Incentives at the right level of decision
making;Problem = administrative costs;• May be opportunities to start trading at LAD
level – but measurement issues.
33
Critique of Extant Economic Models of Climate Change: Single parameters to
capture complex dynamics • Main responses to climate change: Adaptation, Conservation
(reduce use of CO2 high energy with extant technology); CAT-I Carbon Abatement Technology Innovation
• Consumer preferences unchanging during model horizon : hence no consideration of diffusion of ‘green ethic’
Extensive study of household preference change: In the UK using BHPS data
• No link up to institutional structures and incentives involved within Sectors eg Emissions Trading ; Insurance and Finance sectors involved in innovative risk management for extreme climate events (catastrophe insurance )
• No model of competitive co-evolution arms race which already in place for CAT-I where green sector growth and drive for market share has started; New CAT-I firms becoming market leaders or extant firms converting to CAT (eg Walmart/Asda and Honda showcasing their green technology )
34
Multi-Scale Complex System Analysis Needed
• Sectoral disaggregation alone not enough for policy analysis
• Most of all no transitional path dependencies : Necessary to digitally and dynamically track the transition of the economy from high carbon use to low carbon
• Marginal Cost- Benefit Analysis assume incremental change and not major structural or emergent change
• Micro-decisions of interconnected agents (household or firms ) can have macro-systemic implications: CAT-I disruptive technology change accelerated obsolescence of extant industry
• How an economy transits to low carbon in terms of lost employment and output in ‘old’ technology and drivers for GDP growth through a combination Adaptation, Conservation and CAT-I requires ACE type frameworks
• Why? Individual behaviour change; CAT-I technology race ; business and risk management innovation; govt. to coordinate with all three; all being informed and taking responsibility
35
Climace and Flame Needed
• Tracking household level consumption and behaviour/preference change for green goods
• Dynamic tracking of interconnected multi-scale firm level CAT-I and ETS Activity
• UK regional and sectoral adaptation projects • Explicit incorporation of climate change risks to
business and climate change financial products• Computational test beds for policy analysis• Socio-economic sustainability index in addition
to DICE type cost benefit analysis
36
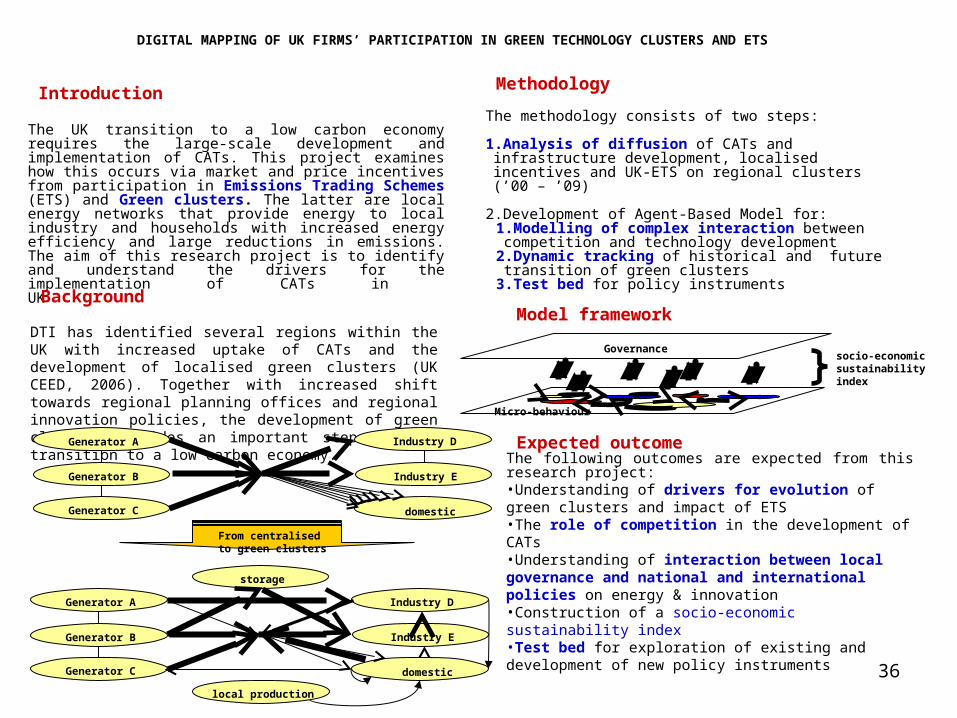
Introduction
The UK transition to a low carbon economy requires the large-scale development and implementation of CATs. This project examines how this occurs via market and price incentives from participation in Emissions Trading Schemes (ETS) and Green clusters. The latter are local energy networks that provide energy to local industry and households with increased energy efficiency and large reductions in emissions. The aim of this research project is to identify and understand the drivers for the implementation of CATs in UK
Background
DTI has identified several regions within the UK with increased uptake of CATs and the development of localised green clusters (UK CEED, 2006). Together with increased shift towards regional planning offices and regional innovation policies, the development of green clusters provides an important step for the transition to a low carbon economy.
Model framework
Expected outcomeThe following outcomes are expected from this research project:•Understanding of drivers for evolution of green clusters and impact of ETS•The role of competition in the development of CATs•Understanding of interaction between local governance and national and international policies on energy & innovation•Construction of a socio-economic sustainability index•Test bed for exploration of existing and development of new policy instruments
DIGITAL MAPPING OF UK FIRMS’ PARTICIPATION IN GREEN TECHNOLOGY CLUSTERS AND ETS
Methodology
The methodology consists of two steps:
1.Analysis of diffusion of CATs and infrastructure development, localised incentives and UK-ETS on regional clusters (’00 – ’09)
2.Development of Agent-Based Model for:1.Modelling of complex interaction between competition and technology development
2.Dynamic tracking of historical and future transition of green clusters
3.Test bed for policy instruments
Generator A
Generator B
Generator C
Industry D
Industry E
domestic
storage
local production
Generator A
Generator B
Generator C
Industry D
Industry E
domestic
From centralised to green clusters
Micro-behaviour
Governancesocio-economicsustainabilityindex
37
Concluding Remarks *Electric Cars can be effective in CO2 only if wholesale use of
renewable sources of electricity is available*In Asian cities (and world over ) each city roughly doubling motor
vehicle populations, due to the forecast rise in income levels in the business-as-usual scenario, and tripling of fuel use and CO2 emissions between 2005 and 2020; unsustainable choices made in the West to date must be resisted by China and India and in so doing will lead the green technology race
*Example of Shanghai where integrated and ICT base intelligent road transport is designed “Among major Chinese cities, Shanghai has one of the lowest ratios of cars to population, even though it has one of the highest gross domestic product per capita. This situation has been achieved through a deliberate effort by the municipal government to preserve the city’s character and environment, largely through the use of regulations, incentives, and fees.” (Source ADA Study 2010)
38
References • Markose S., Alentorn A., Koesrindartoto D., Allen P., Blythe P. and Grosso S.,
2007, “A smart market for passenger road transport (SMPRT) congestion: An application of computational mechanism design ”, Journal of Economic Dynamics and Control , Volume 31, Issue 6, June 2007, Pages 2001-2032 , ISSN: 0165-1889.
• Essex Congestion and Carbon Conference, which covered topics on Design and Public Policy: Markets for Congestion and Carbon Trading (http://www.essex.ac.uk/eccc/ )
• CLIMACE http://www.acefinmod.com/docs/CLIMACE%20Workshop%20May%2009/6.%20Sheri%20Markose%20Cost%20Benefit%20analysis.ppt. For full program seehttp://www.acefinmod.com/climace.html
• Energy Efficiency and Climate Change Considerations for On-road Transport in Asia
2010 Asian Development Bank http://www.adb.org/Documents/Reports/Energy-Efficiency-Transport/chap02.pdf