Embed Size (px)
Citation preview
1
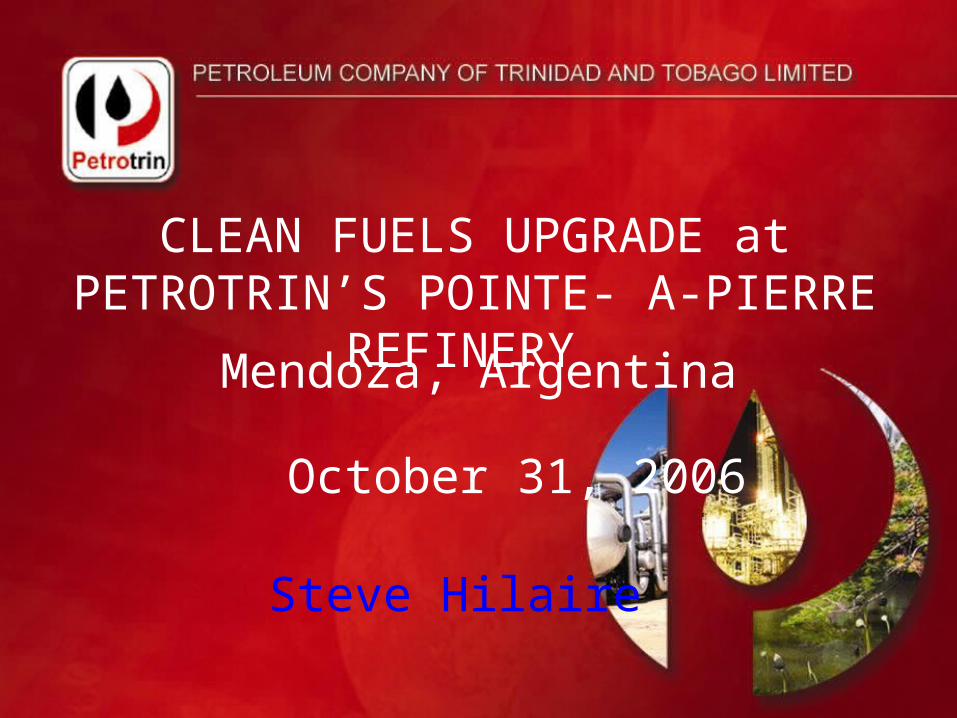
CLEAN FUELS UPGRADE at PETROTRIN’S POINTE- A-PIERRE
REFINERY Mendoza, Argentina
October 31, 2006
Steve Hilaire

2
OUTLINE
Introduction Business Background Scope Economics Capital Expenditure Results & Benefits Project Risks Status Financing Template

3
LOCATION MAP OF TRINIDAD
HONDURAS
NICARAGUA
COSTA RICA PANAMA
JAMAICA HISPANIOLA PUERTORICO
TRINIDAD
TOBAGO
GUATEMALA
ELSALVADOR
COLOMBIA
90 W 80 W 70 W 60 W
20 N
30 N
10 N
90 W 80 W 70 W
20 N
30 N
10 N
Caribbean Sea
60 W
SEE INSET
VENEZUELA
Atlantic Ocean
C a r i b b e a n S e a
N
Gulf of
Paria
C o l u m b u s C h a n n e l
TRINIDAD
INSETTOBAGO
Geostar1-lmot.cdr-1996

4
Introduction – About Trinidad & Tobago
Access to emerging & developed markets
Highly skilled and trained workforce Stable economic/political
environment Global leader in
Export of Methanol Export of Ammonia Export of LNG to USA

5
Introduction – PETROTRIN History 1917: Commence Operations of P-a-P Refinery 1940/41: Eastern Refinery Established 1952: FCCU Installed 1956: Acquisition by Texaco 1958: No 1 CRU – Gasoline Upgrade & BTX 1960/62: No 8 CDU, No 1 HTU, No 2 CRU 1964/66: Lube Oil & Normal Paraffins 1972: No 4 VDU & No 2 HTU –Fuel Oil Desulf 1985: Acquisition by State 1992/96: Refinery Upgrade – Phase 1
Increased Conversion & Full Refining Capacity Partial Revamp of FCCU Rehab of No 2 HTU, No 2 CRU, New Units: VBU, Hydrogen, Sulfur, MTBE DCS Controls

6
Introduction – PETROTRIN OVERVIEW
Fully State-owned Commercially operated Integrated
Exploration Production Refining Marketing

7
Introduction – Crude Oil Supply Crude capacity – 168 MBPCD Current conversion capacity 150 MBPD
Local crude 40 – 45 % (low cetane gas oil) Imported crudes
Venezuela Brazil Columbia Ecuador West Africa (high cetane)

8
Introduction – Product Supply Markets
Local 100 % - 18% of Volume Regional 75 % - 30% of Volume Extra regional 5 % - 20% of Volume International - 32% of Volume
Approx 10 % volume- unfinished/low value products
CRU naphtha Low octane mogas FCCU feed (VGO)

9
Introduction: Operational Performance – R&M
Financial Performance
Profitability
Cash Flow
ROACE
Market Price
Mix + Volumes
Direct Cost
Other
Sustaining
Growth
Sales Revenue
OPEX
CAPEX
There are multiple areas where changes could improve future financial performance
Performance Factors
Petrotrin is highly sensitive to market price because it is a merchant refinerHigh fuel oil cut & low value products reduces profitsLacks clean fuels capacity
High unit operating costs compared to peers
Indigenous crude only supplies 40% of needs
High spend on maintaining competitiveness of old infrastructure
Project delays / deferrals have led to missed opportunities

10
Introduction: Operational Performance –
R&M
Performance
Profitability
Cash Flow
ROACE
Market Price
Mix + Volumes
Direct Cost
Other
Sustaining
Growth
Sales Revenue
OPEX
CAPEX
Current and Planned R&M Improvement Initiatives
A mixture of upgrades and operational changes to improve performance
Clean fuels upgrade – in progress
Refinery business improvement project (SGSI)
E&P oil winning projects (halt production decline)
Infrastructure upgrade (planning stage)
Bottom of Barrel Upgrade (conceptual stage)
Gasoline upgrade (implementation stage)

11
BUSINESS BACKGROUND – Driving Forces
Gasoline Optimisation Program Equipment Integrity
No 1 CRU: 3 of 4 Rxs Changed – Expect 3 years Max No 2 CRU: Remaining Life Estimated at 6 – 8 years
Sale of Unfinished Low Value Product Reformer Feed Low Octane Gasoline VGO as FCCU Feed
Tighter Specifications Elimination of Lead & MTBE– Octane & Volume Loss Lower Benzene, Sulfur, Olefins and RVP Increased Octane Demand Shortfall of Premium Gasoline to some markets

12
BUSINESS BACKGROUND – Driving Forces (Cont’d)
Tighter Diesel Specifications Sulfur Reduction Cetane Increase Decrease in aromatics
Phase II - BOB Upgrade High Fuel percent of Product Sales Shrinking Fuel Oil Market

13
BUSINESS BACKGROUND – Options
1. Discontinue Refining Operations
Huge economic impact on country and South in particular.
2. New refinery Grassroots facility US$3-4 Bn
3. Upgrade Current refinery
Performance and Technology

14
Scope Identified
Gasoline Optimisation Program FCCU: Upgrade
Capacity from 26,000 BPSD to 35,000 BPSD Product Octane from 81 MON to 83 MON
Pre-Fractionation Remove Benzene from CRU feed Provide feed for Isomerisation
Isomerisation New 7,400 BPSD using C5/C6 Naphtha Feed Improve Octane from 70 MON to 80 MON

15
PROGRAM SCOPE (Cont’d)
CCR Platformer Replace Fixed Bed Platformers Improve product Octane from 86 MON to 90 MON
Alkylation New using C3/C4 ex FCCU New Acid Regen Plant Optimize LPG Production
Offsites & Utilities New Boiler & Water Treating Tanks, Transfer Systems Power Supply Control equipment Flare System

16
PROGRAM SCOPE (Cont’d)
New ULSD Hydrogenator 35,000 BPSD unit 8 – 9 point cetane lift < 25% aromatics 8 ppm S

17
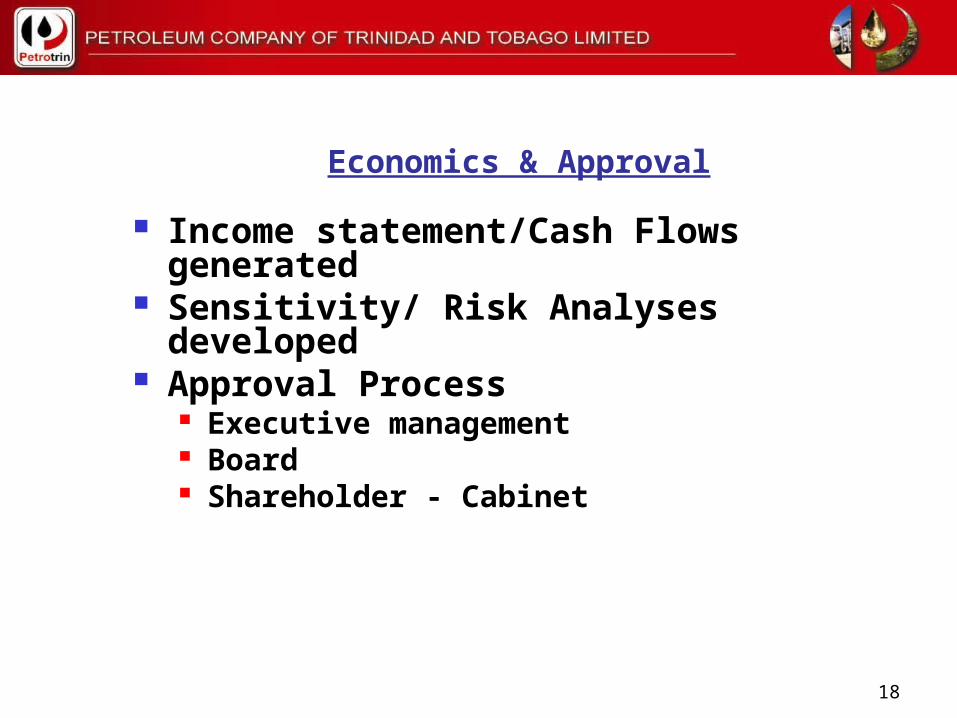
Economics & Approval
LP model Runs Delta economics
Base case vs enhanced Price/markets scenario forecast Optimum configuration determined
Capex Estimates Published/licensor data Inflated for time/location/experience
Economics developed Increased margin DCFROR NPV Payback
18
Economics & Approval
Income statement/Cash Flows generated
Sensitivity/ Risk Analyses developed Approval Process
Executive management Board Shareholder - Cabinet

19
CAPITAL EXPENDITURE
New Units ISBL 630 MM OSBL, Project Mgmt Other 170 MM
TOTAL (2006) 800 MM
ORIGINAL ESTIMATE 650 MM (2005)

20
PROGRAM BENEFITS
Gasoline Optimisation Program Increase Gasoline Quantity
Total from 24% to 30% Eliminate Unfinished Products (Naphtha &
VGO) Improve Gasoline Quality
Increase MON from 83 to 86 Reduce Benzene from 1.6% to 0.7% Reduce sulphur fron 41 ppm to 8 ppm
Customer Satisfaction Lower Olefins in LPG Ability to eliminate MTBE

21
PROGRAM BENEFITS (Cont’d) ULSD HTU
Improve Gas Oil Quality Increase Pool Cetane Reduce Aromatics/ Pool Sulfur
Improved Operations of the P-a-P Refinery Energy Efficiency & Environmental Compliance Increase full refining capacity to 168 MBPCD Ability to process sour, low cetane crudes
Petrocaribe (New) Products displaced from regional market Improved Quality can be marketed elsewhere

22
COUNTRY BENEFITS
Local Content:20% or US$ 160 million Maximize local sub contractors Offsite Works by Petrotrin
Construction Labor: 14million hours Peak Site Labor: 2,800 Corp Tax / UL: US$ 375 million Sustained Operations of P-a-P Refinery
Security of Fuel Supply / Prices Economic Activity

23
PROJECT RISKS
Market / Product Pricing Delay in Tighter Specs / Conservative Prices
Used Capital Cost Overrun
Scope of Work EPC Contracts – Hybrid vs Lump Sum
Schedule Delays Statutory Approval Experienced EPC Contractors Industrial relations problems Skilled sub-contractor labour

24
PROJECT RISKS
Technology: Well Proven / State-of –the Art
Environmental: No new type of effluent Refinery systems (current and
proposed) adequate Funding:
Current Market Conditions Ideal for Loan

25
Status
Pre Frac/Isomerization EPC awarded Piling commenced Commercial production Dec 2007
FCCU upgrade Discussions on EPC award – Hybrid contract Project completion date April 2008
CCR Platformer EPC Negotiations complete ETC December 2008
Alky / Acid Hybrid contract
Lump sum for services Re imbursable for Equipment/materials

26
Status – Points to Note
Get Project Manager on board early. Licensor estimates normally low. Don’t forget infrastructure and
services Industry quite busy – Innovative bid
requests required. Fast track procurement on long lead
items Monitoring and control essential

27
GAS OPT PROGRAM- FINANCING PLAN
MAJOR FINANCING OPTIONS
MAJOR OPTION COMMENTS
Bank Loan
Corporate Bond
Structured Commodity Finance
Pre-export loan
Note: Fixed Rate funding with minimum 10 Year tenor and minimum 2 Year moratorium is preferred.

28
FINANCING SCHEDULE
TASK START DATE
END DATE
Approvals from Government
Credit Rating Review by Moody’s and Standard & Poors
Approvals from IADB, JBIC, EIB, CDB, MBIA
Engagement of Financial Advisor
Expressions of Interest from, and short-listing of financial institutions
Tendering, Selection & engagement of placement institution
Engagement of Lawyer
Loan Sourcing, Negotiation and Conclusion

29
Muchas Gracias


![Hilaire, Constantine and Benjamin et al. v. Trinidad and ......2015]Hilaire, Constantine, and Benjamin et al. v. Trin.And Tobago1093 Extrajudicial, Summary or Arbitrary Executions](https://img.pdfslide.us/doc/110x75/5e77def6af25757ebf7de0bd/hilaire-constantine-and-benjamin-et-al-v-trinidad-and-2015hilaire-constantine.jpg)


![Hilaire Belloc-Las Grandes Herejias[1]](https://img.pdfslide.us/doc/110x75/55cf9d92550346d033ae342b/hilaire-belloc-las-grandes-herejias1.jpg)